Abstract
By introducing various N‐containing compounds as efficient linkers, a series of hyper‐crosslinked porous polymers with high surface areas and gas‐uptake values were synthesized by using the Friedel–Crafts alkylation reaction. Structural characterization indicated the presence of nitrogen atoms, and gas‐sorption experiments revealed that the high gas uptake benefitted from the high surface areas and the incorporation of N‐containing linkers as Lewis basic sites. Among these porous polymers, HCP‐4 had the highest H2 uptake of 9.29 mmol g−1 at 77 K and 0.1 MPa and the highest C2H2 uptake of 6.69 mmol g−1 at 273 K and 0.1 MPa, whereas HCP‐3 showed the best CO2 uptake of 4.42 mmol g−1 at 273 K and 0.1 MPa. To understand better the important role played by nitrogen in these polymers, the isosteric heat of adsorption and adsorption selectivity of CO2 over N2 were calculated. The results showed that the triazine‐based polymer HCP‐1 had the highest CO2 over N2 selectivity of 75.4 at 295 K and 0.1 MPa, which makes it the most potential candidate for CO2 capture.
Keywords: adsorption, gas separation, Lewis bases, N-containing linkers, polymers
1. Introduction
A global environmental catastrophe is coming with intensified global warming and a rapid rise in the sea level due to the massive emission of greenhouse gases following the consumption of traditional fossil fuels after the industrial revolution.1 Many strategies have been proposed to solve the problems brought by climate change. One feasible strategy is to reduce the usage of fossil fuels and turn to the popularization of clean energy, such as hydrogen. It is critical to design rational porous materials for carbon capture and separation2 and for hydrogen storage.3 Porous organic polymers (POPs), which feature low skeletal density and excellent thermal and chemical stability, have experienced rapid development over the past decade. Much effort has been devoted to exploring these porous materials in many fields, such as gas storage and separation,4 catalysis,5 and chemical sensing.6 POPs are usually composed of organic building blocks that are connected through the Sonogashira reaction,7 Yamamoto reaction,8 Suzuki coupling reaction,9 Friedel–Crafts alkylation reaction,10 and Schiff‐base reaction,11 and they can be classified into covalent organic frameworks (COFs),12 porous polymer networks (PPNs),13 porous aromatic frameworks (PAFs),14 conjugated microporous polymers (CMPs),15 hyper‐crosslinked polymers (HCPs),16 crystalline triazine‐based frameworks (CTFs),17 polymers of intrinsic microporosity (PIMs),18 and so on.
Hypercross‐linked polymers have drawn much attention due to their low cost, high yield, and moderate reaction conditions during the preparation of POPs in recent years. Generally, HCPs can be easily obtained by the Friedel–Crafts (F‐C) alkylation reaction with cheap and readily available Lewis acids as catalysts, commonly AlCl3 and FeCl3.19 Relative to other coupling reactions catalyzed by noble metals, the F‐C alkylation reaction has great potential applications in large‐scale industrial production. Strategies for the design of previously reported HCPs can be divided into two main methods. One is the self‐condensation of chloromethyl‐ or hydroxymethyl‐modified organic molecule units.20 A polymer forms if an electrophilic substitution reaction occurs after the chloride or hydroxy group leaves under the catalysis of a Lewis acid. Recently, the Tan group explored a new method for the one‐step, self‐condensation of monomers without functional groups that was based on the Scholl reaction.21 Thus, the construction of HCPs is no longer limited to special monomers, and conjugated structures of aromatic compounds can be well maintained, which will make HCPs potential candidates in optoelectronics applications. The second method involves knitting aromatic compounds with cross‐linking agents. The most commonly used cross‐linking agent is formaldehyde dimethyl acetal (FDA).22 The Tan group first introduced FDA for the construction of HCPs and paved the way for the further development of synthesis strategies.23 The Ahn group utilized 2,4,6‐trichloro‐1,3,5‐triazine to construct microporous covalent triazine‐based organic polymers (MCTPs).24 These polymers can also be regarded as HCPs with triazine as a cross‐linker. Due to the introduction of the triazine ring, MCTP‐1 showed significant CO2‐uptake capacity of 204.3 mg g−1 at 273 K and 0.1 MPa. In previous work, our group tried to use benzyl bromides as cross‐linkers to knit benzene and its homologues, and this proved to be an effective method to obtain HCPs with high surface areas and gas‐uptake values.25 C1M3‐Al exhibited a high surface area up to 1783 m2 g−1 and a H2‐uptake capacity of 19.1 mg g−1 at 77 K and 0.1 MPa. However, cross‐linkers are still limited to those that are known. More strategies for the design of HCPs need to be explored.
It has been proven that nitrogen atoms in POPs contribute to the adsorption and separation of carbon dioxide.26 The groups of Chen27 and He28 independently reported several Nbo‐type metal‐organic frameworks (MOFs) with enhanced acetylene uptake in the presence of Lewis basic nitrogen sites. However, the synthesis methods used for these porous materials were costly and always needed harsh conditions. Herein, we developed a new method for the synthesis of porous organic polymers at a low cost and under mild conditions. A series of HCPs with high specific surface areas and excellent gas‐uptake capacities were prepared by the F‐C alkylation reaction under moderate conditions. We first adopted a strategy involving the use of various N‐containing heterocyclic rings as cross‐linkers to form the networks, as illustrated in Scheme 1. We selected several N‐containing heterocyclic compounds, including 2,4,6‐trichloro‐1,3,5‐triazine (TCT), 3,6‐dichloropyridazine (DCD), 4,6‐dichloropyrimidine (DCM), and 2,6‐dichloropyrazine (DCP), to react with 1,3,5‐triphenylbenzene (TPB) to obtain a series of N‐containing HCPs. The conditions for the synthesis of HCP‐1–4 are shown in Scheme 2. Gas‐sorption experiments were performed to characterize the porosities of these polymers. Among them, HCP‐4 exhibited a superhigh specific surface area of up to 1951 m2 g−1, and all of the HCPs showed excellent gas‐uptake capacities, no matter whether the gas was H2, C2H2, or CO2. In addition, the gas selectivity of CO2/N2 was calculated by ideal adsorption solution theory (IAST) to predict the separation efficiencies of the HCPs.
Scheme 1.
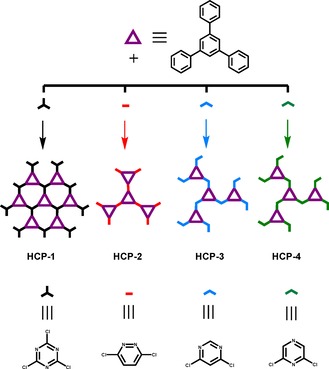
Strategy for the design of the HCPs.
Scheme 2.
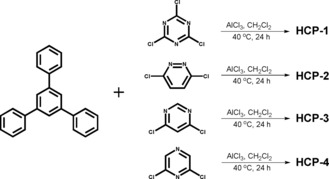
Conditions for the synthesis of the HCPs.
2. Results and Discussion
The HCPs were synthesized by knitting TPB with a series of N‐containing compounds by F‐C alkylation under mild conditions. All of the reactants and catalyst were mixed in dichloromethane with stirring at 40 °C for 1 day to complete the reaction. The precipitates were collected in good yields by filtering the mixed solutions. For further purification, different solvents were used to wash the crude products to remove the unreacted reactants and catalyst. The solid products obtained were dried in a vacuum oven for 12 h at 120 °C (Figure S1, Supporting Information).
To confirm the construction of the polymers, they were analyzed by Fourier‐transform infrared (FTIR) spectroscopy and 13C cross‐polarization magic‐angle‐spinning (CP/MAS) NMR spectroscopy (Figures 1 and 2). In the FTIR spectra of the polymers, the moderately intense bands peaks between =1400 and 1600 cm−1 are ascribed to vibrations of the aromatic ring skeleton of TPB. The FTIR spectrum of HCP‐1 is shown as a representative example in Figure S2. The weak bands at =1506 and 1375 cm−1 appearing in the spectrum of HCP‐1 may be assigned to the C=N and C−N stretching vibrations of the triazine ring, according to the literature.29 These bands are also observed in other polymers at the same position, which indicates the successful introduction of N‐containing linkers (Figures S3–S5). Moreover, the absence of a C−Cl stretching band at =850 cm−1 confirms the complete conversion of the halides.
Figure 1.
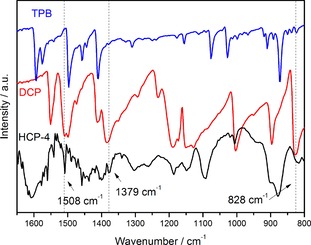
FTIR spectra of HCP‐1–4.
Figure 2.
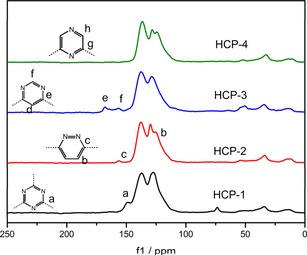
Solid‐state 13C CP/MAS NMR spectra of HCP‐1–4.
As shown in the solid‐state 13C CP/MAS NMR spectrum, the resonances at around δ=137 and 128 ppm can be assigned to the carbon atoms of the aromatic rings (Figure 2). All of the polymers show resonances of the methylene moiety at δ=34 ppm, mainly because of the use of dichloromethane as the solvent and because of the external cross‐linker in the F‐C alkylation reaction.30 A weak signal at δ=73 ppm in the spectrum of HCP‐1 is ascribed to the carbon atom of methanol absorbed in the micropores of the polymers, which inevitably remained in the ultra‐micropores even after vacuum drying.21 Taking HCP‐2 as an example, in addition to the benzene signals there are another two weak signals at δ=156 and 125 ppm corresponding to the aromatic carbon atoms in the ortho and meta positions of the nitrogen atoms in the pyridazine rings, respectively. Some signals corresponding to certain carbon atoms in the pyrimidine and pyrazine rings are not clear in the spectrum, probably because they are covered by the intense signals of the benzene ring.
The amorphous structure of the HCPs was determined by powder X‐ray diffraction (PXRD) and scanning electron microscopy (SEM) (Figures S6–S10). The SEM images reveal a morphology consisting of aggregated spherical particles. Thermogravimetric analysis (TGA) was performed to estimate the stability of the polymers (Figures S11 and S12). The HCPs show similar thermogravimetric behaviors and start to decompose under a nitrogen atmosphere at 250 °C. The elementary composition of the polymers was confirmed by elemental analysis, inductively coupled plasma analysis (ICP), and energy‐dispersive spectroscopy (EDS). From the weight percentages of the different elements in the HCPs shown in Table S1, the nitrogen content is higher in HCP‐1 and HCP‐3 than in HCP‐2 and HCP‐4, which can be explained by the fact that TCT and DCM are more reactive than DCD and DCP, apart from measurement errors caused by incomplete combustion. The existence of small amounts of residual aluminum and chlorine can be ascribed to the trapped catalyst in the polymers.25
To understand better the positive impact brought by the N‐containing linkers, the porosities of the HCPs were evaluated by N2 gas‐sorption isotherms at 77 K. As shown in Figure 3 a, all the samples exhibit a classical type I isotherm with a sharp uptake at a low relative pressure (P/P 0<0.1), which indicates the presence of permanent micropores. Notably, there is a marked hysteresis with a gradual increase in N2 uptake at high relative pressures (P/P 0=0.1–1.0) in HCP‐2 and HCP‐4, which shows that the mesopores account for a large portion of the uptake. The porosity data of the Brunauer–Emmett–Teller (BET) surface areas and the pore volumes of the four polymers are listed in Table 1. The BET surface areas are appreciable and range from 1009 to 1951 m2 g−1. Among them, HCP‐4 has the highest surface area of up to 1951 m2 g−1 and the biggest total volume of 1.46 cm3 g−1, which is comparable to or better than the reported HCPs knitted by FDA.22c, 31 In addition, although the DCM and DCP linkers are the same in terms of steric configuration, the corresponding HCP‐3 and HCP‐4 samples display significant differences in their pore structures. In contrast, TCT, as a three‐dimensional linker, is different from the two‐dimensional DCM linker; however, HCP‐1 and HCP‐3 show amazing consistency in terms of porosity. Unlike the reticular chemistry proposed in MOFs,32 the connections between the monomers and linkers are in disorder during synthesis. The construction of the HCPs is decided by the combined effects of many factors, including the activities of the reactants.
Figure 3.
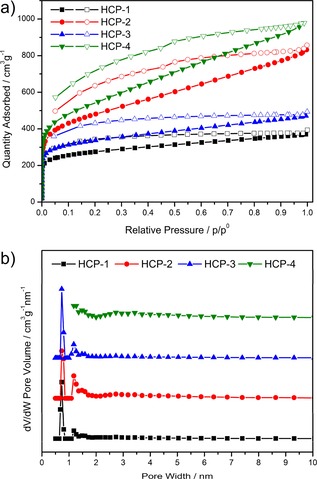
a) N2‐sorption isotherms of HCP‐1–4 measured at 77 K. b) Pore‐size distributions of HCP‐1–4.
Table 1.
Porosity data for HCP‐1–4.
| Polymer | S BET [a] [m2 g−1] | V Micro [b] [cm3 g−1] | V Total [c] [cm3 g−1] | V Micro/V Total |
|---|---|---|---|---|
| HCP‐1 | 1009 | 0.24 | 0.56 | 0.43 |
| HCP‐2 | 1742 | 0.27 | 1.23 | 0.22 |
| HCP‐3 | 1231 | 0.29 | 0.71 | 0.41 |
| HCP‐4 | 1951 | 0.25 | 1.46 | 0.17 |
[a] BET surface area. [b] Micropore volume calculated by the t‐plot method. [c] Pore volume calculated from the N2 isotherm at P/P 0=0.95 and 77 K.
The pore‐size distributions (PSDs) calculated by the nonlocal density functional theory (NLDFT) model are illustrated in Figure 3 b. From the picture, two narrow peaks at pore widths of 0.73 and 1.18 nm are observed in HCP‐1–3, and this is indicative of the presence of micropores. However, HCP‐4 exhibits a broad peak at pore widths between 2 and 6 nm mainly in the mesoporous region, besides the centered peaks smaller than pore widths of 2 nm. Mesopores occupy a large proportion of all the pores in HCP‐4, which is corroborated by the N2‐sorption isotherms.
To investigate the gas‐uptake capacity of the HCPs further, adsorption isotherms for H2, C2H2, and CO2 were collected under different conditions. The gas‐sorption isotherms of the HCPs are shown in Figure 4 a–c. The H2‐sorption isotherms were collected at 77 and 87 K up to 0.1 MPa. All of the samples exhibit good adsorption performance with uptake values ranging from 7.49 to 9.29 mmol g−1 at 77 K and 0.1 MPa. Among them, HCP‐4 has the highest H2‐uptake capacity of up to 9.29 mmol g−1, and thus the H2‐uptake capacities follow the same trend as the BET surface areas for the HCPs. The C2H2 isotherms were also measured at 273 and 295 K up to 0.1 MPa to explore the effect of nitrogen atoms in the polymers, as nitrogen atoms were proven to have a positive influence on C2H2 uptake in MOFs as Lewis basic sites.27, 28 Although HCP‐1 has the lowest C2H2 uptake of 5.56 mmol g−1 at 273 K and 0.1 MPa, it maintains the highest uptake at pressures below 0.01 MPa. The tendency is different from N2 uptake, which indicates the contribution of the triazine rings. The positive effect of the Lewis basic sites also works on HCP‐3 due to the introduction of the pyrimidine ring. HCP‐2 and HCP‐4 show a gradual increase in C2H2 uptake at a lower pressure than HCP‐1 and HCP‐3, probably because of the relatively low contents of nitrogen (1.82 and 1.08 wt %, respectively) introduced into the polymers. However, HCP‐4 has the highest C2H2‐uptake capacity of up to 6.69 mmol g−1 at 273 K and 0.1 MPa, as it benefits from the largest BET surface area. To summarize, the C2H2 adsorption in these HCPs may be affected by the combined action of the surface area and the nitrogen content. The effect of nitrogen on CO2 adsorption was also explored at 273 and 295 K up to 0.1 MPa. At 273 K and 0.1 MPa, the CO2 uptakes of HCP‐1–4 are 4.24, 4.05, 4.42, and 4.25 mmol g−1, respectively. These results are comparable with those obtained for published POPs under the same conditions, including CTF‐Bl‐5 (4.49 mmol g−1)33 and COF‐JLU2 (4.93 mmol g−1).34 In the low‐pressure region, the adsorption of CO2 is the same as the adsorption of C2H2. HCP‐1 and HCP‐3 display a rapid rise in CO2 uptake with nitrogen contents of 5.95 and 4.52 wt %, which implies interaction between molecular CO2 and the N‐containing polymer skeletons. According to the previously reported exploration, triazine rings are favorable absorbents for CO2 adsorption.35 Herein, we have proven that N‐containing heterocyclic rings can also be treated as efficient units for either carbon capture or acetylene adsorption. However, pyridazine‐ and pyrazine‐containing HCPs with low nitrogen contents need further detailed exploration to verify the contribution they make to gas adsorption.
Figure 4.
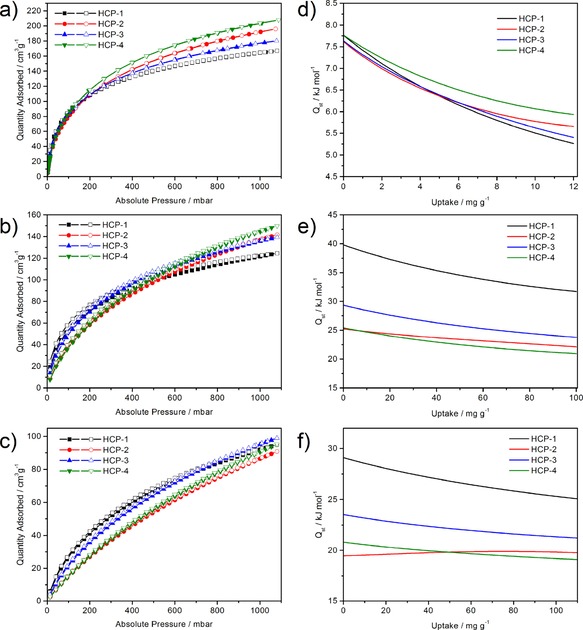
Gas‐sorption isotherms of HCP‐1–4: a) H2 at 77 K and 1 bar, b) C2H2 at 273 K and 1 bar, and c) CO2 at 273 K and 1 bar (1 bar=0.1 MPa). Heats of adsorption for HCP‐1–4: d) H2 measured at 77 and 87 K, e) C2H2 measured at 273 and 295 K, and f) CO2 measured at 273 and 295 K.
To estimate better the binding affinity between the adsorbed gas and the polymer skeleton, the isosteric heats of adsorption (Q st) for H2, C2H2, and CO2 were calculated by using the Clausius–Clapeyron equation (Figure 4 d–f and Table 2). The Q st values for H2 were obtained by using H2‐adsorption isotherms at 77 and 87 K. This gave a range of 7.6 to 7.8 kJ mol−1 at the onset of adsorption, and these values are higher than that obtained for microporous polyimide networks (5.3–7.0 kJ mol−1)36 but are lower than that obtained for the HCPs (7.9–9.1 kJ mol−1) reported previously by our group.25 The four polymers give Q st values for H2 that are very close, and consequently, nitrogen atoms have little effect on hydrogen uptake. The values for C2H2 and CO2 were acquired by using the respective adsorption isotherms at 273 and 295 K. HCP‐1 has the highest Q st for C2H2 of about 39.8 kJ mol−1 at zero coverage, and this value is even higher than that of either MOF ZJU‐5 (35.8 kJ mol−1)27a or ZJNUs (26.9–35.0 kJ mol−1).28b Unlike H2, HCP‐2 and HCP‐4 have Q st values for C2H2 of 25.3 and 25.4 kJ mol−1, which are both much lower than that of HCP‐1, presumably because of a decrease in the Lewis basic sites. A similar situation is observed on CO2. The HCPs exhibit Q st values for CO2 in the range of 19.5 to 29.1 kJ mol−1, and these values are lower than those of modified porous polymer networks (30.4–35.7 kJ mol−1)37 but are higher than those of the HCPs (21.2–23.5 kJ mol−1).38 According to the above results, the introduction of nitrogen atoms into the polymer skeleton has a significant influence on C2H2 and CO2 uptake.
Table 2.
Gas uptake and selectivity data for HCP‐1–4.
| Polymer | Gas uptake[a] [mmol g−1] | Q st [b] [kJ mol−1] | CO2/N2 selectivity[c] | |||||
|---|---|---|---|---|---|---|---|---|
| H2 | C2H2 | CO2 | H2 | C2H2 | CO2 | 273 K | 295 K | |
| HCP‐1 | 7.46 | 5.56 | 4.24 | 7.8 | 39.8 | 29.1 | 92.3 | 75.4 |
| HCP‐2 | 8.75 | 6.33 | 4.05 | 7.6 | 25.3 | 19.5 | 28.8 | 23.7 |
| HCP‐3 | 8.04 | 6.22 | 4.42 | 7.6 | 29.3 | 23.5 | 57.5 | 42.9 |
| HCP‐4 | 9.29 | 6.69 | 4.25 | 7.8 | 25.4 | 20.8 | 25.7 | 21.0 |
[a] Data were recorded at 77 K/0.1 MPa for H2, 273 K/0.1 MPa for C2H2, and 273 K/0.1 MPa for CO2. [b] Heat of adsorption at zero loading for H2, C2H2, and CO2, respectively. [c] IAST‐predicted adsorption selectivities at 273 and 295 K, using a 15:85 CO2/N2 ratio at 0.1 MPa.
It is well known that the flue gases from power plants produced by the combustion of fossil fuels contain 15 % CO2 and 85 % N2. So, it is necessary for the HCPs to achieve selective adsorption of CO2 from mixed gases of CO2 and N2.
Motivated by this, the four polymers were tested for their CO2/N2 selectivity. The CO2‐and N2‐adsorption isotherms were required to be measured at 273 and 295 K up to 0.1 MPa to complete the single‐component adsorption isotherms. To estimate the CO2/N2 adsorption selectivity, the single‐site Langmuir–Freundlich model was used to get selectivity parameters according to IAST,39 which was previously used to calculate separation of the mixed gases successfully. The selectivities of CO2 over N2 for the four polymers at 273 and 295 K are shown in Table 2 and Figure 5. HCP‐1 has the highest CO2/N2 separation selectivity of 92.3 at 273 K and 75.4 at 295 K, which is quite different from that reported for MCTP‐1 (15.4 at 298 K) calculated by the initial slope method.24 Although the two polymers have the same reactants, HCP‐1 has a narrower pore width and uptakes less N2, which may lead to higher CO2/N2 selectivity. The excellent selectivity is comparable or higher than that of DBT (86 at 273 K, 80 at 295 K)40 and that of CTF‐BI‐3 (88.5 at 273 K, 52.4 at 303 K),33 which makes HCP‐1 one of the most potential materials for flue gas treatment. HCP‐2 and HCP‐4 have moderate selectivity relative to HCP‐1 and HCP‐3, possibly due to the lower concentration of Lewis base sites in the polymers. All in all, HCP‐1 and HCP‐3 have higher Q st values for C2H2 and CO2 and higher selectivities for CO2 over N2 than HCP‐2 and HCP‐4, which indicates the content of nitrogen plays an important role in gas uptake and separation.
Figure 5.
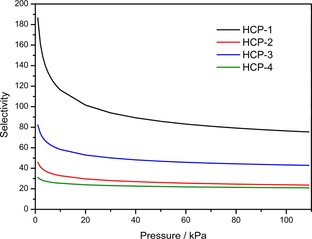
Selectivity of CO2 over N2 calculated by the IAST method at 295 K.
3. Conclusions
In summary, we successfully introduced nitrogen atoms into polymers by using a simple and feasible method. A series of hyper‐crosslinked polymers (HCPs) were synthesized by Friedel–Crafts alkylation with various N‐containing heterocyclic compounds as linkers. The HCPs were found to possess high specific surface areas (up to 1951 m2 g−1) and excellent gas‐uptake capacities. Due to the introduction of nitrogen atoms, the HCPs had high binding affinity to C2H2 and CO2, and thus, the HCPs are comparable to previously reported metal–organic frameworks and porous organic polymers. The separation selectivity of the four polymers for CO2 over N2 was also estimated to explore the effect of nitrogen in the polymer skeleton. Among them, HCP‐1 showed the highest selectivity of 75.4 at 295 K, which makes it one of the most potential candidates in carbon capture and separation. By knitting monomers with the N‐containing linkers, N‐containing polymers were easily obtained. By this method, we were able to enlarge the application scope of the Friedel–Crafts alkylation reaction in polymer synthesis. Further exploration of the synthesis and applications of HCPs is on the way.
Experimental Section
General Information
1,3,5‐Triphenylbenzene (TPB) (98 %), 2,4,6‐trichloro‐1,3,5‐triazine (TCT) (98 %), 3,6‐dichloropyridazin (DCD) (98 %), 4,6‐dichloropyrimidine (DCM) (98 %), and 2,6‐dichloropyrazine (DCP) (98 %) were obtained from Adamas. Anhydrous aluminum chloride (99 %) was purchased from Alfa. All chemicals for the syntheses were used without further purification. Fourier‐transform infrared (FTIR) spectra were recorded with KBr pellets in the range of =3600 to 400 cm−1 under ambient conditions by using a Bomem MB‐102 IR spectrometer. Solid‐state 13C cross‐polarization magic‐angle‐spinning (CP/MAS) NMR spectra were obtained with a Bruker Avance II 400 WB 400 MHz spectrometer equipped with a 4 mm double‐resonance MAS probe and a spinning frequency of 8 kHz. Thermogravimetric analysis (TGA) was performed with a Mettler‐Toledo TGA/SDTA851e thermal analyzer at a rate of 10 °C min−1 under a nitrogen atmosphere in the range of 20 to 1000 °C. Powder X‐ray diffraction (PXRD) patterns were collected in the 2 θ range of 4 to 50° at a scanning rate of 3° min−1 with CuKα radiation (λ=1.5406 Å) by using a Rigaku‐Dmax 2500 diffractometer. Elemental analysis (EA) was determined by using an Elementar Vario MICRO elemental analyzer. Inductively coupled plasma (ICP) analysis was performed with an Ultima‐2 ICP emission spectrometer. Scanning electron microscopy (SEM) experiments were performed with a JSM 6700 at 10.0 kV with gold sputter coated on the surface of samples before measurement. Energy‐dispersive spectroscopy (EDS) was performed by using a JSM 6700 microscope. N2‐sorption isotherms were measured by using a Micromeritics ASAP 2020 PLUS HD88 surface area and porosimetry analyzer at 77 K. The specific surface areas of the polymers were calculated by using the BET model over a relative pressure (P/P 0) range of 0.05 to 0.15. Pore‐size distributions were calculated by N2‐adsorption isotherms by employing the nonlocal density functional theory (NLDFT) model. Total pore volumes (V Total) were calculated from the N2‐sorption isotherms at P/P 0=0.995. The samples were degassed at 150 °C for 10 h under vacuum before analysis. H2‐sorption isotherms were collected with an ASAP 2020 PLUS at 77 and 87 K up to 0.108 MPa. CO2‐, N2‐, and C2H2‐sorption isotherms were measured with an ASAP 2020 surface area and porosimetry analyzer at 273 and 295 K.
HCP Syntheses
Synthesis of HCP‐1: HCP‐1 was prepared by a literature‐reported method with slight modifications.24 Dry dichloromethane (20 mL) was injected into a mixture of TPB (1 mmol, 306 mg), TCT (1 mmol, 185 mg), and anhydrous aluminum chloride (7.5 mmol, 1 g) in a 100 mL, round‐bottomed flask under an argon atmosphere. The mixture heated to 40 °C and was stirred for 24 h to ensure a complete reaction. After the solution was cooled to room temperature, a small amount of methanol was added to quench the reaction, and the residue was collected by extraction filtration. The crude product was washed with diluted hydrochloric acid, methanol, acetonitrile, and dichloromethane and was then extracted with methanol by using a Soxhlet extractor for 24 h for further purification. A dark‐brown powder was obtained after drying in a vacuum oven at 120 °C for 12 h. Elemental analysis calcd (%) for (C27H15N3)n (381 n): C 85.04, H 3.94, N 11.02 (based on complete reaction of the starting materials in a 1:1 ratio with thorough removal of chlorine); found: C 70.45, H 5.70, N 5.95.
Synthesis of HCP‐2: HCP‐2 was prepared by a procedure similar to that outlined for HCP‐1, except that TCT was replaced with DCD (1.5 mmol, 224 mg). The polymer was obtained as an orange powder. Elemental analysis calcd (%) for (C20H12N2)n (280 n): C 85.71, H 4.29, N 10.00 (based on complete reaction of the starting materials in a 2:3 ratio with thorough removal of chlorine); found: C 81.85, H 4.61, N 1.82.
Synthesis of HCP‐3: HCP‐3 was prepared by a procedure similar to that outlined for HCP‐1, except that TCT was replaced with DCM (1.5 mmol, 224 mg). The polymer was obtained as a brown powder. Elemental analysis calcd (%) for (C20H12N2)n (280 n): C 85.71, H 4.29, N 10.00 (based on complete reaction of the starting materials in a 2:3 ratio with thorough removal of chlorine); found: C 71.46, H 5.72, N 4.52.
Synthesis of HCP‐4: HCP‐4 was prepared by a procedure similar to that outlined for HCP‐1, except that TCT was replaced with DCP (1.5 mmol, 224 mg). The polymer was obtained as an orange powder. Elemental analysis calcd (%) for (C20H12N2)n (280 n): C 85.71, H 4.29, N 10.00 (based on complete reaction of the starting materials in a 2:3 ratio with thorough removal of chlorine); found: C 85.21, H 4.85, N 1.08.
Conflict of interest
The authors declare no conflict of interest.
Supporting information
As a service to our authors and readers, this journal provides supporting information supplied by the authors. Such materials are peer reviewed and may be re‐organized for online delivery, but are not copy‐edited or typeset. Technical support issues arising from supporting information (other than missing files) should be addressed to the authors.
Supplementary
Acknowledgements
This work was supported by the National Key R&D Program of China (2016YFB0600903) and Strategic Priority Research Program of the Chinese Academy of Sciences, Grant No. XDB20000000.
Z. Jia, J. Pan, D. Yuan, ChemistryOpen 2017, 6, 554.
References
- 1.
- 1a. Haszeldine R. S., Science 2009, 325, 1647–1652; [DOI] [PubMed] [Google Scholar]
- 1b. D'Alessandro D. M., Smit B., Long J. R., Angew. Chem. Int. Ed. 2010, 49, 6058–6082; [DOI] [PubMed] [Google Scholar]; Angew. Chem. 2010, 122, 6194–6219; [Google Scholar]
- 1c. Wang W., Zhou M., Yuan D., J. Mater. Chem. A 2017, 5, 1334–1347. [Google Scholar]
- 2.
- 2a. MacDowell N., Florin N., Buchard A., Hallett J., Galindo A., Jackson G., Adjiman C. S., Williams C. K., Shah N., Fennell P., Energy Environ. Sci. 2010, 3, 1645–1669; [Google Scholar]
- 2b. Li J. R., Sculley J., Zhou H. C., Chem. Rev. 2012, 112, 869–932; [DOI] [PubMed] [Google Scholar]
- 2c. Sumida K., Rogow D. L., Mason J. A., McDonald T. M., Bloch E. D., Herm Z. R., Bae T. H., Long J. R., Chem. Rev. 2012, 112, 724–781; [DOI] [PubMed] [Google Scholar]
- 2d. Zhang Z., Yao Z.-Z., Xiang S., Chen B., Energy Environ. Sci. 2014, 7, 2868–2899. [Google Scholar]
- 3.
- 3a. Li Y., Yang R. T., J. Am. Chem. Soc. 2006, 128, 8136–8137; [DOI] [PubMed] [Google Scholar]
- 3b. Pumera M., Energy Environ. Sci. 2011, 4, 668–674; [Google Scholar]
- 3c. Suh M. P., Park H. J., Prasad T. K., Lim D. W., Chem. Rev. 2012, 112, 782–835. [DOI] [PubMed] [Google Scholar]
- 4.
- 4a. Zhang M., Perry Z., Park J., Zhou H.-C., Polymer 2014, 55, 335–339; [Google Scholar]
- 4b. Qiao S., Huang W., Du Z., Chen X., Shieh F.-K., Yang R., New J. Chem. 2015, 39, 136–141; [Google Scholar]
- 4c. Xie L. H., Suh M. P., Chem. Eur. J. 2013, 19, 11590–11597; [DOI] [PubMed] [Google Scholar]
- 4d. Dong J., Wang Y., Liu G., Cheng Y., Zhao D., CrystEngComm 2017, https://doi.org/10.1039/C7CE00344G. [Google Scholar]
- 5.
- 5a. Du X., Sun Y., Tan B., Teng Q., Yao X., Su C., Wang W., Chem. Commun. 2010, 46, 970–972; [DOI] [PubMed] [Google Scholar]
- 5b. Zhang Y., Zhang Y., Sun Y. L., Du X., Shi J. Y., Wang W. D., Wang W., Chem. Eur. J. 2012, 18, 6328–6334; [DOI] [PubMed] [Google Scholar]
- 5c. Zhong H., Liu C., Zhou H., Wang Y., Wang R., Chem. Eur. J. 2016, 22, 12533–12541. [DOI] [PubMed] [Google Scholar]
- 6.
- 6a. Wu K., Guo J., Wang C., Chem. Commun. 2014, 50, 695–697; [DOI] [PubMed] [Google Scholar]
- 6b. Suresh V. M., Bandyopadhyay A., Roy S., Pati S. K., Maji T. K., Chem. Eur. J. 2015, 21, 10799–10804; [DOI] [PubMed] [Google Scholar]
- 6c. Ding S. Y., Dong M., Wang Y. W., Chen Y. T., Wang H. Z., Su C. Y., Wang W., J. Am. Chem. Soc. 2016, 138, 3031–3037. [DOI] [PubMed] [Google Scholar]
- 7.
- 7a. Jiang J. X., Su F., Trewin A., Wood C. D., Niu H., Jones J. T., Khimyak Y. Z., Cooper A. I., J. Am. Chem. Soc. 2008, 130, 7710–7720; [DOI] [PubMed] [Google Scholar]
- 7b. Stöckel E., Wu X., Trewin A., Wood C. D., Clowes R., Campbell N. L., Jones J. T., Khimyak Y. Z., Adams D. J., Cooper A. I., Chem. Commun. 2009, 212–214; [DOI] [PubMed] [Google Scholar]
- 7c. Trunk M., Herrmann A., Bildirir H., Yassin A., Schmidt J., Thomas A., Chem. Eur. J. 2016, 22, 7179–7183. [DOI] [PubMed] [Google Scholar]
- 8. Yuan D., Lu W., Zhao D., Zhou H. C., Adv. Mater. 2011, 23, 3723–3725. [DOI] [PubMed] [Google Scholar]
- 9. Jeon H. J., Choi J. H., Lee Y., Choi K. M., Park J. H., Kang J. K., Adv. Energy Mater. 2012, 2, 225–228. [Google Scholar]
- 10. Woodward R. T., Stevens L. A., Dawson R., Vijayaraghavan M., Hasell T., Silverwood I. P., Ewing A. V., Ratvijitvech T., Exley J. D., Chong S. Y., Blanc F., Adams D. J., Kazarian S. G., Snape C. E., Drage T. C., Cooper A. I., J. Am. Chem. Soc. 2014, 136, 9028–9035. [DOI] [PubMed] [Google Scholar]
- 11.
- 11a. Uribe-Romo F. J., Doonan C. J., Furukawa H., Oisaki K., Yaghi O. M., J. Am. Chem. Soc. 2011, 133, 11478–11481; [DOI] [PubMed] [Google Scholar]
- 11b. Huang N., Chen X., Krishna R., Jiang D., Angew. Chem. Int. Ed. 2015, 54, 2986–2990; [DOI] [PMC free article] [PubMed] [Google Scholar]; Angew. Chem. 2015, 127, 3029–3033. [Google Scholar]
- 12.
- 12a. El-Kaderi H. M., Hunt J. R., Mendoza-Cortes J. L., Cote A. P., Taylor R. E., O'Keeffe M., Yaghi O. M., Science 2007, 316, 268–272; [DOI] [PubMed] [Google Scholar]
- 12b. Furukawa H., Yaghi O. M., J. Am. Chem. Soc. 2009, 131, 8875–8883. [DOI] [PubMed] [Google Scholar]
- 13. Lu W., Yuan D., Zhao D., Schilling C. I., Plietzsch O., Muller T., Bräse S., Guenther J., Blümel J., Krishna R., Li Z., Zhou H.-C., Chem. Mater. 2010, 22, 5964–5972. [Google Scholar]
- 14. Ben T., Ren H., Ma S., Cao D., Lan J., Jing X., Wang W., Xu J., Deng F., Simmons J. M., Qiu S., Zhu G., Angew. Chem. Int. Ed. 2009, 48, 9457–9460; [DOI] [PubMed] [Google Scholar]; Angew. Chem. 2009, 121, 9621–9624. [Google Scholar]
- 15. Jiang J.-X., Su F., Trewin A., Wood C. D., Campbell N. L., Niu H., Dickinson C., Ganin A. Y., Rosseinsky M. J., Khimyak Y. Z., Cooper A. I., Angew. Chem. Int. Ed. 2007, 46, 8574–8578; [DOI] [PubMed] [Google Scholar]; Angew. Chem. 2007, 119, 8728–8732. [Google Scholar]
- 16.
- 16a. Wood C. D., Tan B., Trewin A., Niu H., Bradshaw D., Rosseinsky M. J., Khimyak Y. Z., Campbell N. L., Kirk R., Stöckel E., Cooper A. I., Chem. Mater. 2007, 19, 2034–2048; [Google Scholar]
- 16b. Errahali M., Gatti G., Tei L., Paul G., Rolla G. A., Canti L., Fraccarollo A., Cossi M., Comotti A., Sozzani P., Marchese L., J. Phys. Chem. C 2014, 118, 28699–28710; [Google Scholar]
- 16c. Dou Z., Xu L., Zhi Y., Zhang Y., Xia H., Mu Y., Liu X., Chem. Eur. J. 2016, 22, 9919–9922. [DOI] [PubMed] [Google Scholar]
- 17.
- 17a. Kuhn P., Antonietti M., Thomas A., Angew. Chem. Int. Ed. 2008, 47, 3450–3453; [DOI] [PubMed] [Google Scholar]; Angew. Chem. 2008, 120, 3499–3502; [Google Scholar]
- 17b. Bojdys M. J., Jeromenok J., Thomas A., Antonietti M., Adv. Mater. 2010, 22, 2202–2205. [DOI] [PubMed] [Google Scholar]
- 18.
- 18a. McKeown N. B., Budd P. M., Msayib K. J., Ghanem B. S., Kingston H. J., Tattershall C. E., Makhseed S., Reynolds K. J., Fritsch D., Chem. Eur. J. 2005, 11, 2610–2620; [DOI] [PubMed] [Google Scholar]
- 18b. McKeown N. B., Gahnem B., Msayib K. J., Budd P. M., Tattershall C. E., Mahmood K., Tan S., Book D., Langmi H. W., Walton A., Angew. Chem. Int. Ed. 2006, 45, 1804–1807; [DOI] [PubMed] [Google Scholar]; Angew. Chem. 2006, 118, 1836–1839; [Google Scholar]
- 18c. Ghanem B. S., Msayib K. J., McKeown N. B., Harris K. D., Pan Z., Budd P. M., Butler A., Selbie J., Book D., Walton A., Chem. Commun. 2007, 67–69. [DOI] [PubMed] [Google Scholar]
- 19. Xu S., Luo Y., Tan B., Macromol. Rapid Commun. 2013, 34, 471–484. [DOI] [PubMed] [Google Scholar]
- 20. Luo Y., Zhang S., Ma Y., Wang W., Tan B., Polym. Chem. 2013, 4, 1126–1131. [Google Scholar]
- 21. Li B., Guan Z., Yang X., Wang W. D., Wang W., Hussain I., Song K., Tan B., Li T., J. Mater. Chem. A 2014, 2, 11930–11939. [Google Scholar]
- 22.
- 22a. Dawson R., Stevens L. A., Drage T. C., Snape C. E., Smith M. W., Adams D. J., Cooper A. I., J. Am. Chem. Soc. 2012, 134, 10741–10744; [DOI] [PubMed] [Google Scholar]
- 22b. Dawson R., Ratvijitvech T., Corker M., Laybourn A., Khimyak Y. Z., Cooper A. I., Adams D. J., Polym. Chem. 2012, 3, 2034–2038; [Google Scholar]
- 22c. Zhu X., Mahurin S. M., An S. H., Do-Thanh C. L., Tian C., Li Y., Gill L. W., Hagaman E. W., Bian Z., Zhou J. H., Hu J., Liu H., Dai S., Chem. Commun. 2014, 50, 7933–7936. [DOI] [PubMed] [Google Scholar]
- 23. Li B., Gong R., Wang W., Huang X., Zhang W., Li H., Hu C., Tan B., Macromolecules 2011, 44, 2410–2414. [Google Scholar]
- 24. Puthiaraj P., Cho S.-M., Lee Y.-R., Ahn W.-S., J. Mater. Chem. A 2015, 3, 6792–6797. [Google Scholar]
- 25. Liu G., Wang Y., Shen C., Ju Z., Yuan D., J. Mater. Chem. A 2015, 3, 3051–3058. [Google Scholar]
- 26.
- 26a. Arab P., Rabbani M. G., Sekizkardes A. K., İslamoğlu T., El-Kaderi H. M., Chem. Mater. 2014, 26, 1385–1392; [Google Scholar]
- 26b. Wang K., Huang H., Liu D., Wang C., Li J., Zhong C., Environ. Sci. Technol. 2016, 50, 4869–4876; [DOI] [PubMed] [Google Scholar]
- 26c. Li H., Ding X., Han B. H., Chem. Eur. J. 2016, 22, 11863–11868. [DOI] [PubMed] [Google Scholar]
- 27.
- 27a. Rao X., Cai J., Yu J., He Y., Wu C., Zhou W., Yildirim T., Chen B., Qian G., Chem. Commun. 2013, 49, 6719–6721; [DOI] [PubMed] [Google Scholar]
- 27b. Wen H. M., Wang H., Li B., Cui Y., Wang H., Qian G., Chen B., Inorg. Chem. 2016, 55, 7214–7218. [DOI] [PubMed] [Google Scholar]
- 28.
- 28a. Song C., Hu J., Ling Y., Feng Y., Chen D. L., He Y., Dalton Trans. 2015, 44, 14823–14829; [DOI] [PubMed] [Google Scholar]
- 28b. Song C., Jiao J., Lin Q., Liu H., He Y., Dalton Trans. 2016, 45, 4563–4569. [DOI] [PubMed] [Google Scholar]
- 29. Puthiaraj P., Kim S.-S., Ahn W.-S., Chem. Eng. J. 2016, 283, 184–192. [Google Scholar]
- 30. Wang S., Song K., Zhang C., Shu Y., Li T., Tan B., J. Mater. Chem. A 2017, 5, 1509–1515. [Google Scholar]
- 31. Luo Y., Li B., Wang W., Wu K., Tan B., Adv. Mater. 2012, 24, 5703–5707. [DOI] [PubMed] [Google Scholar]
- 32. Yaghi O. M., O'Keeffe M., Ockwig N. W., Chae H. K., Eddaoudi M., Kim J., Nature 2003, 423, 705–714. [DOI] [PubMed] [Google Scholar]
- 33. Tao L., Niu F., Wang C., Liu J., Wang T., Wang Q., J. Mater. Chem. A 2016, 4, 11812–11820. [Google Scholar]
- 34. Li Z., Zhi Y., Feng X., Ding X., Zou Y., Liu X., Mu Y., Chem. Eur. J. 2015, 21, 12079–12084. [DOI] [PubMed] [Google Scholar]
- 35.
- 35a. Ren S., Bojdys M. J., Dawson R., Laybourn A., Khimyak Y. Z., Adams D. J., Cooper A. I., Adv. Mater. 2012, 24, 2357–2361; [DOI] [PubMed] [Google Scholar]
- 35b. Zhao Y., Yao K. X., Teng B., Zhang T., Han Y., Energy Environ. Sci. 2013, 6, 3684–3692. [Google Scholar]
- 36. Wang Z., Zhang B., Yu H., Sun L., Jiao C., Liu W., Chem. Commun. 2010, 46, 7730–7732. [DOI] [PubMed] [Google Scholar]
- 37. Lu W., Yuan D., Sculley J., Zhao D., Krishna R., Zhou H. C., J. Am. Chem. Soc. 2011, 133, 18126–18129. [DOI] [PubMed] [Google Scholar]
- 38. Martín C. F., Stöckel E., Clowes R., Adams D. J., Cooper A. I., Pis J. J., Rubiera F., Pevida C., J. Mater. Chem. 2011, 21, 5475–5483. [Google Scholar]
- 39. Myers A. L., Prausnitz J. M., AIChE J. 1965, 11, 121–127. [Google Scholar]
- 40. Saleh M., Lee H. M., Kemp K. C., Kim K. S., ACS Appl. Mater. Interfaces 2014, 6, 7325–7333. [DOI] [PubMed] [Google Scholar]
Associated Data
This section collects any data citations, data availability statements, or supplementary materials included in this article.
Supplementary Materials
As a service to our authors and readers, this journal provides supporting information supplied by the authors. Such materials are peer reviewed and may be re‐organized for online delivery, but are not copy‐edited or typeset. Technical support issues arising from supporting information (other than missing files) should be addressed to the authors.
Supplementary


