Supplemental Digital Content is available in the text.
Keywords: edema, ischemic preconditioning, ischemic postconditioning, magnetic resonance imaging, reperfusion injury, translational medical research
Abstract
Rationale:
The impact of cardioprotective strategies and ischemia duration on postischemia/reperfusion (I/R) myocardial tissue composition (edema, myocardium at risk, infarct size, salvage, intramyocardial hemorrhage, and microvascular obstruction) is not well understood.
Objective:
To study the effect of ischemia duration and protective interventions on the temporal dynamics of myocardial tissue composition in a translational animal model of I/R by the use of state-of-the-art imaging technology.
Methods and Results:
Four 5-pig groups underwent different I/R protocols: 40-minute I/R (prolonged ischemia, controls), 20-minute I/R (short-duration ischemia), prolonged ischemia preceded by preconditioning, or prolonged ischemia followed by postconditioning. Serial cardiac magnetic resonance (CMR)-based tissue characterization was done in all pigs at baseline and at 120 minutes, day 1, day 4, and day 7 after I/R. Reference myocardium at risk was assessed by multidetector computed tomography during the index coronary occlusion. After the final CMR, hearts were excised and processed for water content quantification and histology. Five additional healthy pigs were euthanized after baseline CMR as reference. Edema formation followed a bimodal pattern in all 40-minute I/R pigs, regardless of cardioprotective strategy and the degree of intramyocardial hemorrhage or microvascular obstruction. The hyperacute edematous wave was ameliorated only in pigs showing cardioprotection (ie, those undergoing short-duration ischemia or preconditioning). In all groups, CMR-measured edema was barely detectable at 24 hours postreperfusion. The deferred healing-related edematous wave was blunted or absent in pigs undergoing preconditioning or short-duration ischemia, respectively. CMR-measured infarct size declined progressively after reperfusion in all groups. CMR-measured myocardial salvage, and the extent of intramyocardial hemorrhage and microvascular obstruction varied dramatically according to CMR timing, ischemia duration, and cardioprotective strategy.
Conclusions:
Cardioprotective therapies, duration of index ischemia, and the interplay between these greatly influence temporal dynamics and extent of tissue composition changes after I/R. Consequently, imaging techniques and protocols for assessing edema, myocardium at risk, infarct size, salvage, intramyocardial hemorrhage, and microvascular obstruction should be standardized accordingly.
Ischemia/reperfusion (I/R) results in a dramatic change of myocardial tissue composition, mainly in the first days after myocardial infarction (MI).1,2 Edema formation, inflammation, microvascular injury, and ultimately healing, among other phenomena, accompany irreversible loss of cardiac myocytes after MI. Cardiac magnetic resonance (CMR) can noninvasively identify most of these phenomena; however, accounting for the temporal dynamics and factors affecting post-MI tissue composition might be crucial for a precise assessment of related imaging end points. To date, this has not been studied in a comprehensive manner.
Editorial, see p 326
Meet the First Author, see p 312
For years, the intense edematous reaction appearing in the postischemic region early after MI was thought to persist in stable form for at least 1 week.3,4 On this basis, delineating the extent of post-MI edema by CMR rapidly became established as a measure of the original occluded coronary artery perfusion territory (myocardium at risk [MaR]).5,6 Thus, the amount of salvaged myocardium7—a theoretically better surrogate of the effect of cardioprotective therapies8—has been estimated from quantifications of the extent of delayed gadolinium enhanced myocardium (infarct size [IS]) and the extent of myocardial edema (assumed to delineate the MaR) in the same imaging session. Consequently, multiple clinical and experimental studies have used CMR-measured edema and IS as end points, within a single imaging session performed at a variety of post-MI time points.9 Recent evidence has challenged the view of a stable post-MI edema reaction, demonstrating dynamic changes in edema in a pig model of MI.10,11 In this model, an initial hyperacute edema reaction on reperfusion resolves within 24 hours and is followed by a deferred healing-related edema wave occurring a few days after reperfusion. Notably, intramyocardial hemorrhage (IMH) and microvascular obstruction (MVO) can counteract the high-intensity edema signal on T2 sequences by reducing tissue T2 relaxation time. The impact of IMH and MVO on the bimodal edematous reaction is, thus, a matter of intense debate.12–15 Moreover, the extent/degree of edema might be lower in patients undergoing infarct-limiting cardioprotective interventions.16,17 Another variable that might differently affect post-MI tissue composition is ischemia duration.18 However, CMR exams were performed at different time points in these studies, precluding a definitive interpretation.
In summary, temporal dynamics and extent of post-I/R key phenomena (edema, necrosis, MVO, and IMH) might be affected by duration of the index ischemic event, by the application of cardioprotective interventions and the interplay between them, but to date, this has not been studied in a comprehensive manner. To elucidate these, we designed an experimental study in which pigs underwent different myocardial I/R protocols. CMR was performed at baseline and at 120 minutes, 24 hours, 4 days, and 7 days after I/R for the serial noninvasive assessment of myocardial edema, extent of IMH and MVO, IS, and myocardial salvage. Histology and quantification of myocardial water content by reference standard were performed at sacrifice immediately after the final CMR scan.
Methods
Study Design and MI Procedure
The study population comprised 25 Large White male pigs weighing 30 to 40 kg. The study was approved by the Institutional and Regional Animal Research Committees, and the study design is summarized in Online Figure I. Five pigs were euthanized with no intervention other than baseline CMR and served as reference healthy subjects. A group of 5 pigs underwent reperfused transmural acute MI by closed-chest I/R, consisting of 40-minute left anterior descending coronary artery occlusion followed by balloon deflation and reestablishment of blood flow,10 and were euthanized at 7 days after I/R serving as controls. Three additional groups of 5 animals each underwent modified I/R protocols incorporating different protective strategies followed by sacrifice on day 7: preconditioning, 40-minute I/R preceded by three 5-minute cycles of balloon inflation/deflation in the left anterior descending; postconditioning, 40-minute I/R followed by four 1-minute cycles of balloon inflation/deflation in the left anterior descending; and short-duration ischemia, 20-minute I/R.
Arterial enhanced multidetector computed tomography (MDCT) was performed during the index coronary occlusion, between minute 10 and minute 20 of ischemia, to delineate the reference MaR (MDCT-MaR, hypoperfused region during coronary occlusion).19 Comprehensive CMR exams were performed at baseline and at 120 minutes, 24 hours, day 4, and day 7 after I/R. Animals were immediately euthanized after the final follow-up CMR scan, and myocardial tissue samples from ischemic areas were rapidly collected for histology and evaluation of water content.
Full methods are provided in the Online Data Supplement.
Arterial Enhanced MDCT Protocol and Analysis
Arterial phase MDCT studies were performed on a 64-slice computed tomographic-scanner (Brilliance CT 64; Philips Healthcare, Cleveland, OH) after intravenous administration of iodinated contrast media.19 MDCT images were analyzed using dedicated software (MR Extended Work Space 2.6; Philips Healthcare, Best, The Netherlands) by 2 observers blinded to group allocation. Short axes orientation were obtained from volumetric computed tomographic images by multiplanar reconstruction using equivalent anatomic coordinates used for T2-weighted short-tau triple inversion-recovery (T2W-STIR) planning acquisition. MaR and remote areas were visually identified based on contrast enhancement differences, manually delineated, and expressed as a percentage of left ventricle (LV) area.
Detailed information about imaging MDCT protocol and analysis is shown in the Online Data Supplement.
CMR Protocol and Analysis
Baseline CMR scans were performed immediately before MI, and scans were subsequently repeated at all postinfarction follow-up times until sacrifice. CMR examinations were conducted with a Philips 3-Tesla Achieva Tx whole body scanner (Philips Healthcare, Best, The Netherlands) equipped with a 32-element phased-array cardiac coil. The imaging protocol included a standard segmented cine steady-state free-precession sequence to provide high quality anatomic references and assessment of LV mass, wall thickness, and LV ejection fraction (LVEF); a T2W-STIR sequence to assess the extent of edema and IMH; a T2-gradient-spin-echo mapping sequence to provide precise myocardial T2 relaxation time properties;20 and a T1-weighted inversion recovery turbo field echo sequence acquired 10 to 15 minutes after the administration of gadolinium contrast (late gadolinium enhancement [LGE]) to assess IS and MVO. To avoid any interference with T2 measures at immediate reperfusion, gadolinium contrast was not administered at baseline CMR scans. CMR images were analyzed using dedicated software (MR Extended Work Space 2.6; QMassMR 7.6; Medis, Leiden, The Netherlands) by 2 observers experienced in CMR analysis and blinded to group allocation. Detailed information about imaging protocol and parameters and CMR analysis can be found in the Online Data Supplement.
Myocardial Water Quantification and Histological Analysis
Paired myocardial samples were collected within minutes of sacrifice from the ischemic myocardium of all pigs. Myocardial water content was quantified by the desiccation technique and expressed as a percentage of wet weight.10,11 Histological sections of the at-risk myocardium were stained with hematoxylin and eosin, Masson trichrome, and antineutrophil antibody.11 Full methods are presented in the Online Data Supplement.
Statistical Analysis
Normal distribution of each data subset was checked using graphical methods and a Shapiro–Wilk test. Leven test was performed to check homogeneity of variances. For quantitative variables, data are expressed as mean±SD. A 1-way ANOVA was conducted for among-group comparison of myocardial water content and MDCT-MaR. To take account of repeated measures, generalized mixed models were applied for the study and comparison of the temporal evolution of T2, CMR-MaR, IS, IMH, MVO, and salvage myocardium within and between groups. Pairwise comparisons among groups and time points were performed and P value adjusted for multiple comparisons using the Hochberg method. Post hoc test of trends over time for imaging parameters by group was performed by using coefficients of orthogonal polynomials. A Kruskal–Wallis test was conducted to compare the number of inflammatory cells and collagen content among groups euthanized at day 7. Associations between measured T2 relaxation time and IMH, MVO, IS, and LVEF were evaluated by Pearson correlation coefficient. All statistical analyses were performed with Stata v12.0 (StataCorp, College Station, TX). Graphs were generated with Stata 12.0 or GraphPad-Prism v6.0 (GraphPad Software, Inc, La Jolla, CA).
Results
Impact of Cardioprotective Strategies and Ischemia Duration on T2 and Myocardial Water Content
T2 relaxation time determined at time points ≤7 days post-reperfusion are summarized in Table 1. As already reported, after 40-minute I/R, T2 relaxation times were significantly prolonged at reperfusion, almost completely normalized at 24 hours, then increasing again to reach a peak on day 7.10 Preconditioning before 40-minute I/R resulted in a significantly shorter T2 relaxation time at reperfusion and an earlier and shorter deferred peak, occurring on day 4 rather than day 7. Conversely, postconditioning had no effect on edema dynamics, with animals showing the standard bimodal pattern with an initial peak at reperfusion and a deferred T2 prolongation peaking on day 7 (Figure 1A and 1B). Pigs subjected to short-duration ischemia (20-minute I/R) showed a unimodal pattern of edema, with T2 prolongation at reperfusion, albeit blunted compared with 40-minute I/R, and no deferred peak. True myocardial water content values in the ischemic myocardium were comparable with those estimated from T2 relaxation times on day 7 CMR (Figure 1C).
Table 1.
Time Profile of Myocardial T2 Relaxation in the Ischemic Porcine Myocardium During the First Week After Different I/R Protocols and Cardioprotective Strategies
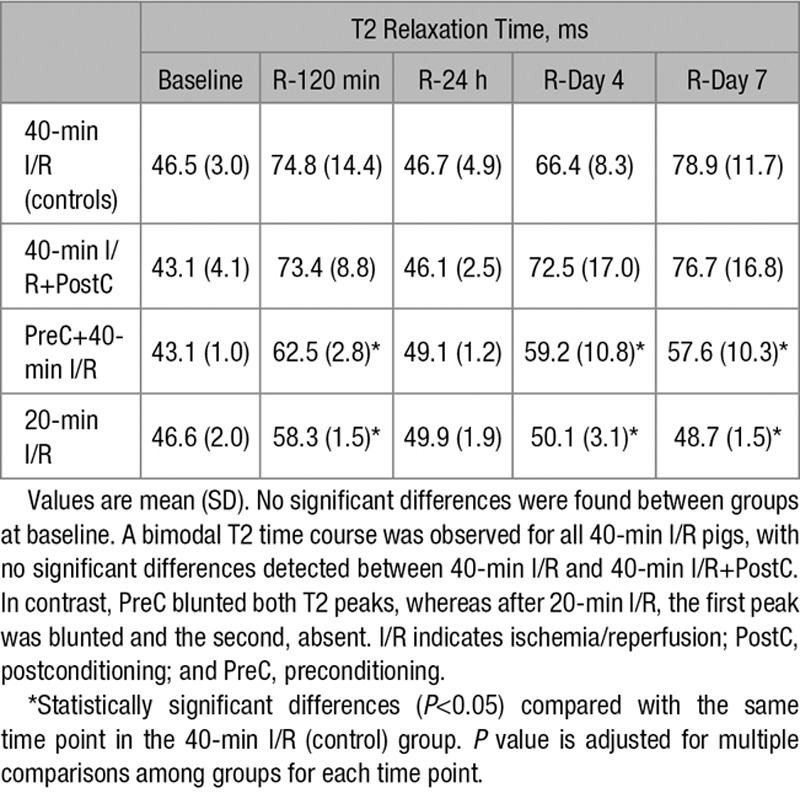
Figure 1.
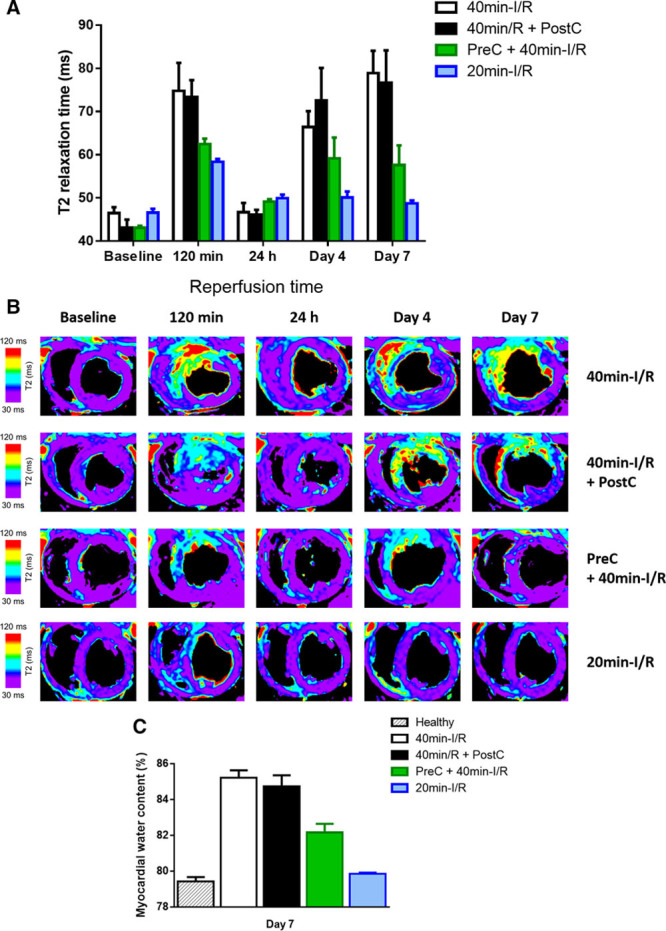
Time profile of T2 relaxation time and measurements of myocardial water content in the ischemic myocardium after different ischemia/reperfusion (I/R) protocols. A, Time profile of absolute T2 relaxation time (ms) in the ischemic myocardium of pigs undergoing different I/R protocols. Data are shown as mean±standard error of the mean. B, Representative serial cardiac magnetic resonance T2-mapping images from pigs that underwent 40-min I/R (control), 40-min I/R followed by postconditioning (PostC), 40-min I/R preceeded by preconditioning (PreC), or 20-min I/R; examinations were made at baseline, 120 min, 24 h, 4 d, and 7 d after reperfusion. All T2 maps were scaled between 30 and 120 ms. C, Measurements of myocardial water content (%) in healthy pigs and in the ischemic myocardium of pigs subjected to different I/R protocols and euthanized at day 7 after I/R. Myocardial water content (mean±SD, %) in the healthy pig myocardium was 79.4±0.6%. Myocardial water content (mean±SD, %) in the ischemic myocardium of pigs undergoing 40-min I/R (controls), 40-min I/R+PostC, 40-min I/R preceded by PreC, and 20-min I/R (short-duration ischemia) at day 7 after I/R was 85.2±0.9%, 84.7±1.4%, 82.2±1.1%, and 79.8±0.2%, respectively. Between-group differences of water content in the ischemic myocardium remained statistically significant with the exception of 40-min I/R+PostC vs 40-min I/R and 20-min I/R vs healthy. Data represented are means±standard error of the mean.
Impact of Cardioprotective Strategies and Ischemia Duration on CMR-Measured MaR
Mean MaR measured by MDCT in the different groups was as follows (% of LV): 40-minute I/R (controls), 28.3±4.3%; preconditioning plus 40-minute I/R, 31.7±6.9%; 40-minute I/R plus postconditioning, 31.3±4.0%; and short-duration ischemia (20-minute I/R), 24.6±6.7% (statistically nonsignificant differences as compared with controls). Measurements of MaR determined by T2W-CMR in these groups at different times after reperfusion are summarized in Table 2.
Table 2.
Time Profile of MaR, IS and Myocardial Salvage as Assessed by CMR During the First Week After Reperfused Myocardial Infarction in Pigs Subjected to Different I/R Protocols and Cardioprotective Strategies
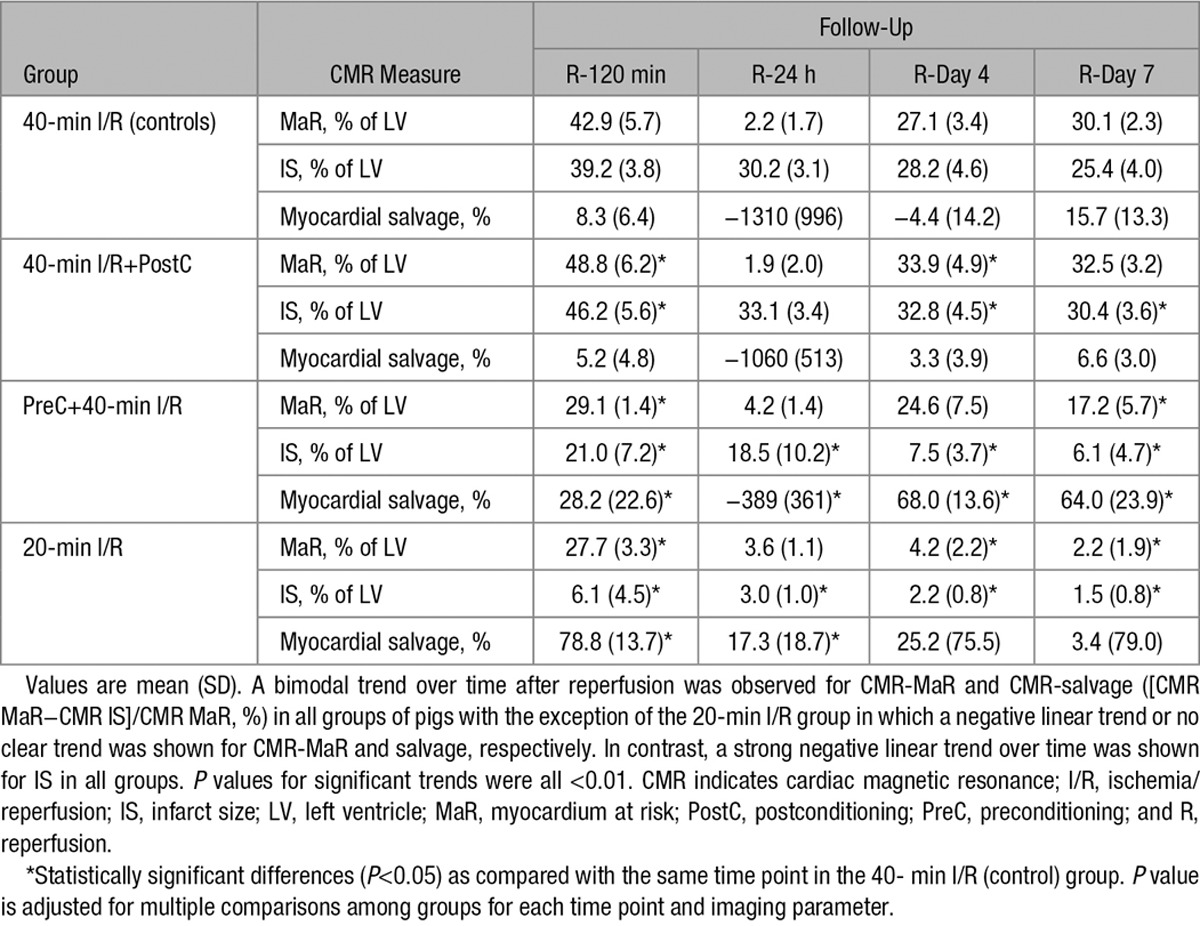
CMR-measured MaR and T2 relaxation time showed similar time course patterns. Pigs subjected to 40-minute I/R with or without postconditioning had significant swelling of the formerly ischemic myocardium at reperfusion (Online Table I; Online Movies I through IV). Consequently, at early reperfusion, CMR-measured MaR as delineated by T2W-STIR was significantly higher than MaR measured by the reference standard MDCT in these pigs (Figure 2A and 2B). Conversely, preconditioned and 20-minute I/R pigs developed edema at reperfusion but without myocardial swelling (Online Table I; Online Movies V through VIII), and, therefore, MaR measured by CMR was similar to the value recorded by MDCT at this time point in these groups. In all study groups, the initial edema wave dissipated by 24 hours postreperfusion, and CMR measurements systematically underestimated MaR at this time point. On days 4 and 7 postreperfusion, CMR-measured MaR in control and postconditioned pigs was similar to MaR measured by MDCT. Conversely, in preconditioned pigs, CMR- and MDCT-measured MaR values were similar on day 4, but on day 7, CMR underestimated MaR because of partial resolution of the deferred edema wave, which appeared earlier, peaking on day 4. In pigs undergoing short-duration ischemia (20-minute I/R), CMR underestimated MaR at all time points after the first reperfusion scan because of the absence of the deferred edema wave.
Figure 2.
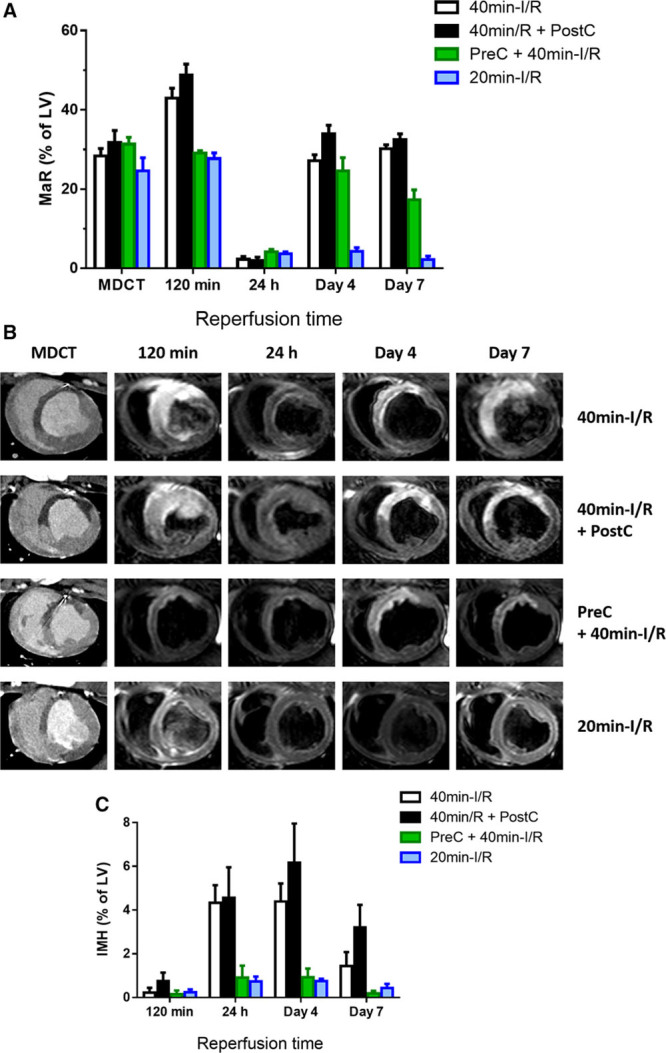
Time profile of cardiac magnetic resonance (CMR)-myocardium at risk (MaR) and intramyocardial hemorrhage (IMH) after different ischemia/reperfusion (I/R) protocols. A, Time profile of CMR-MaR measured by T2-weighted short-tau triple inversion-recovery (T2W-STIR) in pigs undergoing different I/R protocols. Arterial enhanced multidetector computed tomography (MDCT) was performed during coronary occlusion in all pigs as a reference measure of MaR. Data are shown as mean±standard error of the mean. B, Representative images from pigs that underwent 40-min I/R (control), 40-min I/R followed by postconditioning (PostC), 40-min I/R preceeded by preconditioning (PreC), or 20-min I/R; serial CMR T2W-STIR examinations were made at 120 min, 24 h, 4 d, and 7 d after reperfusion. Images are from the same pigs as those shown in the Figure. C, Temporal evolution of IMH in pigs subjected to different I/R protocols and followed ≤7 d after reperfusion. Data are means±standard error of the mean. LV indicates left ventricle.
Impact of Cardioprotective Strategies and Ischemia Duration on IS, Myocardial Salvage, IMH, and MVO
CMR measurements of IS and myocardial salvage after reperfusion are summarized in Table 2. IS was maximal at reperfusion and progressively shrank during the first week after MI in all groups. Whereas postconditioning had no effect on IS, preconditioning significantly reduced IS at all time points (Figure 3A and 3B). In pigs undergoing short-duration ischemia, IS was negligible at all time points. In parallel with the temporal variations in CMR-measured MaR, myocardial salvage estimated by CMR dynamically changed over time and according to the I/R protocol applied (Table 2). The time profile of myocardium salvage as assessed by reference MDCT-measured MaR and CMR IS is presented in Online Table II.
Figure 3.
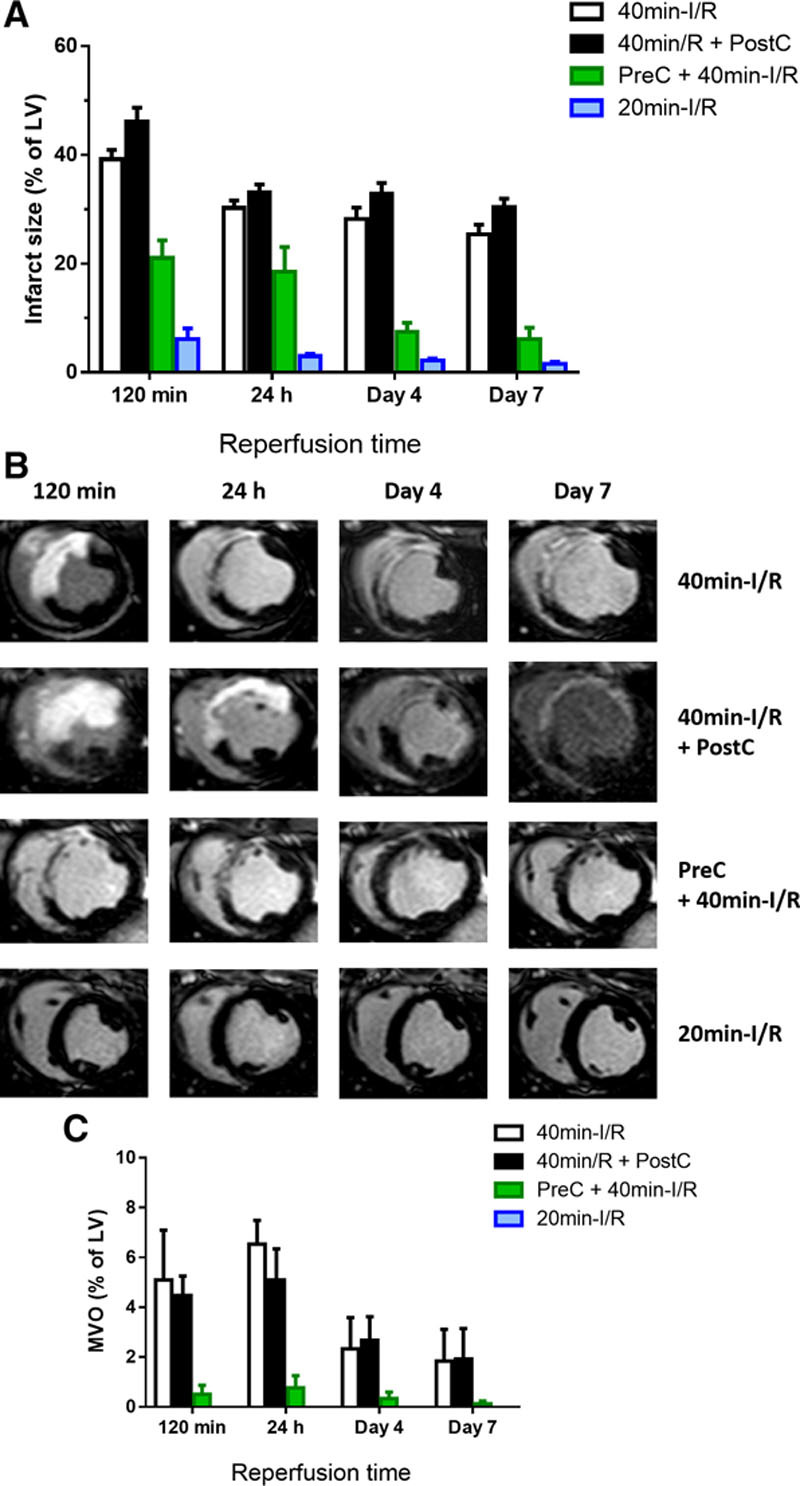
Time profile of cardiac magnetic resonance (CMR)-measured infarct size and microvascular obstruction (MVO) after different ischemia/reperfusion (I/R) protocols. A, Time profile of infarct size measured by T1-weighted inversion recovery turbo field echo (T1-IR-TFE) after administration of gadolinium to pigs undergoing different I/R protocols. Data are shown as mean±standard error of the mean. B, Representative images from pigs that underwent 40-min I/R (control), 40-min I/R followed by postconditioning (PostC), 40-min I/R preceded by preconditioning (PreC), or 20-min I/R; serial CMR T1-IR-TFE examinations were made at 120 min, 24 h, 4 d, and 7 d after reperfusion. Images are from same pigs as those shown in Figures 2 and 3. C, Temporal evolution of MVO in pigs subjected to different I/R protocols and followed ≤7 d after reperfusion. Data are means±standard error of the mean. Note that pigs subjected to 20-min I/R did not show MVO at any evaluated time point. LV indicates left ventricle.
CMR measurements of IMH and MVO after reperfusion are summarized in Online Table III. IMH was apparent at 24 hours, peaking on day 4 post-I/R (Figure 2C), whereas MVO was apparent early after reperfusion, peaking on day 1 post-I/R and progressively decreasing thereafter (Figure 3C). Presence and extent of IMH and MVO were unaffected by postconditioning, significantly reduced by preconditioning, and negligible after short-duration ischemia.
Impact of Cardioprotective Strategies and Ischemia Duration on Histological Features of MI
The histological analysis of pigs euthanized at day 7 postreperfusion are summarized in Online Table IV. Postconditioning had no discernable effect on lesion size, granulation tissue content, neutrophil infiltration, or collagen content (Figure 4). Preconditioning resulted in smaller lesion areas, a higher proportion of granulation tissue, and lower neutrophil infiltration and collagen content. Pigs undergoing short-duration ischemia showed no signs of tissue lesion and a low degree of neutrophil infiltration.
Figure 4.
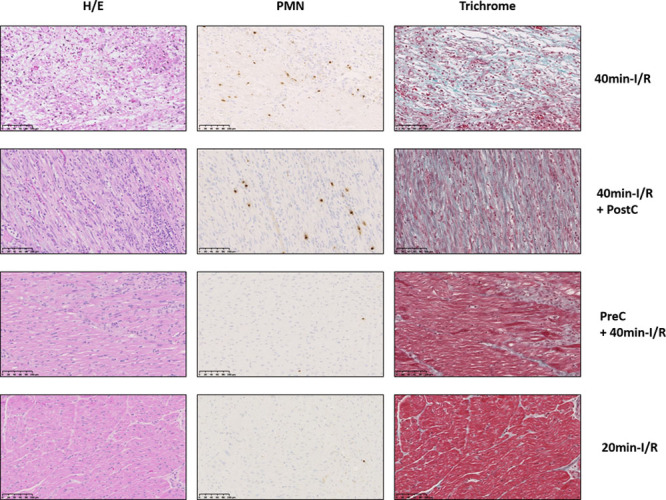
Impact of cardioprotection and ischemia duration on histological features of myocardial infarction. Representative histological images of porcine ischemic myocardium 7 d after 40-min ischemia/reperfusion (I/R; control), 40-min I/R followed by postconditioning (PostC), 40-min I/R preceded by preconditioning (PreC), and 20-min I/R. Images show staining with hematoxylin and eosin (H/E), antiPM1 antibody (PMN), and Masson trichrome. Stained sections were used to quantify lesion extent, proportion of necrosis and granulation tissue, neutrophil density, and percentage of collagen within granulation tissue. Note the scarce neutrophil infiltration in porcine myocardium subjected to PreC or 20-min I/R, accompanied by small patchy areas of granulation tissue (PreC) or its absence (20-min I/R). Scale bars, 100μΜ.
Association Between T2 and IMH, MVO, IS, and LVEF
Overall, T2 relaxation time in the ischemic region at 120 minutes post-I/R correlated positively with the degree of IMH and MVO: the longer the T2 at early reperfusion, the larger the extent of IMH and MVO. Conversely, the deferred T2 peak (highest value between day 4 and day 7) correlated positively with IS and inversely with LVEF: the greater the deferred T2 peak, the larger the infarct and the lower the LVEF on day 7 (Figure 5).
Figure 5.
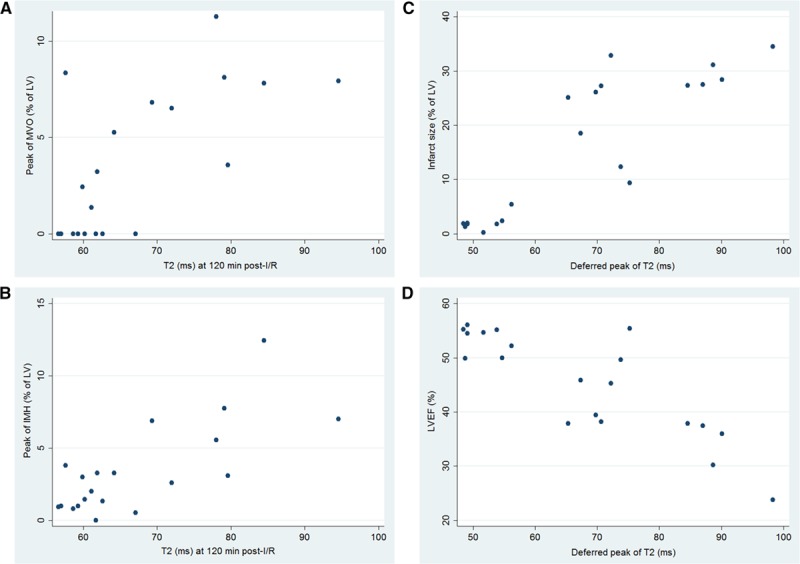
Association between T2, intramyocardial hemorrhage (IMH), microvascular obstruction (MVO), infarct size, and left ventricular ejection fraction (LVEF). Scatter plots showing positive association of T2 relaxation time in the ischemic myocardium during the hyperacute postreperfusion period (120 min) with (A) peak MVO (Pearson r=0.68) and (B) peak intramyocardial hemorrhage (Pearson r=0.75). C and D, The deferred T2 peak in the ischemic myocardium shows a strong positive association with day-7 infarct size (Pearson r=0.87) and a negative association with day-7 LVEF (Pearson r=−0.85). After adjustment for multiple testing, all P values for the correlations shown remained significant (P<0.05). Graphs include 4 groups of 5 pigs each undergoing 40-min ischemia/reperfusion (I/R; controls), 40-min I/R followed by postconditioning, 40-min I/R preceded by preconditioning, or 20-min I/R. LV indicates left ventricle.
Discussion
In this study, we have comprehensively characterized the impact of cardioprotective strategies (preconditioning and postconditioning) and ischemia duration on the temporal evolution and extent of myocardial tissue composition changes (edema, necrosis, IMH, and MVO) by CMR. In all instances of necrosis (positive LGE at day 7), a bimodal edematous response is seen, regardless of the presence and degree of IMH or MVO; however, when necrosis is absent (in animals undergoing short-duration ischemia with no day-7 LGE), the edematous reaction is unimodal, with a blunted reperfusion-related edema wave and no healing-related deferred wave. Preconditioning, which significantly reduces IS, modulates the intensity of both the initial and deferred edema waves. The deferred wave also peaks earlier in preconditioned than in nonpreconditioned infarctions. CMR-measured IS declined progressively after reperfusion in all groups, whereas the extent of IMH and MVO varied according to CMR timing and protocol applied. T2 relaxation time in the ischemic area early after reperfusion is correlated with the severity of IMH and MVO, whereas the deferred peak of T2 relaxation time is strongly associated with IS and LVEF.
Consequently, imaging protocols for post-MI tissue characterization aiming at quantifying edema, MaR, IS, myocardial salvage, IMH, and MVO should account for these dynamics and be as standardized as possible (Figure 6).
Figure 6.
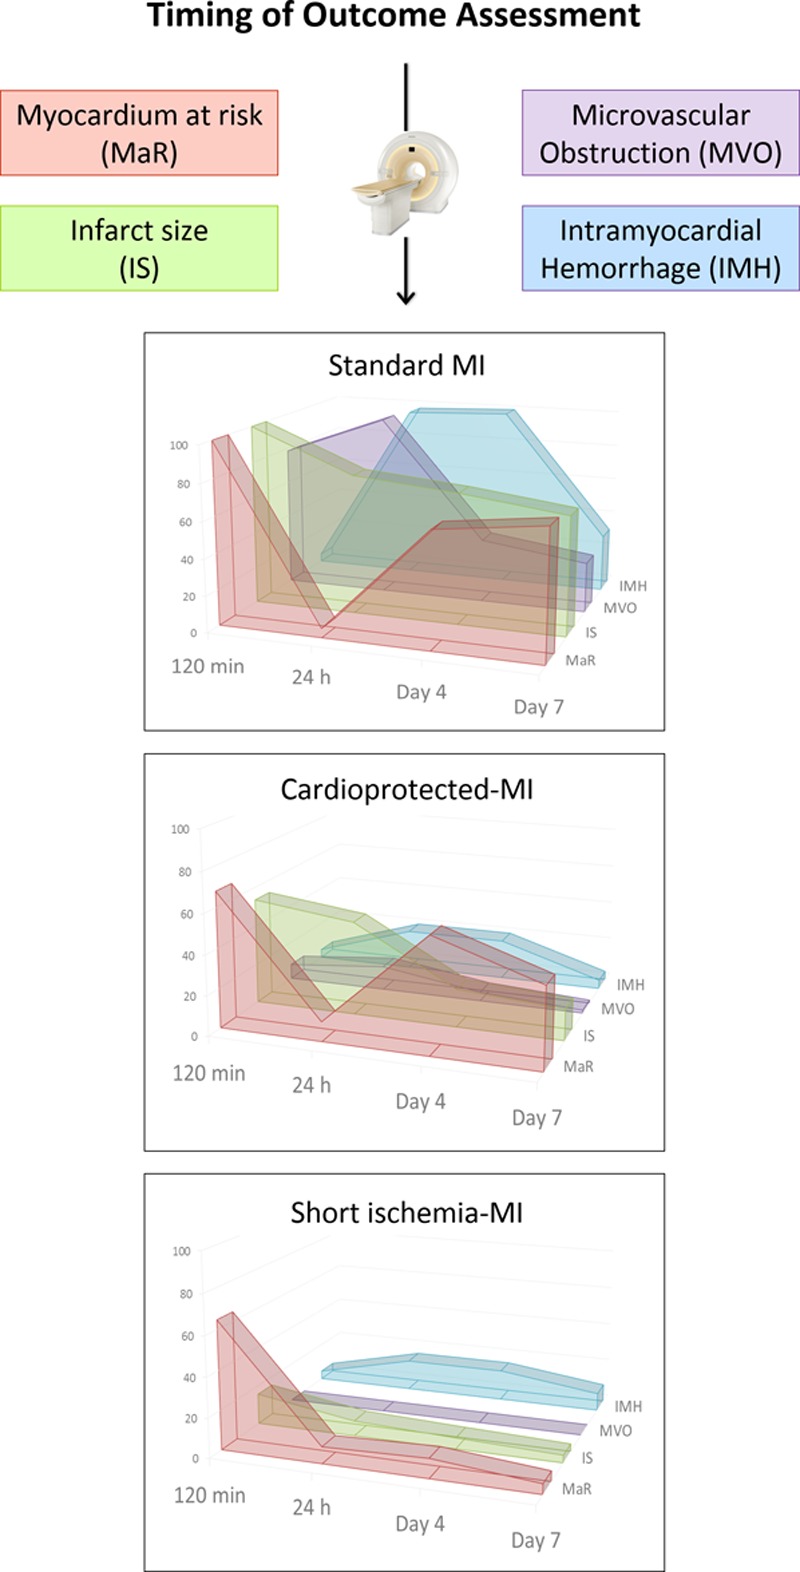
Effect of timing of evaluation, ischemia duration, and protective interventions on cardiac magnetic resonance (CMR)-measured individual outcomes after myocardial infarction (MI). By using state-of-the-art CMR imaging, we have demonstrated that the temporal dynamics and extent of post-MI tissue composition changes are greatly influenced by the timing of imaging acquisition, application of cardioprotective interventions, and the duration of the index ischemia. These findings highlight the need for protocol standardization when using post-MI imaging techniques to measure edema, myocardial area at risk, infarct size (IS), myocardial salvage, intramyocardial hemorrhage (IMH), and microvascular obstruction (MVO) in experimental and clinical studies. According to the data presented, establishing the appropriate timing to measure IMH and MVO could occur somewhere around the first 24 to 48 h post-MI; whereas the optimal timing to measure edema, myocardium at risk (MaR), IS, and salvage could occur somewhere between day 4 and day 7 after MI. Nevertheless, caution should be exercised when addressing post-MI tissue characterization by any means given that several components and factors might additionally impact the dynamics and complex changes which undergo the heart after MI. y axis numbers and graphs represent real data relative to the highest point on the chart for the given imaging outcome (MaR, IS, MVO, and IMH). A value of 100 is the highest value for the corresponding measure in controls (ie, pigs subjected to 40-min I/R) among all time points evaluated (120 min, day 1, day 4, and day 7 after reperfusion). A value of 50 means that the extent of the corresponding measure is half as the former highest value.
Modulation of the Post-I/R Edema by Cardioprotecitve Strategies and Ischemia Duration
The possibility of protecting the myocardium during an acute MI (cardioprotection) has interested the scientific community for several decades.2,21 Many studies use IS normalized to MaR as an acute end point, on the assumption that post-I/R edema is steady. However, recent studies suggest that the extent of edema might be influenced by cardioprotective conditioning interventions.16,17 However, these previous clinical studies were not designed to address the effect of conditioning interventions on edema formation, and subjects underwent a single CMR examination that was not at the same time point for all individuals.16,17
Our results show that preconditioning (a potent cardioprotective strategy) and short ischemia duration have a major impact on the intensity and dynamics of post-MI edema (Figure 1). Preconditioning reduced the initial edema wave and also the deferred wave, which peaked early, on day 4, contrasting with the peak on day 7 in control animals. Shortening the duration of coronary occlusion to 20 minutes (20-minute I/R) also blunted initial edema wave, and in this case, the second edema wave was absent. These CMR results are consistent with histologically determined water content at day 7 after MI, which was reduced in pigs undergoing preconditioning and within the normal range in pigs undergoing short-duration ischemia (Figure 1C).
Impact of IMH and MVO on the Occurrence of the Bimodal Edematous Reaction
The extent of IMH and MVO varies as a function of time from the acute ischemic event.11,12 IMH is moreover closely associated with the development of MVO, conferring a worse prognosis when present.12 More importantly, in the present study, edema followed a bimodal T2 pattern in all pigs undergoing 40-minute I/R (with or without preconditioning or postconditioning) regardless of the degree of IMH or MVO (Figure 1), which was almost absent in preconditioned pigs (Figures 2C and 3C). Notably, all pigs, including those undergoing short-duration ischemia, showed a significant drop in T2 from the hyperacute phase to 24 hours postreperfusion (Figure 1). These findings suggest that the main driver of the drop in T2 is rapid resorption of the initial reperfusion-related edema, regardless of the degree of IMH and MVO, and reinforce the reality of bimodal post-MI edema. Nevertheless, IMH exerts some influence on T2 relaxation time, as we previously conceded,10,11,14,20 and might explain the slightly less noticeable drop in T2 at 24 hours in pigs with almost no IMH or MVO (pigs given preconditioning or short-duration ischemia; Figure 1).
Impact of Cardioprotective Strategies and Ischemia Duration on CMR-Measured Myocardial Area at Risk and Salvage
Parametric T2 mapping improves the detection and quantification of myocardial edema;20 however, this methodology is not universally available, contrasting with T2W-STIR, which is available from all major vendors. In this regard, CMR-measured MaR as delineated by the extent of edema on T2W-STIR imaging paralleled T2 relaxation time profile. The present study shows that the edema-sensitive T2W-STIR CMR sequence overestimates MaR (as compared with the reference standard, MDCT in this study) at early time points (120 minutes) after reperfusion in pigs subjected to 40-minute I/R with no protective strategies or undergoing postconditioning (which did not protect in this study). This overestimation is mainly driven by the massive swelling of the reperfused myocardium (Online Movies I through IV). By 24 hours, there is a systematic underestimation of MaR by CMR in all cases, mainly driven by the substantial resorption of edema and normalization of T2 relaxation time.10 This underestimation resulted in biologically implausible negative myocardial salvage data at 24 hours in most pigs (Table 2). This finding reinforces the idea that MaR (and consequently salvaged myocardium) may not reliably be quantified by CMR around this time point. Conversely, on days 4 and 7, CMR-measured MaR was similar to MaR measured by MDCT (Figure 2A). However, the dynamics of postischemia edema are altered by cardioprotective strategies and ischemia duration, with further implications for CMR-measured MaR and salvage.
Thus, the smaller extent of edema at reperfusion in pigs that underwent preconditioning or short-duration ischemia (Figure 2) was associated with less prolonged T2 relaxation times (Figure 1) and lower degree of myocardial swelling. Interestingly, these 2 groups of cardioprotected animals had significantly smaller infarcts on day 7 (Figure 3). The cardioprotection (reduced IS) afforded by preconditioning or short-duration ischemia was demonstrated by CMR (LGE; Figure 3) and histology (Figure 4). In pigs undergoing short-duration ischemia, necrosis was barely detectable, and so was edema and CMR-measured MaR from day 1 on, supporting the notion that the deferred edema wave is related to post-MI healing.11 This would imply that interventions that protect the myocardium could affect edema dynamics, therefore, having an impact on CMR estimations of MaR and salvage, as suggested by indirect clinical evidence before.16,17 However, whether any intervention that reduces IS diminishes myocardial edema remains to be demonstrated. A paradigmatic example of such interplay may be seen in the group subjected to short duration of ischemia (Table 2). In this group, IS is small and stable on day 1 (3.0% of LV), day 4 (2.2% of LV), and day 7 (1.5% of LV); however, a dramatic change is seen in CMR-measured salvage index (17.3%, 25.2%, and 3.4% of MaR on days 1, 4, and 7, respectively). Of note, when using the MaR standard reference MDCT value to calculate salvage, salvage index remains stable (87.4%, 90.0%, and 94.4% of MaR on days 1, 4, and 7, respectively; Online Table II). The latter measurements (based on MDCT-MaR) are consistent with the significant cardioprotective effect seen by early reperfusion (ie, short ischemia duration).
Decrease of CMR-Based IS During the First Week After MI
Previous studies show rapid resorption of LGE myocardium (a surrogate of IS) between ≈day 1 and day 7 after MI.4,22 Consistent with these observations, our data show a progressive decrease of CMR-based IS in all study groups (Figure 3). The massive swelling of the early postreperfused myocardium might explain the large IS detected in our study 120 minutes after reperfusion. Interestingly, animals that underwent preconditioning showed LGE-positive myocardial regions early after reperfusion that became LGE negative by day 4 or day 7 CMR (Figure 3). This phenomenon might indicate early and transient expansion of extracellular volume without irreversible myocardial injury.22 These data highlight the importance of performing CMR infarct imaging within a consistently defined and narrow time frame, preferably at the end of the first week, when using IS as an end point in clinical trials during the acute post-MI period. Nevertheless, the fact that myocardial edema and LGE follow a disparate dynamic pattern after ischemia/reperfusion highlights the complexity of measuring myocardial salvage in real practice.
T2 as a Maker of Post-I/R Myocardial Injury
The ability to predict the fate of the myocardium early after MI would be of great clinical value. Myocardial edema contributes to impaired post-MI microvascular perfusion by increasing extravascular compression and might contribute to altered coronary physiology indices.1,2 In this study, we show that T2 relaxation time in ischemic myocardium in the hyperacute CMR examination (after 2 hours of reperfusion) correlates with IMH and MVO—events that develop days after MI (Figure 5A and 5B). Conversely, the deferred T2 peak correlated directly with IS and inversely with LVEF—parameters associated with post-MI healing (Figure 5C and 5D). Therefore, myocardial T2 relaxation time might be a quantitative surrogate of the ischemic insult or therapeutic effect, rather than a surrogate of MaR.
However, these findings might apply only to the reperfused MI because the bimodal edema response is less pronounced in nonreperfused MI.11 These findings warrant further experimental and clinical studies specifically addressing the prognostic significance of T2 at different time points and the perfusion status of the myocardium.
Limitations
Caution is needed when extrapolating experimental results to the clinic. However, the pig is one of the most clinically translatable large animal models for the study of reperfused MI.23,24 The nature of our experimental study, that is, longitudinal follow-up, precluded individual histological gold standard measurements of area at risk (ie, Evans Blue by coronary reocclusion), IS (ie, triphenyl tetrazolium chloride), or MVO (thioflavin-S) at each time point. In addition, the heart was harvested at sacrifice to perform reference standard myocardial water content measurements and histological quantification of different tissue components, which otherwise might be altered by such procedures. It is fair to acknowledge that although previous studies have used histological standards to validate the use of CMR to measure IS and MVO22,25 and MDCT to measure MaR,19,26 there is probably no perfect noninvasive method for such purposes. In this regard, acutely detected LGE does not necessarily equate to irreversible injury and may contribute to severely distort estimates of salvaged myocardium when comparing against a prereperfusion reference standard to assess MaR.22 Other reasons that might contribute to inaccurate estimations include damage extent beyond the boundaries of the actual MaR (defined as the hypoperfused region during coronary occlusion);19 slightly shrinking of MaR in MDCT performed during coronary occlusion because of lack of perfusion in animal models with poor collateral circulation; and the presence of residual edema in salvaged myocardium which might contribute to overestimate of IS early after reperfusion.22 Hybrid imaging techniques have been proposed to overcome some of these issues;27 however, further validation is needed.
Our study examined only anterior MI. The reasons for this choice include the avoidance of possible magnetic-field nonhomogeneity related to the inferolateral wall6,28 and adherence to recommendations for patient selection in clinical trials of cardioprotective interventions.21 The observed changes in tissue composition are likely to occur regardless of MI location; however, caution should be exercised when extrapolating other results, especially those regarding the association of T2 with ventricular outcome.
Our results do not necessarily invalidate the reported protective effects of the majority of preclinical postconditioning studies published.29 However, our findings are in line with some recent experimental and clinical data.29,30 In this regard, ischemic postconditioning did not reduce the incidence of clinical events in ST-segment–elevation MI (STEMI) patients in the DANAMI-3-iPOST trial (The Third Danish Study of Optimal Acute Treatment of Patients With ST Elevation Myocardial Infarction–Ischemic Postconditioning).31 Moreover, this intervention did not reduce IS, myocardial salvage index, extent of MVO, or improve LVEF in the subset of patients who underwent CMR.31 Interspecies differences, small sample size, the lack of comorbidities and comedications in animal experiments, and the diversity of postconditioning protocols applied might explain the ambivalent preclinical and clinical data.29 Nevertheless, our goal was not to test the cardioprotective effect of postconditioning, but rather to use different protective strategies to characterize post-MI tissue over a range of injury severities. Indeed, the use of strategies that did not achieve cardioprotection reinforced our earlier results obtained by the standard I/R procedure.10,11
The regions of interest used to quantify T2 relaxation time in this study included the full wall thickness. The regions of interest might, therefore, include different myocardial states (such as hemorrhage or MVO). We took this approach to match our previous experimental work and because the differentiation of such small areas might be challenging. This might have contributed to the differences in absolute T2 relaxation time between our study and others taking a different approach to region of interest selection.
Conclusions
In a translational large animal model of myocardial I/R and by using CMR, we have shown that the temporal dynamics and extent of post-MI tissue composition changes are greatly influenced by application of cardioprotective interventions and the duration of the index ischemia. Post-MI LGE areas do not necessarily equate to necrotic myocardium because the extent of hyperenhanced ischemic tissue evolves rapidly during the first week after reperfusion. The magnitude of IMH and MVO varies according to ischemia duration and cardioprotection. The greatest divergences are seen in the degree and spatial extent of myocardial edema during the first week after MI, which seem to be a quantitative surrogate marker of ischemic damage or therapeutic effect.
These data highlight the need for protocol standardization when using post-MI imaging techniques to measure edema, MaR, IS, myocardial salvage, IMH, and MVO in experimental and clinical studies.
Acknowledgments
We thank Tamara Córdoba, Oscar Sanz, Eugenio Fernández, and other members of the Centro Nacional de Investigaciones Cardiovasculares Carlos III (CNIC) animal facility and farm for outstanding animal care and support and Roisin Doohan and Brenda Guijarro for assistance with histological sample processing. Simon Bartlett (CNIC) provided English editing. Pictures from multidetector computed tomography and cardiac magnetic resonance equipment (Online Figure I; Figure 6) are reproduced with the permission of Philips Healthcare.
Sources of Funding
This study was supported by a competitive grant from the Carlos III Institute of Health-Fondo de Investigacion Sanitaria and the European Regional Development Fund (ERDF/FEDER; PI10/02268 and PI13/01979), the Spanish Ministry of Economy, Industry, and Competitiveness (MEIC) and ERDF/FEDER (SAF2013-49663-EXP), and, in part, by the FP7-PEOPLE-2013-ITN Next generation training in cardiovascular research and innovation-Cardionext. R. Fernández-Jiménez holds a FICNIC fellowship from the Fundació Jesús Serra, the Fundación Interhospitalaria de Investigación Cardiovascular, and the Centro Nacional de Investigaciones Cardiovasculares Carlos III (CNIC). J. Agüero is a FP7-PEOPLE-2013-ITN-Cardionext fellow. This research program is part of an institutional agreement between FIIIS-Fundación Jiménez Díaz and CNIC. This study forms part of a Master Research Agreement between the CNIC and Philips Healthcare. This study is part of a bilateral research program between Hospital de Salamanca Cardiology Department and the CNIC. The CNIC is supported by the MEIC and the Pro CNIC Foundation and is a Severo Ochoa Center of Excellence (MEIC award SEV-2015-0505).
Disclosures
J. Sánchez-González is a Philips Healthcare employee. The other authors report no conflicts.
Supplementary Material
Nonstandard Abbreviations and Acronyms
- CMR
- cardiac magnetic resonance
- IMH
- intramyocardial hemorrhage
- I/R
- ischemia/reperfusion
- IR-TFE
- inversion recovery turbo field echo
- IS
- infarct size
- LAD
- left anterior descending
- LGE
- late gadolinium enhancement
- LV
- left ventricle
- LVEF
- left ventricular ejection fraction
- MaR
- myocardium at risk
- MDCT
- multidetector computed tomography
- MI
- myocardial infarction
- MVO
- microvascular obstruction
- ROI
- region of interest
- STIR
- short-tau triple inversion-recovery
- T2W
- T2-weighted
In May 2017, the average time from submission to first decision for all original research papers submitted to Circulation Research was 12.28 days.
The online-only Data Supplement is available with this article at http://circres.ahajournals.org/lookup/suppl/doi:10.1161/CIRCRESAHA.117.310901/-/DC1.
Novelty and Significance
What Is Known?
Edema formation, inflammation, and microvascular injury contribute to irreversible loss of cardiac myocytes after myocardial I/R.
The presence and extent of these processes and tissue healing are associated with outcome after MI.
Evaluation of myocardial tissue composition changes by CMR imaging (ie, tissue characterization) serves as surrogate end points in experimental and clinical studies and clinical trials.
What New Information Does This Article Contribute?
By using serial CMR exams in a translational large animal model of I/R, this study shows that the temporal dynamics and extent of post-MI tissue composition changes are greatly influenced by the application of cardioprotective interventions, the duration of the index ischemia, and the interplay between them.
Rather than estimates of the ischemic area alone, the degree and spatial extent of myocardial edema seems to be a surrogate marker of ischemic insult severity.
These findings highlight the need for protocol standardization when using post-MI imaging techniques to measure relevant end points in experimental and clinical studies.
Post-MI tissue composition is highly dynamic and could be characterized by CMR, which has been used to assess surrogate outcomes and efficacy end points in many experimental and clinical studies. However, there is paucity of studies tracking the temporal dynamics of these processes in a comprehensive manner. Our current work shows that the degree and extent of post-MI tissue composition changes (edema, necrosis, hemorrhage, and MVO) as assessed by CMR are greatly influenced by the time of image acquisition, duration of ischemia, cardioprotective strategies, and the interplay between them. Therefore, clinical and experimental imaging protocols for post-MI tissue characterization aiming at quantifying edema, myocardial area at risk, IS, myocardial salvage, IMH, and MVO should take into consideration these dynamics and be as standardized as possible.
References
- 1.Heusch G. The coronary circulation as a target of cardioprotection. Circ Res. 2016;118:1643–1658. doi: 10.1161/CIRCRESAHA.116.308640. doi: 10.1161/CIRCRESAHA.116.308640. [DOI] [PubMed] [Google Scholar]
- 2.Ibanez B, Heusch G, Ovize M, Van de Werf F. Evolving therapies for myocardial ischemia/reperfusion injury. J Am Coll Cardiol. 2015;65:1454–1471. doi: 10.1016/j.jacc.2015.02.032. doi: 10.1016/j.jacc.2015.02.032. [DOI] [PubMed] [Google Scholar]
- 3.Carlsson M, Ubachs JF, Hedstrom E, Heiberg E, Jovinge S, Arheden H. Myocardium at risk after acute infarction in humans on cardiac magnetic resonance: quantitative assessment during follow-up and validation with single-photon emission computed tomography. JACC Cardiovasc Imaging. 2009;2:569–576. doi: 10.1016/j.jcmg.2008.11.018. doi: 10.1016/j.jcmg.2008.11.018. [DOI] [PubMed] [Google Scholar]
- 4.Dall’Armellina E, Karia N, Lindsay AC, Karamitsos TD, Ferreira V, Robson MD, Kellman P, Francis JM, Forfar C, Prendergast BD, Banning AP, Channon KM, Kharbanda RK, Neubauer S, Choudhury RP. Dynamic changes of edema and late gadolinium enhancement after acute myocardial infarction and their relationship to functional recovery and salvage index. Circ Cardiovasc Imaging. 2011;4:228–236. doi: 10.1161/CIRCIMAGING.111.963421. doi: 10.1161/CIRCIMAGING.111.963421. [DOI] [PMC free article] [PubMed] [Google Scholar]
- 5.Aletras AH, Tilak GS, Natanzon A, Hsu LY, Gonzalez FM, Hoyt RF, Jr, Arai AE. Retrospective determination of the area at risk for reperfused acute myocardial infarction with T2-weighted cardiac magnetic resonance imaging: histopathological and displacement encoding with stimulated echoes (DENSE) functional validations. Circulation. 2006;113:1865–1870. doi: 10.1161/CIRCULATIONAHA.105.576025. doi: 10.1161/CIRCULATIONAHA.105.576025. [DOI] [PubMed] [Google Scholar]
- 6.Friedrich MG, Kim HW, Kim RJ. T2-weighted imaging to assess post-infarct myocardium at risk. JACC Cardiovasc Imaging. 2011;4:1014–1021. doi: 10.1016/j.jcmg.2011.07.005. doi: 10.1016/j.jcmg.2011.07.005. [DOI] [PMC free article] [PubMed] [Google Scholar]
- 7.Friedrich MG, Abdel-Aty H, Taylor A, Schulz-Menger J, Messroghli D, Dietz R. The salvaged area at risk in reperfused acute myocardial infarction as visualized by cardiovascular magnetic resonance. J Am Coll Cardiol. 2008;51:1581–1587. doi: 10.1016/j.jacc.2008.01.019. doi: 10.1016/j.jacc.2008.01.019. [DOI] [PubMed] [Google Scholar]
- 8.Engblom H, Heiberg E, Erlinge D, Jensen SE, Nordrehaug JE, Dubois-Rande JL, Halvorsen S, Hoffmann P, Koul S, Carlsson M, Atar D, Arheden H. Sample size in clinical cardioprotection trials using myocardial salvage index, infarct size, or biochemical markers as endpoint. J Am Heart Assoc. 2016;5:e002708. doi: 10.1161/JAHA.115.002708. doi: 10.1161/JAHA.115.002708. [DOI] [PMC free article] [PubMed] [Google Scholar]
- 9.Kim HW, Van Assche L, Jennings RB, et al. Relationship of T2-weighted MRI myocardial hyperintensity and the ischemic area-at-risk. Circ Res. 2015;117:254–265. doi: 10.1161/CIRCRESAHA.117.305771. doi: 10.1161/CIRCRESAHA.117.305771. [DOI] [PMC free article] [PubMed] [Google Scholar]
- 10.Fernández-Jiménez R, Sánchez-González J, Agüero J, et al. Myocardial edema after ischemia/reperfusion is not stable and follows a bimodal pattern: imaging and histological tissue characterization. J Am Coll Cardiol. 2015;65:315–323. doi: 10.1016/j.jacc.2014.11.004. doi: 10.1016/j.jacc.2014.11.004. [DOI] [PubMed] [Google Scholar]
- 11.Fernández-Jiménez R, García-Prieto J, Sánchez-González J, Agüero J, López-Martín GJ, Galán-Arriola C, Molina-Iracheta A, Doohan R, Fuster V, Ibáñez B. Pathophysiology underlying the bimodal edema phenomenon after myocardial ischemia/reperfusion. J Am Coll Cardiol. 2015;66:816–828. doi: 10.1016/j.jacc.2015.06.023. doi: 10.1016/j.jacc.2015.06.023. [DOI] [PubMed] [Google Scholar]
- 12.Carrick D, Haig C, Ahmed N, Rauhalammi S, Clerfond G, Carberry J, Mordi I, McEntegart M, Petrie MC, Eteiba H, Hood S, Watkins S, Lindsay MM, Mahrous A, Welsh P, Sattar N, Ford I, Oldroyd KG, Radjenovic A, Berry C. Temporal evolution of myocardial hemorrhage and edema in patients after acute ST-segment elevation myocardial infarction: pathophysiological insights and clinical implications. J Am Heart Assoc. 2016;5:e002834. doi: 10.1161/JAHA.115.002834. [DOI] [PMC free article] [PubMed] [Google Scholar]
- 13.Dharmakumar R. Building a unified mechanistic insight into the bimodal pattern of edema in reperfused acute myocardial infarctions: observations, interpretations, and outlook. J Am Coll Cardiol. 2015;66:829–831. doi: 10.1016/j.jacc.2015.05.074. doi: 10.1016/j.jacc.2015.05.074. [DOI] [PubMed] [Google Scholar]
- 14.Fernández-Jiménez R, Fuster V, Ibanez B. Reply: “waves of edema” seem implausible. J Am Coll Cardiol. 2016;67:1869–1870. doi: 10.1016/j.jacc.2016.01.052. doi: 10.1016/j.jacc.2016.01.052. [DOI] [PubMed] [Google Scholar]
- 15.Heusch P, Nensa F, Heusch G. Is MRI really the gold standard for the quantification of salvage from myocardial infarction? Circ Res. 2015;117:222–224. doi: 10.1161/CIRCRESAHA.117.306929. doi: 10.1161/CIRCRESAHA.117.306929. [DOI] [PubMed] [Google Scholar]
- 16.Thuny F, Lairez O, Roubille F, et al. Post-conditioning reduces infarct size and edema in patients with ST-segment elevation myocardial infarction. J Am Coll Cardiol. 2012;59:2175–2181. doi: 10.1016/j.jacc.2012.03.026. doi: 10.1016/j.jacc.2012.03.026. [DOI] [PubMed] [Google Scholar]
- 17.White SK, Frohlich GM, Sado DM, Maestrini V, Fontana M, Treibel TA, Tehrani S, Flett AS, Meier P, Ariti C, Davies JR, Moon JC, Yellon DM, Hausenloy DJ. Remote ischemic conditioning reduces myocardial infarct size and edema in patients with ST-segment elevation myocardial infarction. JACC Cardiovasc Interv. 2015;8:178–188. doi: 10.1016/j.jcin.2014.05.015. doi: 10.1016/j.jcin.2014.05.015. [DOI] [PubMed] [Google Scholar]
- 18.Ghugre NR, Pop M, Barry J, Connelly KA, Wright GA. Quantitative magnetic resonance imaging can distinguish remodeling mechanisms after acute myocardial infarction based on the severity of ischemic insult. Magn Reson Med. 2013;70:1095–105. doi: 10.1002/mrm.24531. doi: 10.1002/mrm.24531. [DOI] [PubMed] [Google Scholar]
- 19.Mewton N, Rapacchi S, Augeul L, Ferrera R, Loufouat J, Boussel L, Micolich A, Rioufol G, Revel D, Ovize M, Croisille P. Determination of the myocardial area at risk with pre- versus post-reperfusion imaging techniques in the pig model. Basic Res Cardiol. 2011;106:1247–1257. doi: 10.1007/s00395-011-0214-8. doi: 10.1007/s00395-011-0214-8. [DOI] [PubMed] [Google Scholar]
- 20.Fernandez-Jimenez R, Sanchez-Gonzalez J, Aguero J, Del Trigo M, Galan-Arriola C, Fuster V, Ibanez B. Fast T2 gradient-spin-echo (T2-GraSE) mapping for myocardial edema quantification: first in vivo validation in a porcine model of ischemia/reperfusion. J Cardiovasc Magn Reson. 2015;17:92. doi: 10.1186/s12968-015-0199-9. doi: 10.1186/s12968-015-0199-9. [DOI] [PMC free article] [PubMed] [Google Scholar]
- 21.Hausenloy DJ, Botker HE, Engstrom T, Erlinge D, Heusch G, Ibanez B, Kloner RA, Ovize M, Yellon DM, Garcia-Dorado D. Targeting reperfusion injury in patients with ST-segment elevation myocardial infarction: trials and tribulations. Eur Heart J. 2017;38:935–941. doi: 10.1093/eurheartj/ehw145. doi: 10.1093/eurheartj/ehw145. [DOI] [PMC free article] [PubMed] [Google Scholar]
- 22.Jablonowski R, Engblom H, Kanski M, Nordlund D, Koul S, van der Pals J, Englund E, Heiberg E, Erlinge D, Carlsson M, Arheden H. Contrast-enhanced CMR overestimates early myocardial infarct size: mechanistic insights using ECV measurements on day 1 and day 7. JACC Cardiovasc Imaging. 2015;8:1379–1389. doi: 10.1016/j.jcmg.2015.08.015. doi: 10.1016/j.jcmg.2015.08.015. [DOI] [PubMed] [Google Scholar]
- 23.Fernández-Jiménez R, Fernández-Friera L, Sánchez-González J, Ibáñez B. Animal models of tissue characterization of area at risk, edema and fibrosis. Curr Cardiovasc Imaging Rep. 2014;7:1–10. [Google Scholar]
- 24.Heusch G, Skyschally A, Schulz R. The in-situ pig heart with regional ischemia/reperfusion - ready for translation. J Mol Cell Cardiol. 2011;50:951–963. doi: 10.1016/j.yjmcc.2011.02.016. doi: 10.1016/j.yjmcc.2011.02.016. [DOI] [PubMed] [Google Scholar]
- 25.Wu KC. CMR of microvascular obstruction and hemorrhage in myocardial infarction. J Cardiovasc Magn Reson. 2012;14:68. doi: 10.1186/1532-429X-14-68. doi: 10.1186/1532-429X-14-68. [DOI] [PMC free article] [PubMed] [Google Scholar]
- 26.van der Pals J, Hammer-Hansen S, Nielles-Vallespin S, Kellman P, Taylor J, Kozlov S, Hsu LY, Chen MY, Arai AE. Temporal and spatial characteristics of the area at risk investigated using computed tomography and T1-weighted magnetic resonance imaging. Eur Heart J Cardiovasc Imaging. 2015;16:1232–1240. doi: 10.1093/ehjci/jev072. doi: 10.1093/ehjci/jev072. [DOI] [PMC free article] [PubMed] [Google Scholar]
- 27.Nensa F, Poeppel T, Tezgah E, Heusch P, Nassenstein K, Mahabadi AA, Forsting M, Bockisch A, Erbel R, Heusch G, Schlosser T. Integrated FDG PET/MR imaging for the assessment of myocardial salvage in reperfused acute myocardial infarction. Radiology. 2015;276:400–407. doi: 10.1148/radiol.2015140564. doi: 10.1148/radiol.2015140564. [DOI] [PubMed] [Google Scholar]
- 28.Fernández-Friera L, García-Ruiz JM, García-Álvarez A, Fernández-Jiménez R, Sánchez-González J, Rossello X, Gómez-Talavera S, López-Martín GJ, Pizarro G, Fuster V, Ibáñez B. Accuracy of area at risk quantification by cardiac magnetic resonance according to the myocardial infarction territory. Rev Esp Cardiol (Engl Ed) 2017;70:323–330. doi: 10.1016/j.rec.2016.07.004. doi: 10.1016/j.rec.2016.07.004. [DOI] [PubMed] [Google Scholar]
- 29.Heusch G, Rassaf T. Time to give up on cardioprotection? a critical appraisal of clinical studies on ischemic pre-, post-, and remote conditioning. Circ Res. 2016;119:676–695. doi: 10.1161/CIRCRESAHA.116.308736. doi: 10.1161/CIRCRESAHA.116.308736. [DOI] [PubMed] [Google Scholar]
- 30.Bodi V, Ruiz-Nodar JM, Feliu E, et al. Effect of ischemic postconditioning on microvascular obstruction in reperfused myocardial infarction. Results of a randomized study in patients and of an experimental model in swine. Int J Cardiol. 2014;175:138–146. doi: 10.1016/j.ijcard.2014.05.003. doi: 10.1016/j.ijcard.2014.05.003. [DOI] [PubMed] [Google Scholar]
- 31.Engstrøm T, Kelbæk H, Helqvist S, et al. Third Danish Study of Optimal Acute Treatment of Patients With ST Elevation Myocardial Infarction–Ischemic Postconditioning (DANAMI-3–iPOST) Investigators. Effect of ischemic postconditioning during primary percutaneous coronary intervention for patients with ST-segment elevation myocardial infarction: a randomized clinical trial. JAMA Cardiol. 2017;2:490–497. doi: 10.1001/jamacardio.2017.0022. doi: 10.1001/jamacardio.2017.0022. [DOI] [PMC free article] [PubMed] [Google Scholar]


