Abstract
The widespread bacterial resistance to a broad range of antibiotics necessitates rapid antibiotic susceptibility testing before effective treatment could start in the clinic. Among resistant bacteria, Staphylococcus aureus is one of the most important, and Methicillin-resistant (MRSA) strains are a common cause of life threatening infections. However, standard susceptibility testing for S. aureus is time consuming and thus the start of effective antibiotic treatment is often delayed. To circumvent the limitations of current susceptibility testing systems, we designed an assay that enables measurements of bacterial growth with higher spatial and temporal resolution than standard techniques. The assay consists of arrays of microwells that confine small number of bacteria in small spaces, where their growth is monitored with high precision. These devices enabled us to investigate the effect of different antibiotics on S. aureus growth. We measured the Minimal Inhibitory Concentration (MIC) in less than 3 hours. In addition to being significantly faster than the 48 hours needed for traditional microbiological methods, the assay is also capable of differentiating the specific effects of different antibiotic classes on S. aureus growth. Overall, this assay has the potential to become a rapid, sensitive, and robust tool for use in hospitals and laboratories to assess antibiotic sensitivity.
Keywords: Staphylococcus aureus, Tetracycline, Carbenicillin, Nafcillin, Penicillin G, Microfluidics
INNOVATION
Current methods for testing bacterial antibiotic sensitivity are time-consuming and expensive. Recently, use of microfluidic approaches has been investigated as an alternative. Although these methods have facilitated parallel testing of many samples and significantly shortened assay times, many suffer from complicated and time-consuming pre-loading steps. Here we describe a microwell bacterial culture system optimized for live imaging approaches that is low-cost, easy to set up, and provides MIC values and antibiotic sensitivity testing in three hours.
INTRODUCTION
Bacterial infections with Staphylococcus aureus often result in abscess formation, furuncles, and cellulitis. Although most skin infections caused by S. aureus heal without medical attention, many can progress into serious conditions that require antibiotic treatment. If treatment is ineffective, potentially life-threatening complications can develop. Over the past decade, the increased prevalence of antibiotic-resistant S. aureus strains has emerged as a major threat to public health. Antibiotic-resistant S. aureus now represents a leading cause of morbidity and mortality worldwide1. New technologies for rapid antibiotic sensitivity testing (AST) are needed to help address this issue2.
Traditionally, AST is performed by broth dilution or disk diffusion techniques3. These tests are based on visual observation of bacterial growth inhibition in the presence of increasing concentrations of antibiotics4. They characterize the bacteria as resistant, intermediate, or susceptible. However, both tests are time consuming. The results from disk diffusion assays require at least 24 hours, often even longer, and their results are semi-quantitative5. Serial dilutions provide quantitative results but are more expensive5.
Microfluidic technologies have recently started entering the AST field, with the goal of providing assays that would be easier to use and provide results faster6–26. The new microfluidic assays take advantage of miniaturization approaches, which have also been utilized for other clinical applications e.g. hemostasis, clinical biomarker analysis, cancer diagnosis, and nanoparticle sensors27–32. Campbell et al. reviewed the most recent advances in microfluidic devices for AST and identification four major strategies: 1) microfluidic incubator platforms; 2) gradient generators; 3) combined assays for identification and AST; and 4) AST based on bacterial death33. Several common features emerge from this classification. The volume of fluids within these devices is generally in the low nanoliter range, they require small amounts of sample9,16. Multiple tests could be simultaneously performed on multiple samples5,6,10,11. Imaging to quantify microbial growth in the presence and absence of antibiotics was implemented using several techniques, including the monitoring of optical density6,8,9,11, bright field/phase contrast11 and fluorescence measurements6,8–10,13,14,18. Several unconventional methods for monitoring AST have also been proposed, including RNA specific electrochemical biosensors34, pH changes of culture media during cell growth10,35, or asynchronous magnetic beads36. However, several limitations of current microfluidic systems also become apparent. Microscale systems usually require long and elaborated bacteria pre-loading and preparation steps6 and thus remain time-consuming6. Some of the devices require complex infrastructure, such as use of pumps and syringes9,11,13,14,16–18. Many require the immobilization of bacteria with agarose within microchannels11,15 or on agarose microparticles37.
Here, we describe a low-cost, time-effective open microwell assay that enables rapid measurements of Minimal Inhibitory Concentration (MIC) and evaluations of AST for S. aureus. We probed the effect of four antibiotics (Tetracycline, Carbenicillin, Nafcillin, and Penicillin G) at six concentrations each on S. aureus proliferation. One interesting finding was the transient increase of proliferation rates of S. aureus in the presence of Penicillin G and Nafcillin at concentrations below MIC, compared to no-antibiotic controls. Our assay provides quantitative measurements from low-density bacterial samples and enables parallel AST of up to 24 drugs in three hours.
MATERIALS AND METHODS
Antibiotic preparation
Stock solutions of 10 mg/mL of Tetracycline, Carbenicillin disodium, Nafcillin sodium salt, and Penicillin G sodium salt (Sigma Aldrich, Saint Louis, Missouri) were prepared in water (WFI, Sigma Aldrich). Working solutions were then prepared for each antibiotic, at 100 μg/mL. Subsequently, 1:10 dilution series were made in heart infusion broth (BHI, Sigma Aldrich), to encompass antibiotic concentrations ranging from 100 μg/mL down to 1 ng/mL.
Fabrication of microwell array
Devices were fabricated using standard soft-lithography techniques on four-inch wafers. Photoresist (SU-8, Michrochem, Newton, MA) was spin-coated onto a silicon wafer and exposed to ultraviolet (UV) light, through a photolithography mask. The silicon master wafer with photo-patterned structures was employed to mold arrays of microwells that were 40 μm in diameter, 100 μm in depth, and were spaced at 20 μm. Using this technique, 70 arrays, each with 1,164 microwells, were molded at one time from a single silicon wafer. Polydimethylsiloxane (PDMS, Sylgard 184, Dow Corning, Midland, MI) was mixed with cross-linking agent in a ratio of 10:1 and poured onto wafers. A 100 μm layer of PDMS was created by pressing a flat plastic sheet on top of the wafer using a 0.5 Ib weight, for 12 hours. The PDMS was cured overnight at 65°C, after which the PDMS layer was peeled off the wafer and the arrays of wells were cut using a scalpel. The microwell-arrays were bonded to glass-bottom 24-well plates after treating the bonding surface of PDMS and plate with oxygen plasma (1,164 microwells per well). The plates were heated to 85°C for 10 minutes to complete the PDMS-to-glass bonding.
Bacterial cell culture
The SH1000-GFP S. aureus strain, which constitutively expresses green fluorescent protein (GFP), was received as a generous gift from the laboratory of Mary Mullins at the University of Sheffield (Sheffield, UK). Bacterial cultures were routinely cultivated in brain heart infusion (BHI) Agar (Remel, Lenexa, KS, USA). Single colonies from agar plates were picked and suspended in 5 mL of BHI broth medium and then incubated at 37°C in aerobic incubator with shaking overnight. After overnight incubation, bacterial suspensions were sub-cultured by adding 1 mL of the overnight culture into 49 mL of BHI broth for 4 hours. Bacterial concentrations were determined using a hemocytometer and the final concentration of bacteria was adjusted to 1 × 10⁶ cells/mL and diluted with BHI broth.
Device loading
To facilitate the loading of the bacterial suspension into open microwells, we treated the devices with oxygen plasma to restore the hydrophilic surfaces. Approximately 100 μL of bacterial suspension was then loaded and the plate placed under vacuum for 10 minutes to remove any gas trapped within the PDMS microwells. After vacuum, antibiotics at a range of concentrations in BHI, were added to each well of the 24-well plate.
Off-chip MIC measurements
To validate our microwell assay, off-chip MIC determination was performed using the standard broth dilution (SBD) method according to CLSI protocols3. We prepared four different antibiotics stock solutions of 10 mg/mL for Carbenicillin, Nafcillin, Penicillin G, and Tetracycline in water. The working solutions were then prepared for each antibiotic at 100 μg/mL. A serial dilution series with a final volume of 1 mL was created by preparing a 1:10 dilution series in S. aureus suspension at concentration of 1 × 10⁶ cells/mL diluted with BHI, such that the final solutions contained antibiotic concentrations ranging from 100 μg/mL to 1 ng/mL. We then incubated the culture for 20 hours in an incubator at 37°C according to CLSI protocols, and the MIC determined after incubation.
Image processing, data acquisition, quantification and analysis
During the experiments, a 24-well plate with microwells was placed on a fully automated Nikon TiE microscope (Micro Device Instruments, Avon, MA, USA) with an incubator heated to 37°C. Images were acquired through a 10× objective in fluorescence or phase contrast settings. Growth of bacteria was recorded using time-lapse imaging, with individual frames recorded at an interval of 10 minutes for a minimum of 250 minutes. The total number of experimental repeats for this analysis was eight for Penicillin G and six for Carbenicillin, Nafcillin and Tetracycline. Error bars represent mean ± SEM. Time lapse image sequences were analyzed by FIJI (Fiji Is Just ImageJ, NIH). Results were plotted using Sigma Plot version 12.
RESULTS
Bacterial growth is usually measured either by visual inspection of colony growth on solid media or by optical density measurements of liquid cultures. Growth of visible colonies often takes 12 hours, while liquid culture measurements can be complicated by contamination with faster growing bacteria. We hypothesized that microscale approaches may combine aspects of these two methods, while avoiding some of their inherent shortcomings.
Microwell array design and optimization
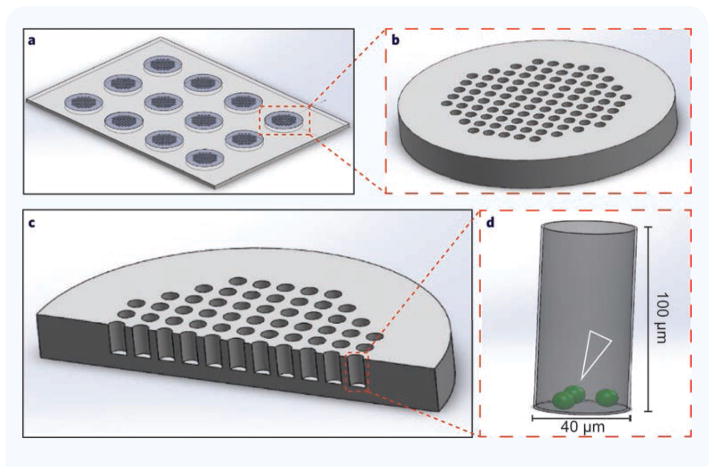
We evaluated bacterial growth in the presence of various antibiotics at a range of concentrations inside arrays consisting of 12 groups of 97 microwells (1164 microwells per condition). The hexagonal layout of the array was optimized for microscopy using a 10× lens with a field of view of at least 700 μm × 700 μm without requiring rotational alignment (Fig. 1). Each microwell has 40 μm diameter. We compared the efficacy of bacterial capture in microwells with depths between 20 and 50 μm, and found that all exhibited unwanted washing of bacteria from the device. This issue was resolved by increasing the microwell depth to 100 μm. We found that a 2:5 ratio of microwell width to depth allowed efficient washing of the device and addition of antibiotics without any loss of bacteria from the microwells.
Figure 1. Schematic of the microwell devices for bacterial antibiotic sensitivity testing.
(a) Overview of devices with 12 viewing fields. The devices were designed such that one device fits in one well of a multi-well plate. (b) A single viewing field magnified to show the open microwell array. (c) Cross-section through array shows microwell geometry. (d) Magnification of one microwell. Open white arrowhead indicates bacterial positioning following loading.
Application of growth assay for calculating MIC
We tested the ability of four antibiotics commonly used for S. aureus infections: Carbenicillin, Nafcillin, Penicillin G, and Tetracycline, to inhibit the growth of bacteria. Carbenicillin, Nafcillin, and Penicillin G are known to which inhibit bacterial cell wall formation, while Tetracycline prevents bacterial protein biosynthesis. We hypothesized that by measuring bacterial growth over time at different doses, detailed information about antibiotic sensitivity and corresponding growth responses could be obtained.
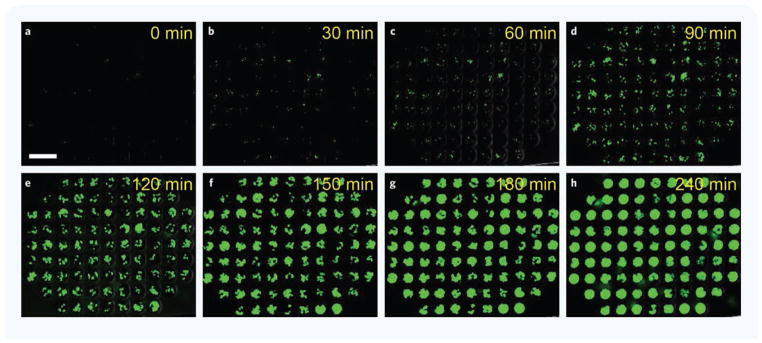
We measured S. aureus growth by time-lapse imaging performed on bacteria constitutively expressing EGFP. Images were acquired every 10 minutes for a minimum of 250 minutes using fluorescence microscopy (Fig. 2). We measured bacterial growth in a range of antibiotic concentrations and calculated the MIC for the four different antibiotics.
Figure 2. S. aureus growth inside microwell arrays in the presence of 1 ng/mL Tetracycline.
(a–h) Time-lapse images show S. aureus growth in the presence of bellow MIC, 1 ng/mL Tetracycline. Most microwells are filled with green fluorescent S. aureus at 180 minutes; 87 of the 97 microwells in one array can be captured in one image. Scale bar: 100 μm.
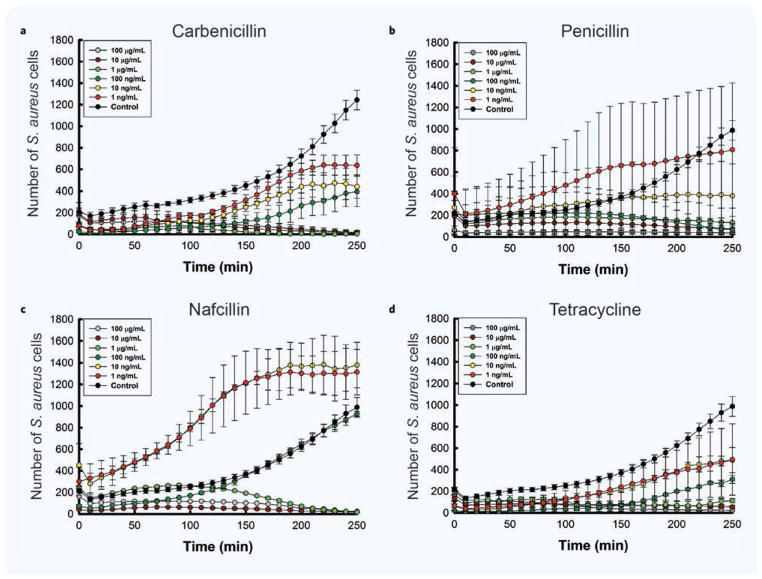
As expected, bacteria growth was altered dependent on antibiotic concentration (Fig. 3a–d). The inhibitory concentrations were comparable for the four antibiotics. We found that S. aureus was resistant to Carbenicillin for concentrations up to 100 ng/mL. At lower concentrations, between 1 ng/mL and 10 ng/mL, the bacteria growth curves reached a plateau at approximately 220 minutes, consistent with a bacteriostatic effect. S. aureus became susceptible to killing by Carbenicillin at concentration of 1 μg/mL and higher. Bacterial growth in the presence of Tetracycline and Nafcillin concentrations below 100 ng/mL did not reach a stationary phase within the observation window of 250 minutes. For Penicillin G, concentrations higher than 10 ng/mL killed the bacteria. From the S. aureus growth measurements using our assay, we estimated MIC values of 1 μg/mL for Carbenicillin, Tetracycline and Nafcillin, and 100 ng/mL for Penicillin G (Fig. 3).
Figure 3. Correlation between antibiotic concentration and bacterial growth over time.
(a–d) S. aureus growth curves are shown at different concentrations of various antibiotics. The total number of observations for this analysis was 8 for Penicillin G and 6 for the remaining groups. Data is presented as mean and standard error of the mean number of individual cells counted in the 97 wells of an array.
Distinct bacterial growth signatures with different antibiotics
We observed differences in growth curves for S. aureus in the presence of different antibiotics. These differences suggest that the growth rate changes over time may be due to different mechanisms of action by different antibiotic classes. We observed a plateau in the growth rate above threshold concentrations for S. aureus incubated with antibiotics that target the bacteria cells wall (Carbenicillin, Penicillin and Nafcillin). We did not observe a plateau phase state in the presence of an antibiotic that targets protein synthesis (Tetracycline — Fig. 3a–d). These differences are consistent with the known mechanisms by which each antibiotic inhibits bacterial growth.
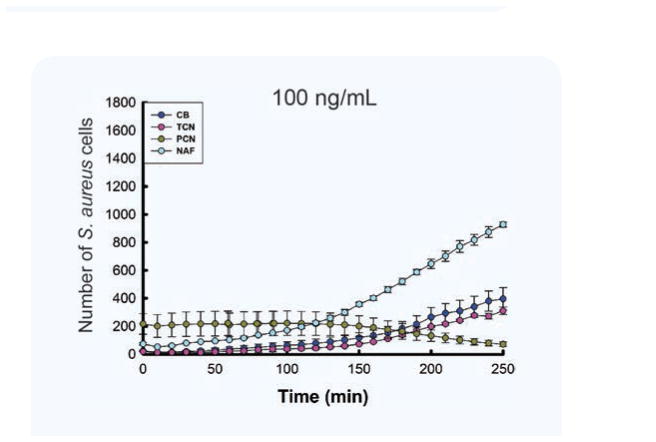
A comparison of S. aureus growth curves in the presence of the four antibiotics at the same 100 ng/mL concentration confirmed that the wildtype S. aureus was susceptible to Penicillin G, which blocked growth and reduced bacterial numbers, but was resistant to Tetracycline, Carbenicillin disodium, and Nafcillin sodium salt, which allowed bacterial growth (Fig. 4).
Figure 4. Different effect of different antibiotic on bacterial growth.
S. aureus is susceptible to Penicillin G (PCN) but resistant to Tetracycline (TCN), Carbenicillin disodium (CB), and Nafcillin sodium salt (NAF) at 100 ng/mL. The total number of observations for this analysis was 8 for Penicillin G and 6 for the remaining groups. Data is presented as mean and standard error of the mean number of cells counted in the 97 wells of an array.
Selection of viable clones occurs in the first round of bacterial replication
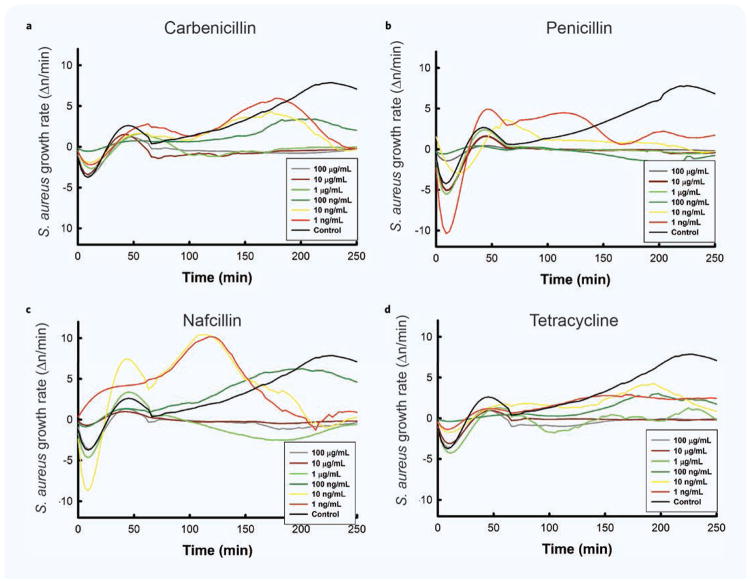
By seeding the device such that only one or two bacteria were present in each microwell, we hypothesized that it should also be possible to identify emerging antibiotic-resistant clones. Analysis of the rate of change of the number of S. aureus in the wells in response to specific antibiotics revealed a transient decrease in bacteria numbers in the first 30 minutes followed by a peak in growth (Fig. 5a–d). However, a lag phase was noted also for control samples, suggesting that a proportion of bacterial death may be due to sensitivity to the change of culture media or the procedures during the device priming. Interestingly, selective killing was observed in response to Penicillin and Nafcillin, but not to Tetracycline or Carbenicillin. At later times, bacteria growth resumed at antibiotic concentrations below MIC. A summary of bacterial growth rate characteristics at different concentrations of antibiotics is presented in Table 1.
Figure 5. Changes of bacterial growth rate over time.
(a–d) S. aureus average growth rates are shown at different concentrations of different antibiotics. “Negative” growth rates represent bacteria death rates. N = 8 experimental repeats for Penicillin G and N = 6 for all other conditions.
Table 1.
Summary of bacterial growth rate observation at different concentrations of antibiotics.
| Antibiotic | Condition | Observations from growth rate graphs |
|---|---|---|
| No antibiotic | Control — no antibiotic |
|
| All antibiotics | Concentrations above MIC |
|
| Carbenicillin | Concentrations below MIC |
|
| Penicillin G | Concentrations below MIC |
|
| Nafcillin | Concentrations below MIC |
|
| Tetracycline | Concentrations below MIC |
|
Low doses of antibiotic boost rates of bacterial proliferation
Strikingly, we observed higher growth rates in the presence of Penicillin and Nafcillin at concentrations below the MIC (Fig. 5). These were preceded by the large initial dips in bacterial growth, suggesting that the killing of the most sensitive bacteria may select for clones with enhanced proliferative capacity, which grow faster in the absence of competition for nutrients from other bacteria. For antibiotic concentrations that eventually terminated almost all bacteria, the rate decreased, and after a sharp change in rate (corresponding to a sharp bend in the graph), the rate approached zero. This sharp change in growth rate occurred 60–80 minutes into the experiment, indicating that several rounds of bacterial division occurred before the antibiotic became fully effective. Interestingly, for intermediate concentrations, at which the bacteria resist the antibiotic, there were two or three peaks in the rate graph within the time range of the experiment. The position and the amplitude ratio of peaks appeared to be specific for each antibiotic, and may indicate the progressively effective activity of the antibiotic noted above, coupled with the emergence of progressively resistant clones.
Bacterial proliferation in microwells can be observed for non-fluorescent strains
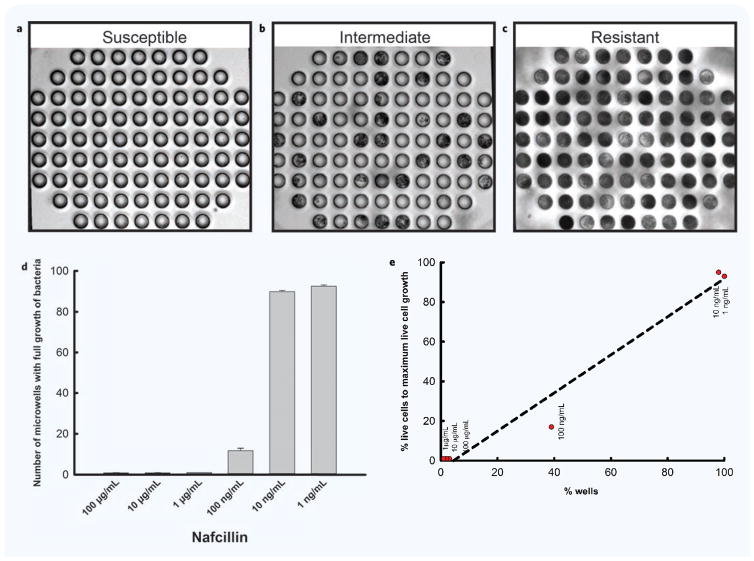
This device was designed with practical clinical applications in mind, which would clearly exclude the use of transgenic markers. To test whether bacterial growth could be measured with bacteria strains that do not express fluorescent proteins, we conducted experiments that relied on bright field imaging and compared the results with those obtained by fluorescent imaging. The results show that it is possible to distinguish between susceptibility, intermediate sensitivity, and antibiotic resistance for bacteria that are not fluorescent (Fig. 6). Results from bright field imaging are largely consistent with those obtained using fluorescent imaging (Fig. 6d). Some differences could be noted, likely due to the variability of growth rate in the middle range of antibiotics concentrations (Fig. 6e).
Figure 6. Representative micrographs depicting different categories of bacteria sensitivity in experiments to investigate effect of antibiotics on bacterial growth.
(a–c) Micrographs of three microwell arrays, showing an image of time lapse imaging following 3 hours incubation with Nafcillin. (a) An example of the antibiotic susceptible category. There is no evidence of bacteria growth inside the wells. (b) An example of the intermediate antibiotic sensitivity category. There is evidence of bacteria growth inside some but not all microwells, and many wells are only partially filled. (c) An example of the antibiotic resistant category. There is evidence of bacteria inside all microwells. (d) Data captured from time lapse imaging following 3 hours incubation with Nafcillin. S. aureus is susceptible to Nafcillin at concentrations above 1 μg/mL. S. aureus has intermediate antibiotic sensitivity to Nafcillin at 100 ng/mL. S. aureus shows resistance to Nafcillin at concentrations below 10 ng/mL. (e) Comparison of BF imaging results with fluorescent imaging results.
Comparing the MIC of different antibiotics against bacteria using off-chip measurements
We validated our on-chip assay by comparing our MIC measurements to off-chip broth dilution approaches, using S. aureus and four different antibiotics: Carbenicillin, Nafcillin, Penicillin G, and Tetracycline. The broth dilution approach obtained an MIC for Carbenicillin, Nafcillin, Penicillin G, and Tetracycline of 1 μg/mL, 1 μg/mL, 100 ng/mL, and 100 ng/mL, respectively. We found that the results of our MIC assay on-chip closely matched those obtained by broth dilution approaches for Carbenicillin, Nafcillin, and Penicillin G. Interestingly the only exception was the MIC of Tetracycline against S. aureus, in which the MIC on-chip assay was 1 μg/mL vs. 100 ng/mL in the broth assay. This result suggests that a cumulative effect of protein synthesis inhibition may require incubation longer than 3 hours for accurate results.
DISCUSSION
This study presents open-microwell arrays system for faster evaluation of antibiotic sensitivity for S. aureus. The system reduces the AST time from 48 hours for traditional assays, down to 3 hours. The high-aspect ratio of the wells is critical for our ability to hold in place and monitor small numbers of S. aureus while replacing the media and adding antibiotics around them. Each microwell array is placed in a well of a multiwell plate. Thus, we were able to measure MIC for four antibiotics at six concentrations each (Tetracycline, Carbenicillin, Nafcillin, and Penicillin G, at concentrations from 1 ng/mL up to 100 μg/mL).
The new assay is faster than other AST assays (reviewed recently in Ref. 38). One significant time-saving feature are the deep microwells, which enable loading bacteria in liquid media and circumvents the need for longer protocols for pre-loading and holding bacteria in fixed positions e.g. encapsulating bacteria in various gels8–10. Only two other studies investigated antibiotic sensibility without preloading steps. Hou et al., performed experiments in less than 3 hours11. However, their approach requires pre-encapsulation of bacteria in agarose-based gel prior to the assay. He et al. measured MIC and antibiotic susceptibility in 4 to 8 hours6 and the whole process, including the preparation of the assay, takes 8.5 hours. Overall, our approach allows fast and simple loading of bacteria and antibiotics directly into the open microwells and reduced the time of the assay to 3 hours.
The assay provides large amount of data regarding S. aureus growth, through the use of time-lapse microscopy. These allow us to monitor bacterial growth and record changes in growth rate. These measurements revealed distinct variations of the growth rate for different bacteria at various concentrations, starting with the initial lag phase in the 30 minutes after loading the bacteria39, and continuing with the exponential growth. In addition to discrimination of growth phases, our device enables distinction between cell wall inhibitory antibiotics (Carbenicillin, Nafcillin, and Penicillin G), and antibiotics that inhibited protein synthesis (e.g. Tetracycline) by observing the time when bacterial growth reached the stationary phase. The growth rate was faster for cell wall inhibitors and slower for protein synthesis inhibitors. One surprising result from our work was the higher growth rate of the S. aureus at concentrations lower than the MIC. This effect is consistent with the observation of an increased bacterial density at the edge of antibiotic zones of inhibition in classical antibiotic sensitivity testing, noted before to occur only in the presence of nutrient rich media and sub-lethal concentration of antibiotic40. This effect may be relevant to the acquisition of antibiotic resistance and the higher precision of our assay may help design new approaches to study the molecular mechanisms involved. Overall, our approach has the potential to be a rapid, sensitive, and reliable technology for use at hospitals and laboratories for testing bacteria for antibiotic sensitivity.
Acknowledgments
We would like to thank Dr. Maedeh Roushan and Dr. Eduardo Reategui for assistance with the image analysis. This work was supported by a grant from the National Institute of Dental and Craniofacial Research (DE024468). Microfabrication was conducted at the BioMEMS Resource Center at Massachusetts General Hospital, supported by a grant from the National Institute of Biomedical Imaging and Bioengineering (EB002503). Dr. Felix Ellett was supported by a fellowship from Shriners Hospital for Children.
References
- 1.Song JH, Jung SI, Ko KS, et al. High prevalence of antimicrobial resistance among clinical Streptococcus pneumoniae isolates in Asia (an ANSORP study) Antimicrob Agents Chemother. 2004;48:2101–2107. doi: 10.1128/AAC.48.6.2101-2107.2004. [DOI] [PMC free article] [PubMed] [Google Scholar]
- 2.Nischal PM. First global report on antimicrobial resistance released by the WHO. Natl Med J India. 2014;27:241. [PubMed] [Google Scholar]
- 3.Clinical and Laboratory Standards Institute; Apr, 2017. Weblink. ( http://clsi.org/) [Google Scholar]
- 4.Varela NP, Friendship R, Dewey C, et al. Comparison of agar dilution and e-test for antimicrobial susceptibility testing of Campylobacter coli isolates recovered from 80 Ontario swine farms. Can J Vet Res. 2008;72:168–174. [PMC free article] [PubMed] [Google Scholar]
- 5.Jenkins SG, Schuetz AN. Current concepts in laboratory testing to guide antimicrobial therapy. Mayo Clin Proc. 2012;87:290–308. doi: 10.1016/j.mayocp.2012.01.007. [DOI] [PMC free article] [PubMed] [Google Scholar]
- 6.He J, Mu X, Guo Z, et al. A novel microbead-based microfluidic device for rapid bacterial identification and antibiotic susceptibility testing. Eur J Clin Microbiol Infect Dis. 2014;33:2223–2230. doi: 10.1007/s10096-014-2182-z. [DOI] [PubMed] [Google Scholar]
- 7.Matsumoto Y, Sakakihara S, Grushnikov A, et al. A microfluidic channel method for rapid drug-susceptibility testing of Pseudomonas aeruginosa. PLoS One. 2016;11:e0148797. doi: 10.1371/journal.pone.0148797. [DOI] [PMC free article] [PubMed] [Google Scholar]
- 8.Kim KP, Kim YG, Choi CH, et al. In situ monitoring of antibiotic susceptibility of bacterial biofilms in a microfluidic device. Lab Chip. 2010;10:3296–3299. doi: 10.1039/c0lc00154f. [DOI] [PubMed] [Google Scholar]
- 9.Takagi R, Fukuda J, Nagata K, et al. A microfluidic microbial culture device for rapid determination of the minimum inhibitory concentration of antibiotics. Analyst. 2013;138:1000–1003. doi: 10.1039/c2an36323b. [DOI] [PubMed] [Google Scholar]
- 10.Cira NJ, Ho JY, Dueck ME, et al. A self-loading microfluidic device for determining the minimum inhibitory concentration of antibiotics. Lab Chip. 2012;12:1052–1059. doi: 10.1039/c2lc20887c. [DOI] [PubMed] [Google Scholar]
- 11.Hou Z, An Y, Hjort K, et al. Time lapse investigation of antibiotic susceptibility using a microfluidic linear gradient 3D culture device. Lab Chip. 2014;14:3409–3418. doi: 10.1039/c4lc00451e. [DOI] [PubMed] [Google Scholar]
- 12.Sauer-Budge AF, Mirer P, Chatterjee A, et al. Low cost and manufacturable complete microtas for detecting bacteria. Lab Chip. 2009;9:2803–2810. doi: 10.1039/b904854e. [DOI] [PubMed] [Google Scholar]
- 13.Sun P, Liu Y, Sha J, et al. High-throughput microfluidic system for long-term bacterial colony monitoring and antibiotic testing in zero-flow environments. Biosens Bioelectron. 2011;26:1993–1999. doi: 10.1016/j.bios.2010.08.062. [DOI] [PubMed] [Google Scholar]
- 14.Kalashnikov M, Lee JC, Campbell J, et al. A microfluidic platform for rapid, stress-induced antibiotic susceptibility testing of Staphylococcus aureus. Lab Chip. 2012;12:4523–4532. doi: 10.1039/c2lc40531h. [DOI] [PMC free article] [PubMed] [Google Scholar]
- 15.Choi J, Jung YG, Kim J, et al. Rapid antibiotic susceptibility testing by tracking single cell growth in a microfluidic agarose channel system. Lab Chip. 2013;13:280–287. doi: 10.1039/c2lc41055a. [DOI] [PubMed] [Google Scholar]
- 16.Tang Y, Zhen L, Liu J, et al. Rapid antibiotic susceptibility testing in a microfluidic pH sensor. Anal Chem. 2013;85:2787–2794. doi: 10.1021/ac303282j. [DOI] [PubMed] [Google Scholar]
- 17.Mohan R, Mukherjee A, Sevgen SE, et al. A multiplexed microfluidic platform for rapid antibiotic susceptibility testing. Biosens Bioelectron. 2013;49:118–125. doi: 10.1016/j.bios.2013.04.046. [DOI] [PubMed] [Google Scholar]
- 18.Kim SC, Cestellos-Blanco S, Inoue K, et al. Miniaturized antimicrobial susceptibility test by combining concentration gradient generation and rapid cell culturing. Antibiotics (Basel) 2015;4:455–466. doi: 10.3390/antibiotics4040455. [DOI] [PMC free article] [PubMed] [Google Scholar]
- 19.Choi J, Yoo J, Lee M, et al. A rapid antimicrobial susceptibility test based on single-cell morphological analysis. Sci Transl Med. 2014;6:267ra174. doi: 10.1126/scitranslmed.3009650. [DOI] [PubMed] [Google Scholar]
- 20.Choi J, Yoo J, Kim KJ, et al. Rapid drug susceptibility test of Mycobacterium tuberculosis using microscopic time-lapse imaging in an agarose matrix. Appl Microbiol Biotechnol. 2016;100:2355–2365. doi: 10.1007/s00253-015-7210-0. [DOI] [PubMed] [Google Scholar]
- 21.Puchberger-Enengl D, van den Driesche S, Krutzler C, et al. Hydrogel-based microfluidic incubator for microorganism cultivation and analyses. Biomicrofluidics. 2015;9:014127. doi: 10.1063/1.4913647. [DOI] [PMC free article] [PubMed] [Google Scholar]
- 22.Dai J, Suh SJ, Hamon M, et al. Determination of antibiotic ec50 using a zero-flow microfluidic chip based growth phenotype assay. Biotechnol J. 2015;10:1783–1791. doi: 10.1002/biot.201500037. [DOI] [PubMed] [Google Scholar]
- 23.Derzsi L, Kaminski TS, Garstecki P. Antibiograms in five pipetting steps: Precise dilution assays in sub-microliter volumes with a conventional pipette. Lab Chip. 2016;16:893–901. doi: 10.1039/c5lc01151e. [DOI] [PubMed] [Google Scholar]
- 24.Li B, Qiu Y, Glidle A, et al. Single cell growth rate and morphological dynamics revealing an “opportunistic” persistence. Analyst. 2014;139:3305–3313. doi: 10.1039/c4an00170b. [DOI] [PubMed] [Google Scholar]
- 25.Dong ZM, Zhao GC. Label-free detection of pathogenic bacteria via immobilized antimicrobial peptides. Talanta. 2015;137:55–61. doi: 10.1016/j.talanta.2015.01.015. [DOI] [PubMed] [Google Scholar]
- 26.Kalashnikov M, Campbell J, Lee JC, et al. Stress-induced antibiotic susceptibility testing on a chip. J Vis Exp. 2014;83:e50828. doi: 10.3791/50828. [DOI] [PMC free article] [PubMed] [Google Scholar]
- 27.Neeves KB, Onasoga AA, Wufsus AR. The use of microfluidics in hemostasis: Clinical diagnostics and biomimetic models of vascular injury. Curr Opin Hematol. 2013;20:417–423. doi: 10.1097/MOH.0b013e3283642186. [DOI] [PMC free article] [PubMed] [Google Scholar]
- 28.Pagaduan JV, Sahore V, Woolley AT. Applications of microfluidics and microchip electrophoresis for potential clinical biomarker analysis. Anal Bioanal Chem. 2015;407:6911–6922. doi: 10.1007/s00216-015-8622-5. [DOI] [PMC free article] [PubMed] [Google Scholar]
- 29.Valencia PM, Farokhzad OC, Karnik R, et al. Microfluidic technologies for accelerating the clinical translation of nanoparticles. Nat Nanotechnol. 2012;7:623–629. doi: 10.1038/nnano.2012.168. [DOI] [PMC free article] [PubMed] [Google Scholar]
- 30.Sia SK, Kricka LJ. Microfluidics and point-of-care testing. Lab Chip. 2008;8:1982–1983. doi: 10.1039/b817915h. [DOI] [PubMed] [Google Scholar]
- 31.White WN, Raj A, Nguyen MD, et al. Clinical application of microfluidic leukocyte enrichment protocol in mild phenotype sickle cell disease (SCD) Biomed Microdevices. 2009;11:477–483. doi: 10.1007/s10544-008-9253-9. [DOI] [PubMed] [Google Scholar]
- 32.Irimia D, Ellett F. Big insights from small volumes: Deciphering complex leukocyte behaviors using microfluidics. J Leukoc Biol. 2016;100(2):291–304. doi: 10.1189/jlb.5RU0216-056R. [DOI] [PMC free article] [PubMed] [Google Scholar]
- 33.Campbell J, McBeth C, Kalashnikov M, et al. Microfluidic advances in phenotypic antibiotic susceptibility testing. Biomed Microdevices. 2016;18:103. doi: 10.1007/s10544-016-0121-8. [DOI] [PMC free article] [PubMed] [Google Scholar]
- 34.Mach KE, Mohan R, Baron EJ, et al. A biosensor platform for rapid antimicrobial susceptibility testing directly from clinical samples. J Urol. 2011;185:148–153. doi: 10.1016/j.juro.2010.09.022. [DOI] [PMC free article] [PubMed] [Google Scholar]
- 35.Duffy DC, McDonald JC, Schueller OJ, et al. Rapid prototyping of microfluidic systems in poly(dimethylsiloxane) Anal Chem. 1998;70:4974–4984. doi: 10.1021/ac980656z. [DOI] [PubMed] [Google Scholar]
- 36.Sinn I, Kinnunen P, Albertson T, et al. Asynchronous magnetic bead rotation (ambr) biosensor in microfluidic droplets for rapid bacterial growth and susceptibility measurements. Lab Chip. 2011;11:2604–2611. doi: 10.1039/c0lc00734j. [DOI] [PubMed] [Google Scholar]
- 37.Eun YJ, Utada AS, Copeland MF, et al. Encapsulating bacteria in agarose microparticles using microfluidics for high-throughput cell analysis and isolation. ACS Chem Biol. 2011;6:260–266. doi: 10.1021/cb100336p. [DOI] [PMC free article] [PubMed] [Google Scholar]
- 38.Dai J, Hamon M, Jambovane S. Microfluidics for antibiotic susceptibility and toxicity testing. Bioengineering. 2016;3(4):25–37. doi: 10.3390/bioengineering3040025. [DOI] [PMC free article] [PubMed] [Google Scholar]
- 39.Rolfe MD, Rice CJ, Lucchini S, et al. Lag phase is a distinct growth phase that prepares bacteria for exponential growth and involves transient metal accumulation. J Bacteriol. 2012;194:686–701. doi: 10.1128/JB.06112-11. [DOI] [PMC free article] [PubMed] [Google Scholar]
- 40.Lorian V, Strauss L. Increased bacterial density at the edge of antibiotic zones of inhibition. J Bacteriol. 1966;92:1256–1257. doi: 10.1128/jb.92.4.1256-1257.1966. [DOI] [PMC free article] [PubMed] [Google Scholar]


