Abstract
OBJECTIVE
To study peritumoral brain edema (PTBE), it is necessary to create a model that accurately simulates vasogenic brain edema (VBE) without introducing a complicated tumor environment. PTBE associated with brain tumors is predominantly a result of vascular endothelial growth factor (VEGF) secreted by brain tumors, and VEGF infusion alone can lead to histological blood-brain barrier (BBB) breakdown in the absence of tumor. VBE is intimately linked to BBB breakdown. The authors sought to establish a model for VBE with chronic infusion of VEGF that can be validated by serial in-vivo MRI and histological findings.
METHODS
Male Fischer rats (n = 182) underwent stereotactic striatal implantation of MRI-safe brain cannulas for chronic infusion of VEGF (2–20 μg/ml). Following a preinfusion phase (4–6 days), the rats were exposed to VEGF or control rat serum albumin (1.5 μl/hr) for as long as 144 hours. Serial MRI was performed during infusion on a high-field (9.4-T) machine at 12–24, 24–36, 48–72, and 120–144 hours. Rat brains were then collected and histological analysis was performed.
RESULTS
Control animals and animals infused with 2 μg/ml of VEGF experienced no neurological deficits, seizure activity, or abnormal behavior. Animals treated with VEGF demonstrated a significantly larger volume (42.90 ± 3.842 mm3) of T2 hyper-attenuation at 144 hours when compared with the volume (8.585 ± 1.664 mm3) in control animals (mean difference 34.31 ± 4.187 mm3, p < 0.0001, 95% CI 25.74–42.89 mm3). Postcontrast T1 enhancement in the juxtacanalicular region indicating BBB breakdown was observed in rats undergoing infusion with VEGF. At the later time periods (120–144 hrs) the volume of T1 enhancement (34.97 ± 8.99 mm3) was significantly less compared with the region of edema (p < 0.0001). Histologically, no evidence of necrosis or inflammation was observed with VEGF or control infusion. Immunohistochemical analysis demonstrated astrocyte activation, vascular remodeling, and increased claudin-5 expression in juxtacanalicular regions. Aquaporin-4 expression was increased in both control and VEGF animals in the juxtacanalicular regions.
CONCLUSIONS
The results of this study show that chronic brain infusion of VEGF creates a reliable model of VBE. This model lacks necrosis and inflammation that are characteristic of previous models of VBE. The model allows for a precise investigation into the mechanism of VBE formation. The authors also anticipate that this model will allow for investigation into the mechanism of glucocorticoid action in abrogating VBE, and to test novel therapeutic strategies targeting PTBE.
Keywords: vasogenic, peritumoral, VEGF, infusion, animal model, brain edema, rat, cannula
Regardless of histological type, brain tumors are frequently associated with neuronal dysfunction resulting in focal neurological deficits, or with more global impairments of neurological function such as seizure activity and changes in mental status. These tumor effects are often caused by tumor invasion into peritumoral brain,23,24 but more often they result from peritumoral brain edema (PTBE). PTBE leads to an increase in brain volume and eventually affects intracranial pressure, which may eventually lead to brain herniation or even death.6,30 Current treatment regimens targeting PTBE depend heavily on corticosteroid administration, but relief from edema may be short-lived and associated with significant systemic side effects.10,12,30,43,45,57 Improved understanding of the cellular and molecular mechanisms underlying PTBE may lead to better treatments with fewer systemic side effects. PTBE is related to blood-brain barrier (BBB) breakdown, and is mediated by vascular endothelial growth factor (VEGF).3,17,48,58 PTBE results in vasogenic brain edema (VBE) surrounding brain tumors.
Existing animal models for brain edema are created by acute injury, leading to failure of the cellular Na-K pump and subsequent cell swelling and death, and do not accurately portray PTBE or VBE. In these models, the timeline of edema formation (within 24 hours of injury), location of fluid accumulation (intracellular), and direct effect on cell viability (cell death and apoptosis) represent cytotoxic edema.30,47,52 The cold injury model has been used previously as a VBE model, but the presence of significant apoptosis and cytotoxic edema7,19,31,33 make it unsuitable for use in the investigation of PTBE. VBE is characterized by intercellular edema and minimal apoptosis. Previous work has shown that VEGF infusion alone can lead to histological BBB breakdown in the absence of tumor.17,37,58
On MRI, T2-weighted or FLAIR53 sequences are used interchangeably to detect both PTBE and infiltrating tumor. 38 The FLAIR sequence is more sensitive in detecting tumor infiltration, therefore T2 hyperintensity may be more specific for brain edema.11,63 To study PTBE using imaging, it is necessary to create a tumor-free platform that accurately simulates VBE while avoiding confounding of the T2 signal from tumor infiltration. We sought to establish a model for VBE with chronic infusion of VEGF that can be validated by serial in-vivo MRI and histological findings.
Methods
Animals
Male Fischer-344 rats (n = 182) between 275 and 350 g (Charles River Inc.) were evaluated preoperatively and twice daily postoperatively for any signs of neurological decline and distress, including head tilt, circling behavior, limb weakness, lethargy, agitation, and weight loss. The study was approved by the Institutional Animal Care and Use Committee of the National Institute of Neurological Diseases and Stroke at NIH.
Infusion Preparation
A solution of 0.1% rat serum albumin (RSA) in sterile PBS was prepared, to which a trace amount of fluorescein isothiocyanate (FITC)–labeled albumin was added. The albumin mixture was then passed through a 0.45-μm filter to ensure sterility. This solution was aliquoted and escalating doses of rat recombinant VEGF164 (R&D Systems, 564-RV/CF) were added to the aliquots such that the final solutions were at concentrations between 0 and 20 μg/ml of VEGF, with the 0 μg/ml solution used as a control solution. Osmotic pumps (ALZET pumps, DURECT Corp.) were filled according to instructions (ALZET 2001 for 1 μl/hr infusion and ALZET 1007D for 0.5 μl/hr infusion) with solution (VEGF or control). MRI-safe flow moderators (part no. 0002496, PlasticsOne) replaced the flow moderators that arrived with the ALZET pumps. MRI-safe brain infusion cannulas (part no. 3280PM/PK/SPC cut to 5 mm, PlasticsOne) were attached to 40 mm of polyethylene tubing and sealed with cyanoacrylate adhesive and attached to the flow moderator.
Infusion
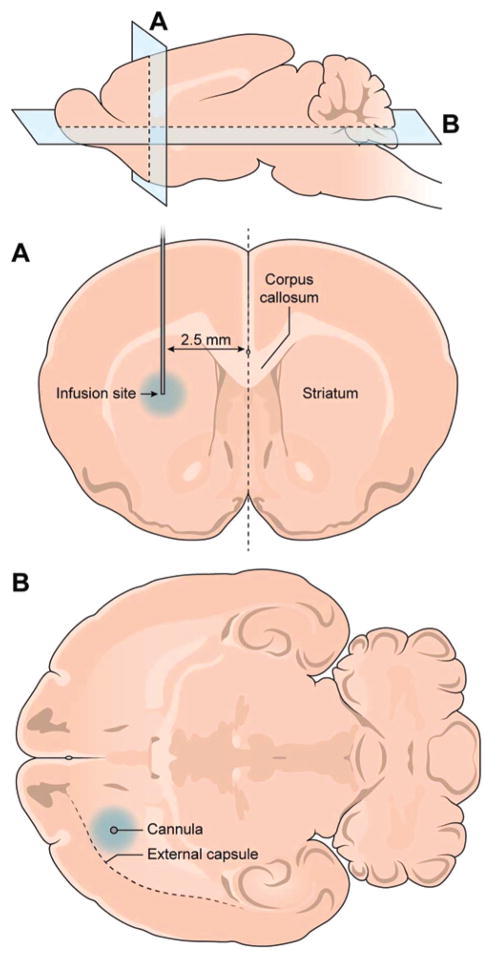
Following anesthetic induction (5% isoflurane), the rats were transferred to a small animal stereotactic frame (model 900, Kopf Instruments).28 Two incisions were made following shaving and antiseptic application: a scalp incision and a subcutaneous incision between the scapulae. Using the stereotactic device, the primed infusion cannula described above was loaded and measured, and inserted 2.5 mm to the right of and 1 mm anterior to bregma (Fig. 1) following drilling of the bur hole. The osmotic pump was placed in the subcutaneous neck incision. Ultraviolet-activated dental cement and additional nylon screws were used to secure brain infusion cannulas in place. Incisions were then closed with 4–0 braided vicryl sutures and cleaned with hydrogen peroxide. Initially, the effect of a single dose of VEGF (100 ng), and the effect of continuous infusion of PBS and VEGF (2, 10, and 20 μg/ml) via osmotic pump (1 μl/hr) was tested. This resulted in a VEGF dose of 0, 2, 10, and 20 ng/hr in the infused animals. We have previously observed that low-flow preinfusion with phosphate-buffered saline (PBS) for 4–6 days allows for resolution of brain inflammation arising from surgical trauma due to cannula implantation. Low-flow PBS also prevents cannula occlusion from inflammatory infiltrate and astrocytosis at the cannula insertion site (unpublished data). Animals receiving a preinfusion underwent the same procedure with a 0.5-μl/hr pump filled with PBS for 4–6 days, which was switched out for a 1-μl/hr pump filled with a VEGF (2 μg/ml) or control RSA solution, resulting in an effective dose of 2 ng/hr VEGF infusion.
Fig. 1.
Placement of the infusion cannula. Infusion cannulas were inserted stereotactically 1 mm anterior to the bregma and 2.5 mm lateral to the midline. The striatum was targeted for infusion. Edema was noted within striatum and the external capsule regions with VEGF infusions.
MRI Acquisition
All MRI experiments were performed on a 9.4-T (Bruker Avance), 30-cm horizontal scanner. The rats were anesthetized with 1.5% isoflurane and placed in a stereotactic holder consisting of an 8-element surface-array receive coil tailored for rat brain MRI. This device was then mounted in an 85-mm volume (transmit) coil. The body core temperature was maintained at 37°C using a circulating water pad and monitored by means of a rectal temperature probe. A pressure transducer was placed under the rat and the resultant respiratory signal was monitored during the experiment. A line through the tail vein was placed for infusion of the contrasting agent. Mutually perpendicular and in-line slices (1 coronal, 1 sagittal, and 5 axial) were acquired through the brain as scout images. Axial T2-weighted MRI slices, encompassing the whole brain, were acquired using a fast spin-echo (FSE) sequence to delineate anatomical details (in-plane resolution = 167 μm, TE/TR = 24/3000 msec, echo train length = 8, number of averages = 8, slice thickness = 1 mm [10 slices]). In some animals this FSE sequence was repeated in the coronal plane with 5 slices centered about the cannula. Quantitative T2-weighted images, with identical slices (10 axial and 5 coronal) to the FSE sequences above (TE/TR = 15/3000 msec, number of echo images = 12, inplane resolution = 167 μm), were also acquired.
T1-weighted images (in-plane resolution = 125 μm, TE/TR = 5/1700 msec, number of averages = 8, number of segments = 8, slice thickness = 0.5 mm [10 coronal and 20 axial]) in the coronal and axial planes, encompassing the cannula site, were acquired using a modified driven equilibrium Fourier transform sequence before, and 10 minutes after, the administration of Gd DTPA (0.2 mmol/kg).
Evans Blue Dye Administration
After final imaging, 0.2% Evans blue dye solution at 1 ml/kg was administered intravenously and allowed to circulate for 20 minutes before the animal was killed. Upon brain tissue procurement, a gross sectioning of the brain was performed to determine the status of the BBB.
Tissue Processing and Histological Preparation
After the animal was killed, brain tissue was isolated and frozen in isopentane at −78.5°C. H & E staining was performed on slides of 10 μm of tissue. For analysis of FITC-labeled albumin, tissue was fixed for 20 minutes in ethanol and DAPI was added to stain for nuclei. Immunohistochemical analysis (performed on the Leica Bond Max automated stainer) and immunofluorescence (performed manually) was completed using antibodies for glial fibrillary acidic protein (GFAP; Genetex GTX108711, 13.3 μg/ml) to detect reactive astrocytosis44 in the presence of VBE. Aquaporin-4 (AQP4, Millipore 3594, 1.2 μg/ml) has been shown to be highly expressed in astrocytes in the presence of VBE.41,56 CD 105 (R&D, AF6440, 1 μg/ml) and laminin (Genetex, GTX23099, 4 μg/ml) antibodies were used to detect vascular remodeling in the presence of VEGF.12,34 Claudin-5 (Lifespan Biosciences, LS-B11331, 10 μg/ml) was probed because its disruption is critical in VEGF-mediated disruption of the BBB.1
Data Analysis
MRI data were processed and analyzed using software routines written in MATLAB (Mathworks, Inc.). The T2-weighted data were fitted to a single exponential to obtain T2 maps that yielded the local T2 values for each pixel. The pre– and post–T1-weighted image intensities were used to calculate the normalized signal intensity variation before and after Gd infusion. Due to variabilities in gains in T1 image intensities, normalized signal intensities were calculated as percentage variation expressed as: [(postcontrast intensity – precontrast intensity)/postcontrast intensity] × 100. Region of interests (ROIs; 5–10 pixels) were specified in each calculated map in different anatomical regions around the cannula site and on the contralateral side. The values generated were tabulated and evaluated. A connected interval threshold analysis in image analysis software (Osirix, Pixmeo Sarl), was applied to calculate the volumes of T2 and T1 enhancement on the DICOM coded images.8,42 PRISM (GraphPad Software, Inc.) was used for descriptive statistical analysis and presentation.
Results
VEGF Dose and Saline Preinfusion
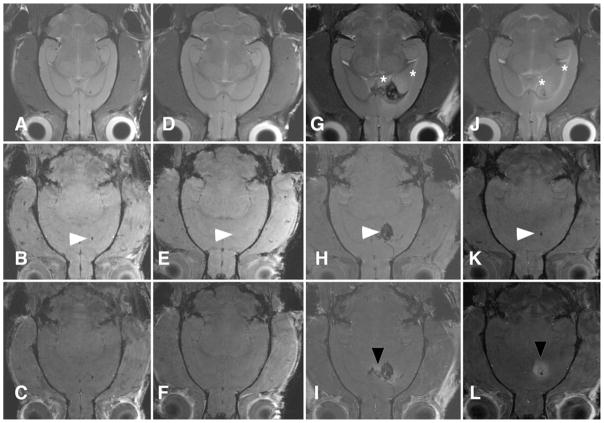
Control animals infused with RSA solution and VEGF animals infused with 2 ng/hr experienced no neurological deficits, seizure activity, or abnormal behavior. Rats receiving doses of VEGF at 10–20 ng/hr showed signs of neurological decline (somnolence, circling behavior, and hyperpnea) within 72 hours of initiation of infusion and were subsequently killed. Edema with significant midline shift and/or intracerebral hemorrhage near the infusion site was confirmed on MRI in 50% of these animals (Fig. 2). A single dose of VEGF failed to create MRI-detectable edema at early (72 hours) or later time points (Fig. 3). VEGF infusion at 2 ng/hr created reproducible effects with the lowest risk of complications.
Fig. 2.
High-dose VEGF infusion causes IPHs. These axial T2-weighted MR images of animals receiving high-dose VEGF infusion (> 10 μg/ml) revealed severe edema extending along the external capsule (asterisk, A and B), and midline shift (B). A high incidence of IPH with local mass effect (arrowheads) in the juxtacanalicular region was also observed (C). The direction of cannula insertion is indicated by the arrow.
Fig. 3.
Preinfusion followed by VEGF infusion creates edema without confounding features of early surgical trauma. Representative coronal brain MR images of animals receiving control solution (A–C), a single 100-ng VEGF injection (D–F), 2 ng/hr of VEGF without preinfusion (G–I), and 2 ng/hr of VEGF following preinfusion with PBS (J–L). The upper row (A, D, G, and J) contains T2-weighted images, the middle row (B, E, H, and K) contains T1-weighted images, and the lower row (C, F, I, and L) contains T1-weighted postcontrast images. The injection or infusion site is marked by arrowheads. Neither the control infusion nor a single injection of VEGF resulted in edema (A and D) or BBB breakdown (C and F). Rats with no preinfusion demonstrated both edema (asterisks, G) and hemorrhage (arrowhead, H) and BBB breakdown (arrowhead, I). The presence of hemorrhage and surgical trauma significantly distorted normal brain structures. Preinfusion allowed for resolution of initial surgical trauma resulting in clearly demonstrated edema (asterisks, J) and BBB breakdown (arrowhead, L). All images were obtained at 144 hours.
Early studies revealed a significant increase in the incidence of intraparenchymal hemorrhage (IPH) associated with VEGF infusions at 10 ng/hr (70%) and 20 ng/hr (100%). Significant IPHs and signs of rapid neurological decline prevented acquisition of usable MRI data in these rats. Therefore, MRI data were analyzed from control animals and the ones receiving low-dose VEGF (2 ng/hr). Of these, MRI data were usable for T2 map generation in all the animals that underwent control (n = 65) and 2 ng/hr VEGF (n = 88) infusions. ROI selection for T1 enhancement analysis was affected by juxtacanalicular artifacts from surgical trauma and variability in T1 signal gain. Therefore, usable data for normalized T1 intensity was generated from 52 control and 45 animals with 2 ng/hr VEGF infusion (Table 1). Representative animals (n = 15) were then used to analyze the volumes of T2 and T1 enhancement. The rest of this paper contains results from animals receiving 2 ng/hr of VEGF (low-dose) only.
TABLE 1.
Experimental design for the current study
| Group | No Preinfusion | IPH | Preinfused | Experimental Phase* | ||||
|---|---|---|---|---|---|---|---|---|
| IPH | Total | T2 Map | T1 Enhancement | T1/T2 Volume | ||||
| Controls | 57 | 4 | 8 | 0 | 65 | 65 | 52 | 15 |
| VEGF (ng/hr) | ||||||||
| Low-dose (2) | 80 | 5 | 8 | 0 | 88 | 88 | 45 | 15 |
| Medium-dose (10) | 23 | 16 | 4 | 0 | 27 | — | — | — |
| High-dose (20) | 2 | 2 | 0 | 0 | 2 | — | — | — |
| Single injection (100 ng) | 3 | 0 | — | — | — | — | — | — |
MRI data was analyzed from images obtained from animal numbers listed in the 3 columns on the right.
Surgical trauma contributed to juxtacanalicular edema formation in animals (controls and VEGF treated) that were not preinfused with saline. In these animals, juxtacanalicular T2 hyperintensity was visible up to 72 hours following surgical implantation of the catheter and initiation of infusion (Fig. 3). Preinfusing with low-flow infusion (0.5 μl/hr PBS) for 4–6 days prior to formal experimental (and control) infusion allowed for resolution of surgical trauma and inflammation prior to data acquisition.
Brain Edema
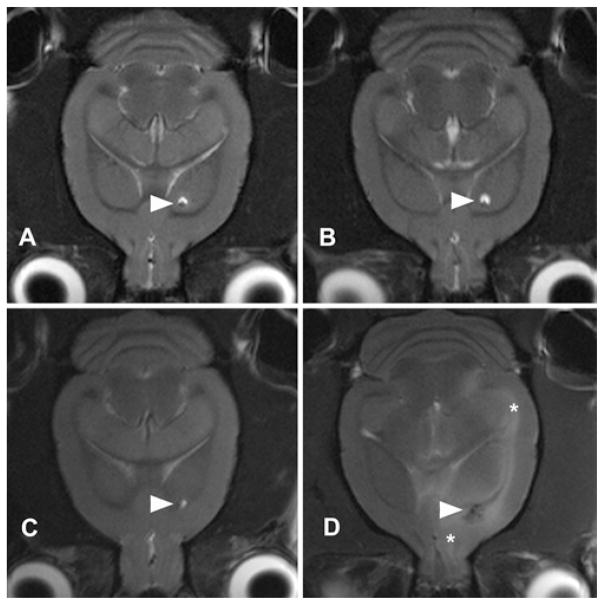
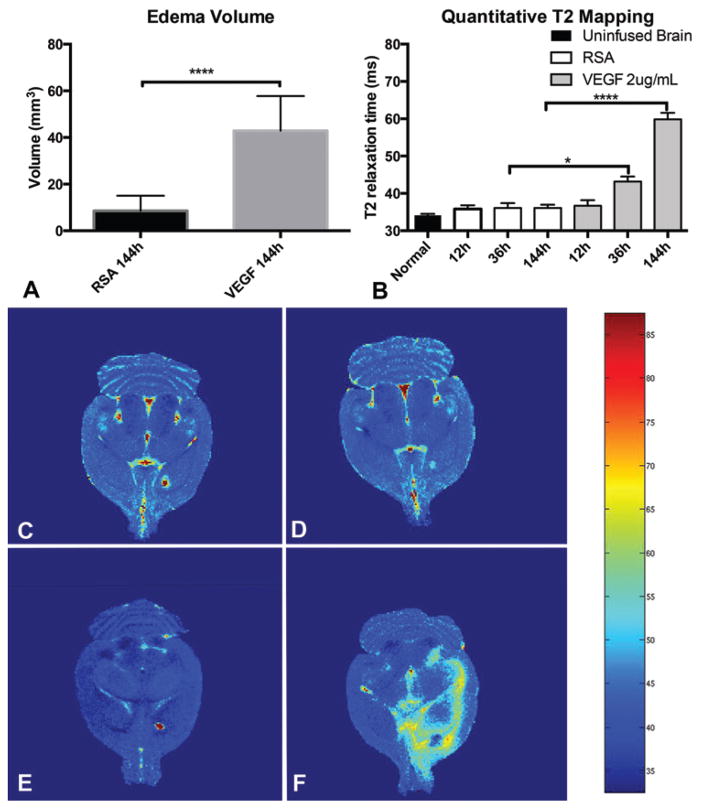
Vasogenic edema was determined by detecting regions of T2 hyperattenuation27 in animals following initiation of experimental infusion by serial MRI. T2 hyperattenuation was visible in both VEGF and control animals as early as 12 hours of infusion, but was most prominent at 144 hours (Fig. 4). Animals treated with VEGF demonstrated a significantly larger volume (42.90 ± 3.842 mm3) of T2 hyperattenuation at 144 hours when compared with the volume (8.585 ± 1.664 mm3) in control animals (mean difference 34.31 ± 4.187 mm3, p < 0.0001, 95% confidence interval [CI] 25.74–42.89 mm3).
Fig. 4.
Progression of edema formation on T2-weighted axial MRI. Sequential T2-weighted imaging of animals receiving control (A and B) infusion revealed a lack of edema formation at 12 hours (A) or 144 hours (B) near the cannula site (arrowheads). In animals receiving VEGF infusion, an early lack of edema (C) was followed by juxtacanalicular edema, and edema along the external capsule (asterisks) in late (i.e., 144 hours) images (D).
Quantitative T2 maps of entire rodent brains (Fig. 5) were acquired with 12 increasing echo times, and confirmed that local T2 values were significantly elevated in animals receiving VEGF infusions (ANOVA, F ratio = 360.4, p < 0.0001). There were no differences in T2 values in juxtacanalicular regions between uninfused brain (34.16 ± 3.217 msec) and RSA infusion sites at 12, 36, or 144 hours (range 35.81–36.10 msec). There was no statistical difference between juxtacanalicular local T2 values at 12 hours between the RSA and the VEGF groups (mean difference = 0.863 msec, 95% CI −2.161 to 3.888 msec). Significant increases in local T2 values were noted with VEGF infusion at both 36 hours (mean difference = 7.085 msec, 95% CI 0.9103–13.26 msec) and 144 hours (mean difference = 23.78 msec, 95% CI 21.45–26.10 msec).
Fig. 5.
VEGF infusion results in increased volume and intensity of the T2-weighted signal. Three-dimensional segmentation analysis reveals a significantly increased region of T2 hyperintensity at 144 hours with VEGF infusion (A). Quantitative analysis of the T2 signal in the juxtacanalicular regions revealed a significant increase in the T2 signal due to VEGF infusion at 36 hours and beyond (B). Graphic demonstration of quantitative T2 mapping as a heat map reveals the extent of T2 hyperintensity. Early imaging at 12 hours with control (C) or VEGF (E) infusion and late (144-hour) imaging with control infusion (D) did not reveal an increased T2 signal. Edema within the striatum, white matter, and subcortical structures (F) with VEGF infusion at 144 hours is shown. *p < 0.05, ****p < 00001.
Disruption of the BB
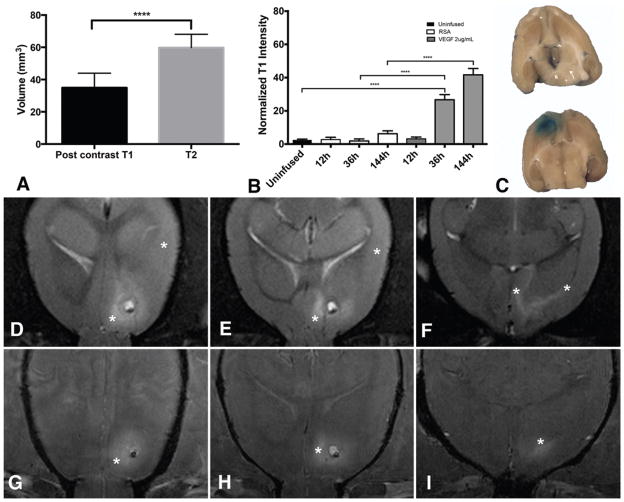
Postcontrast T1 enhancement in the juxtacanalicular region indicating BBB breakdown was observed in rats undergoing infusion with VEGF. The enhancement was not noted reliably in early (24–48-hr) phases following VEGF infusion. At the later time periods (6–7 days) the volume of T1 enhancement (34.97 ± 8.99 mm3) was significantly less compared with the region of edema (p < 0.0001). In addition, the BBB breakdown was observed only in the juxtacanalicular region (Fig. 6). Normalized T1 values within juxtacanalicular brain were elevated with VEGF infusion indicating breakdown of the BBB (ANOVA, F ratio = 365.3, p < 0.0001). There was no significant increase in normalized T1 values at early time points (12 hours) with either RSA (2.77% ± 4.32%) or VEGF (3.2% ± 4.56%) infusion when compared with uninfused brain (2.5% ± 4.45%) contralateral to the cannula. At 36 hours following initiation of infusion, there continued to be no increase in normalized T1 values with RSA (1.89% ± 4.12%) when compared with uninfused brain, but a significant increase (mean difference = 24.17%, 95% CI 21.2%–27.15%) was noted with VEGF infusion (26.67% ± 9.69%). There was a slight but significant increase in normalized T1 values with RSA infusion at 144 hours (mean difference = 3.76%, 95% CI 1.1%–6.41%). An impressive increase in normalized T1 values was observed in juxtacanalicular regions 36 hours and later. At 12 hours, no difference in T1 values was observed between RSA- and VEGF-infused brain (mean difference = 0.44%, 95% CI −3.03% to 3.9%). Terminal Evans blue infusion confirmed that BBB breakdown in animals receiving VEGF was limited to the juxtacanalicular region (Fig. 6), and that there was no BBB breakdown in animals receiving control infusion.
Fig. 6.
Volume of BBB breakdown is less than vasogenic edema. The volume of postcontrast T1 hyperintensity is significantly lower than the volume of T2 hyperintensity at 144 hours (A). Normalized T1 values in the juxtacanalicular region are elevated at 36 hours and beyond with VEGF infusion (B). Terminal Evans blue infusion (C) confirmed that the region of BBB breakdown was limited to the juxtacanalicular region in animals receiving VEGF (lower). Evans blue infusion (C) in animals receiving control solution (upper) did not reveal BBB breakdown. Note the expected coloration in choroid plexus bilaterally. Representative axial MR images from 1 animal demonstrate that the vasogenic edema (asterisks) on T2-weighted images extends beyond the juxtacanalicular regions (D–F). Postcontrast T1 enhancement (asterisks) in the same animal is limited to the juxtacanalicular region (G–I). ****p < 00001. Figure is available in color online only.
Histological Analysis
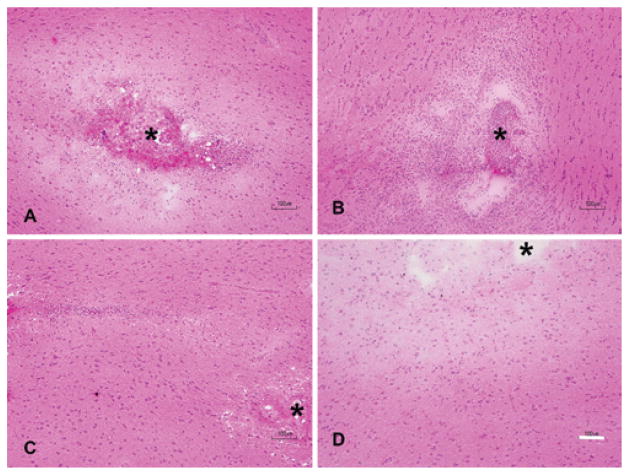
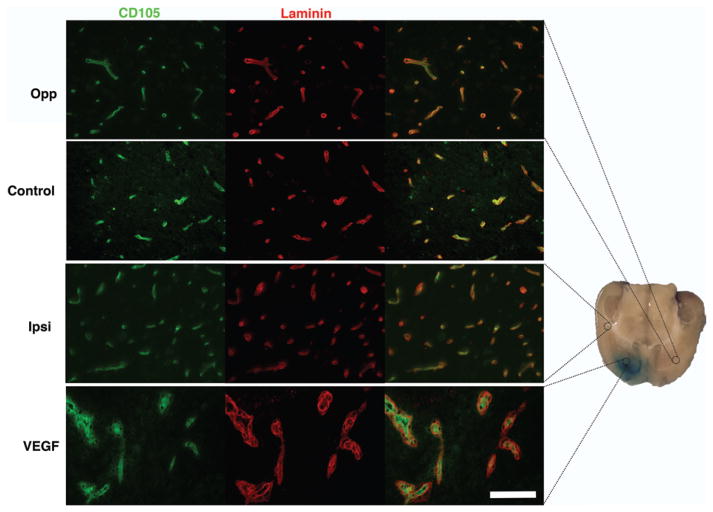
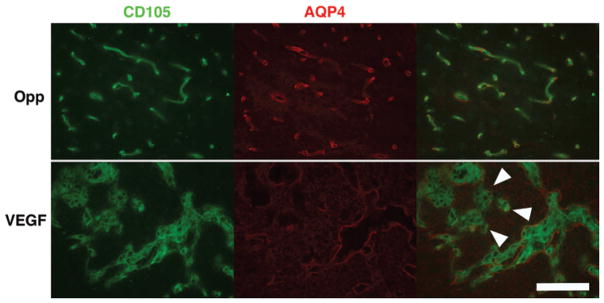
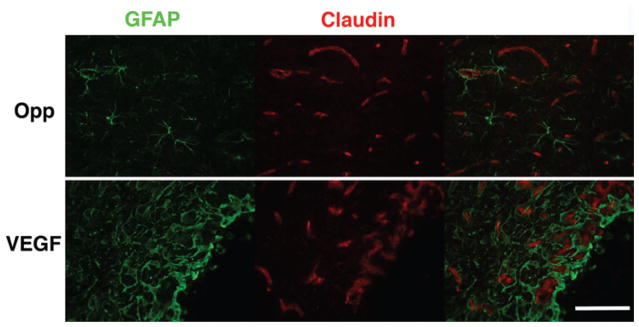
H & E staining demonstrated local vacuolation and astrocyte activation as well as mild inflammatory infiltrate in animals that were not primed with PBS (Fig. 7). These changes and juxtacanalicular interstitial edema were observed with both control and VEGF infusions. In animals that received 5–7-day priming infusion with PBS, subsidence of inflammation was noted in control animals. In animals receiving VEGF, an impressive amount of juxtacanalicular neuropil separation and a lack of inflammation were noted (Fig. 7). There was no evidence of tissue necrosis in either the control or VEGF group. As expected, VEGF resulted in vascular remodeling41 with increased expression of CD105 and laminin in juxtacanalicular regions. Sparse, punctate endothelial localization of CD105 within laminin sheaths was observed in uninfused brain, with control infusion, and in regions of VBE without BBB breakdown. Hypertrophic, disordered laminin sheaths encasing endothelial cells overexpressing CD105 was noted in the juxtacanalicular regions with VEGF infusion, indicating robust vascular remodeling within regions demonstrating BBB breakdown by MRI and Evans blue infusion (Fig. 8). These observations suggest that robust vascular remodeling associated with BBB breakdown is limited to the juxtacanalicular regions. In addition, the remodeled blood vessels in the juxtacanalicular region demonstrated deficiencies in AQP4 coverage, likely leading to BBB breakdown. AQP4 was localized to cell membranes organized in orderly sheaths enclosing endothelial cells in uninfused brain (Fig. 9), and with control infusion. Incomplete AQP4 coverage of newly formed blood vessels in the juxtacanalicular region was evident with VEGF infusion (Fig. 9). These findings indicate that VEGF results in increased AQP4 expression but deficient AQP4 sheath formation in the juxtacanalicular regions. Endothelial integrity was additionally probed with claudin-5 (Fig. 10). With a single injection of VEGF, there is prolonged reduced expression of claudin-5 in the brain.1 But, with chronic infusion of VEGF (> 24 hours), we detected a robust cytoplasmic expression of claudin-5 along with astrocyte activation within regions of vascular remodeling, as has been reported earlier.22 Taken together, these findings suggest that chronic VEGF infusion leads to robust vascular remodeling with inadequate BBB formation in the juxtacanalicular regions. More distant regions with VBE did not demonstrate any obvious signs of BBB breakdown or vascular remodeling, suggesting that bulk flow of interstitial fluid4,35 from regions of BBB breakdown may be responsible for VBE formation due to VEGF.
Fig. 7.
VEGF infusion causes interstitial edema without necrosis or inflammation. H & E preparations of the cannula site revealed significant local hypercellularity, inflammation, and edema with both control (A) and VEGF (B) infusions started immediately upon cannula insertion (cannula site denoted by asterisk). In animals that were preinfused with normal saline, edema and inflammation subsided in control animals (C). In animals infused with VEGF following priming (D), interstitial edema was noted, which was marked by a distinct lack of inflammatory infiltrate or necrosis. Bar = 100 μm. Figure is available in color online only.
Fig. 8.
VEGF infusion leads to vascular remodeling in the juxtacanalicular region. Increased intensity of CD105 signal (FITC) and laminin formation (Texas red) is demonstrated in addition to increased cellularity in the juxtacanalicular region with VEGF infusion (bottom row) when compared with control infusion (Control) or uninfused brain (Opp). Regions with vasogenic edema ipsilateral to VEGF infusion (Ipsi) did not demonstrate intense vascular remodeling. Bar = 100 μm.
Fig. 9.
VEGF leads to deranged neovascularization. Although AQP4 overexpression is noted in juxtacanalicular regions with VEGF infusion, inadequate coverage (arrowheads) of newly formed endothelial tubes (CD105 [FITC]) is observed (lower row). In uninfused brain (upper row), AQP4 tubes (Texas red) are closely aligned with endothelial tubes (CD105 [FITC]) demonstrated by colocalization on the merged image. Bar = 100 μm.
Fig. 10.
Chronic VEGF infusion does not lead to a reduction in claudin-5 expression in the juxtacanalicular region. Claudin-5 expression was not reduced in the juxtacanalicular region with VEGF infusion unlike as reported in previous studies with a single-dose VEGF injection. Robust cytoplasmic claudin expression was noted in regions of neovascularization. In uninfused brain (Opp), claudin-5 was localized to a membranous pattern as expected. Bar = 100 μm.
Discussion
Existing Models of VBE
PTBE associated with brain tumors is predominantly a result of VEGF secreted by brain tumors.3,37,39 If left untreated, PTBE causes swelling and increased intracranial pressure, which leads to neurological deficits, herniation, and ultimately death. An accurate model of VBE would allow for the study of the molecular mechanisms underlying vasogenic edema formation, the effects of glucocorticoids, and potentially reveal novel targets for its treatment. Unlike PTBE, the most commonly used model of VBE (e.g., cold injury model) is associated with significant necrosis and inflammation.21,33 Unlike in PTBE, VEGF in the cold injury model appears to be released by injured and reactive astrocytes.31,44 In addition, other local factors including MMP-9 are released due to the effects of endothelins on injured astrocytes.31 These biochemical features, as well as the histological similarity to brain contusions, make the cold injury model a better simulation of traumatic brain injury than PTBE.33 Other strategies to induce vasogenic or interstitial brain edema including direct cerebral fluid perfusion, 13 intracerebral hemolysate injection,29 or intracerebral lysolecithin injection55 are mechanistically and temporally significantly different from PTBE. In this report, we demonstrate that an accurate model of VBE similar to PTBE can be created by chronic infusion of VEGF into rat striata via a stereotactically placed cannula. Similar to PTBE, the current model of VBE is characterized by a distinct lack of necrosis, and by the presence of interstitial edema. MRI revealed an extension of edema along the white matter tracts, as is expected in PTBE.20
The current model utilizes miniosmotic pumps for chronic delivery of VEGF to induce VBE in a refinement of a technique originally devised to study the effect of VEGF on BBB breakdown.37 Similar to our model, the previous model of chronic VEGF infusion found minimal inflammation and necrosis. Unlike the previous studies that involved termination of the experiment to demonstrate cellular/molecular changes, we demonstrate a model that allows investigation of temporal evolution of VBE in vivo with serial high-field MRI. We believe that this model represents an accurate representation of VBE with chronic exposure to VEGF.
Serial In-Vivo Imaging With High-Field MRI
Serial MRI is essential to understanding the evolution of VBE formation. In-vivo imaging allows for demonstration of brain events that are not captured or demonstrated by terminal histopathological examination.9 Increasingly, serial imaging has been adopted to understand the mechanisms of brain edema formation and BBB breakdown. 26,36,55,60 In VBE induced by lysolecithin, serial MRI demonstrated the trend of edema formation and resolution. When combined with histopathological examination, the authors inferred that increased AQP4 expression may be helpful with resolution of VBE.55 Serial imaging also allows for investigation of novel agents and their effects on BBB breakdown.36,51 The cold injury model induces an unpredictable amount of BBB breakdown and subsequent edema;26 therefore, we were interested in creating a reliable model that could be imaged serially to determine the evolution of BBB breakdown (T1 enhancement) and VBE (T2 hyperintensity). The current model distinctly demonstrates that both BBB breakdown and VBE appear at later than 12 hours with chronic VEGF exposure. Additionally, although there is an impressive increase in the region of VBE following continued VEGF infusion up to 144 hours, the region of BBB breakdown is limited to the juxtacanalicular region (Fig. 6). These findings suggest that VEGF induces BBB breakdown and VBE that is temporally but not geographically linked. These findings in the current model replicate the findings in patients with malignant brain tumors in which the volume of BBB breakdown is smaller than the volume of T2 hyperintesity.59
Chronic Intracerebral VEGF Infusion
Chronic VEGF infusion by miniosmotic pump was successfully used to demonstrate BBB breakdown without significant inflammation in the juxtacanalicular region. 37 In the current model, we demonstrate that chronic VEGF infusion reliably results in VBE in the ipsilateral hemisphere. Both the local T2 values and the volume of T2 hyperintensity were significantly elevated with chronic VEGF infusion (Fig. 5). Exposure to VEGF results in a pleiotropic response in brain.50 There is evidence that the duration of VEGF exposure may result in different responses; for example, claudin-5 expression62 in endothelial cells is increased with chronic exposures (> 24 hours) when compared with a single dose exposure.1 In the current model of chronic exposure to VEGF, we have found a similar increase in claudin-5 expression in cytoplasmic location in the juxtacanalicular region (Fig. 10). We believe that cytoplasmic claudin-5 expression indicates vascular remodeling,25 and that the cytoplasmic location prevents formation of an effective BBB in these vessels. Single-dose intracerebral injection of VEGF leads to astrocyte induction (GFAP overexpression) and AQP4 overexpression in perivascular regions and within astrocyte cytoplasm.41,54,61 In the current model, we confirm these findings by demonstrating GFAP overexpression (Fig. 10). VEGF also leads to neovascularization or vascular remodeling in brain.40,41,61 In the current model, we found that there was a robust vascular remodeling with increased endothelial cell CD105 expression, and laminin formation in the juxtacanalicular region (Fig. 8), but no remodeling in ipsilateral brain (from the edematous brain region) or in the contralateral brain regions. In the juxtacanalicular region, we also found evidence of an incomplete AQP4 sheath surrounding the blood vessels (Fig. 9). These findings provide insight into the mechanisms of BBB breakdown, and VBE formation with VEGF infusion, and are similar to the ones found in tumoral/peritumoral regions in the clinical literature.34
Utility of the Chronic VEGF Infusion Model
The peritumoral region is a heterogeneous, non-MRI contrast-enhancing region with significant VBE.23,24 An accurate model of VBE that simulates PTBE will allow investigators to understand the precise mechanisms of vasogenic edema formation in the peritumoral brain region. For example, the role of AQP4 in the formation and resolution of VBE remains incompletely understood.2,5 We hope to use the precise temporal and dose control of VEGF delivery in the current model to help discern the role of AQP4 in VBE. The current model may also be used to investigate the mechanisms of action of glucocorticoids in reducing PTBE. Glucocorticoids appear to affect both endothelial function in the brain/tumor14,15 as well as tumor viability12 and VEGF production.18 The current model may prove useful in determining the role of glucocorticoids in reestablishing endothelial integrity without the confounding effects on tumor behavior. Lastly, the current model may be used to study the distribution of infusate with convection-enhanced delivery of antitumor drugs in the setting of VBE.49 The lack of clinical efficacy of drugs delivered by convection-enhanced delivery may be due to an inability to predict the distribution of infusate in light of PTBE.46 Previous work with computer simulation and the cold injury model have suggested significant differences in the infusate distribution in the setting of brain edema.4,16 The current model will allow for an investigation of precise MR-imaged distribution of drug infusate8 in the setting of VBE, and allow precise determination of drug quantitation from brain slices32 with and without VBE.
Conclusions
We report that chronic brain infusion of VEGF creates a reliable model of VBE. This model lacks necrosis and inflammation that are characteristic of previous models of VBE. The model allows for a precise investigation into the mechanism of VBE formation (such as the role of AQP4 and claudin-5). We also anticipate that this model will allow for investigation into the mechanism of glucocorticoid action in abrogating VBE, and to test novel therapeutic strategies targeting PTBE.
Acknowledgments
We would like to thank Martin Proescholdt, MD, for providing insights into study design and significance. This study was funded by the intramural research program of the National Institute of Neurological Disorders and Stroke at the NIH. This research was also made possible through the NIH Medical Research Scholars Program, a public-private partnership supported jointly by the NIH and generous contributions to the Foundation for the NIH.
Abbreviations
- AQP4
aquaporin-4
- BBB
blood-brain barrier
- CI
confidence interval
- FITC
fluorescein isothiocyanate
- FSE
fast spin-echo
- GFAP
glial fibrillary acidic protein
- IPH
intraparenchymal hemorrhage
- PBS
phosphate-buffered saline
- PTBE
peritumoral brain edema
- ROI
region of interest
- RSA
rat serum albumin
- VBE
vasogenic brain edema
- VEGF
vascular endothelial growth factor
Footnotes
Disclosures
The authors report no conflict of interest concerning the materials or methods used in this study or the findings specified in this paper.
Author Contributions
Conception and design: Chittiboina, Montgomery, Merrill. Acquisition of data: Piazza, Munasinghe, Murayi, Edwards, Walbridge. Analysis and interpretation of data: Chittiboina, Piazza, Munasinghe, Murayi, Edwards, Walbridge, Merrill. Drafting the article: Chittiboina, Piazza. Critically revising the article: Chittiboina, Merrill. Reviewed submitted version of manuscript: Chittiboina, Piazza, Munasinghe, Edwards, Walbridge. Approved the final version of the manuscript on behalf of all authors: Chittiboina. Statistical analysis: Chittiboina. Administrative/technical/material support: Walbridge. Study supervision: Chittiboina, Merrill.
References
- 1.Argaw AT, Gurfein BT, Zhang Y, Zameer A, John GR. VEGF-mediated disruption of endothelial CLN-5 promotes blood-brain barrier breakdown. Proc Natl Acad Sci U S A. 2009;106:1977–1982. doi: 10.1073/pnas.0808698106. [DOI] [PMC free article] [PubMed] [Google Scholar]
- 2.Badaut J, Fukuda AM, Jullienne A, Petry KG. Aquaporin and brain diseases. Biochim Biophys Acta. 2014;1840:1554–1565. doi: 10.1016/j.bbagen.2013.10.032. [DOI] [PMC free article] [PubMed] [Google Scholar]
- 3.Berkman RA, Merrill MJ, Reinhold WC, Monacci WT, Saxena A, Clark WC, et al. Expression of the vascular permeability factor/vascular endothelial growth factor gene in central nervous system neoplasms. J Clin Invest. 1993;91:153–159. doi: 10.1172/JCI116165. [DOI] [PMC free article] [PubMed] [Google Scholar]
- 4.Blaumanis OR, Rennels ML, Grady PA. Focal cerebral edema impedes convective fluid/tracer movement through paravascular pathways in cat brain. Adv Neurol. 1990;52:385–389. [PubMed] [Google Scholar]
- 5.Bloch O, Manley GT. The role of aquaporin-4 in cerebral water transport and edema. Neurosurg Focus. 2007;22(5):E3. doi: 10.3171/foc.2007.22.5.4. [DOI] [PubMed] [Google Scholar]
- 6.Bosoi CR, Rose CF. Brain edema in acute liver failure and chronic liver disease: similarities and differences. Neurochem Int. 2013;62:446–457. doi: 10.1016/j.neuint.2013.01.015. [DOI] [PubMed] [Google Scholar]
- 7.Cengiz K, Goksu E, Cengiz A, Ozsoy O, Tan R, Demir N, et al. The efficacy of amifostine on pathophysiological changes in vasogenic brain edema induced by an experimental cold injury model. Turk Neurosurg. 2015;25:43–52. doi: 10.5137/1019-5149.JTN.9293-13.0. [DOI] [PubMed] [Google Scholar]
- 8.Chittiboina P, Heiss JD, Warren KE, Lonser RR. Magnetic resonance imaging properties of convective delivery in diffuse intrinsic pontine gliomas. J Neurosurg Pediatr. 2014;13:276–282. doi: 10.3171/2013.11.PEDS136. [DOI] [PMC free article] [PubMed] [Google Scholar]
- 9.Del Bigio MR, Yan HJ, Kozlowski P, Sutherland GR, Peeling J. Serial magnetic resonance imaging of rat brain after induction of renal hypertension. Stroke. 1999;30:2440–2447. doi: 10.1161/01.str.30.11.2440. [DOI] [PubMed] [Google Scholar]
- 10.Dietrich J, Rao K, Pastorino S, Kesari S. Corticosteroids in brain cancer patients: benefits and pitfalls. Expert Rev Clin Pharmacol. 2011;4:233–242. doi: 10.1586/ecp.11.1. [DOI] [PMC free article] [PubMed] [Google Scholar]
- 11.Essig M, Schlemmer HP, Tronnier V, Hawighorst H, Wirtz R, van Kaick G. Fluid-attenuated inversion-recovery MR imaging of gliomatosis cerebri. Eur Radiol. 2001;11:303–308. doi: 10.1007/s003300000587. [DOI] [PubMed] [Google Scholar]
- 12.Fan Z, Sehm T, Rauh M, Buchfelder M, Eyupoglu IY, Savaskan NE. Dexamethasone alleviates tumor-associated brain damage and angiogenesis. PLoS One. 2014;9:e93264. doi: 10.1371/journal.pone.0093264. [DOI] [PMC free article] [PubMed] [Google Scholar]
- 13.Fatouros PP, Inao S, Marmarou A, Kraft KA. In vivo characterization of infusion edema by magnetic resonance imaging. Adv Neurol. 1990;52:533–537. [PubMed] [Google Scholar]
- 14.Förster C, Burek M, Romero IA, Weksler B, Couraud PO, Drenckhahn D. Differential effects of hydrocortisone and TNFα on tight junction proteins in an in vitro model of the human blood-brain barrier. J Physiol. 2008;586:1937–1949. doi: 10.1113/jphysiol.2007.146852. [DOI] [PMC free article] [PubMed] [Google Scholar]
- 15.Förster C, Waschke J, Burek M, Leers J, Drenckhahn D. Glucocorticoid effects on mouse microvascular endothelial barrier permeability are brain specific. J Physiol. 2006;573:413–425. doi: 10.1113/jphysiol.2006.106385. [DOI] [PMC free article] [PubMed] [Google Scholar]
- 16.Haar PJ, Chen ZJ, Fatouros PP, Gillies GT, Corwin FD, Broaddus WC. Modelling convection-enhanced delivery in normal and oedematous brain. J Med Eng Technol. 2014;38:76–84. doi: 10.3109/03091902.2013.837532. [DOI] [PubMed] [Google Scholar]
- 17.Heiss JD, Papavassiliou E, Merrill MJ, Nieman L, Knightly JJ, Walbridge S, et al. Mechanism of dexamethasone suppression of brain tumor-associated vascular permeability in rats. Involvement of the glucocorticoid receptor and vascular permeability factor. J Clin Invest. 1996;98:1400–1408. doi: 10.1172/JCI118927. [DOI] [PMC free article] [PubMed] [Google Scholar]
- 18.Kim H, Lee JM, Park JS, Jo SA, Kim YO, Kim CW, et al. Dexamethasone coordinately regulates angiopoietin-1 and VEGF: a mechanism of glucocorticoid-induced stabilization of blood-brain barrier. Biochem Biophys Res Commun. 2008;372:243–248. doi: 10.1016/j.bbrc.2008.05.025. [DOI] [PubMed] [Google Scholar]
- 19.Kim JY, Lee YW, Kim JH, Lee WT, Park KA, Lee JE. Agmatine attenuates brain edema and apoptotic cell death after traumatic brain injury. J Korean Med Sci. 2015;30:943–952. doi: 10.3346/jkms.2015.30.7.943. [DOI] [PMC free article] [PubMed] [Google Scholar]
- 20.Klatzo I. Presidential address. Neuropathological aspects of brain edema. J Neuropathol Exp Neurol. 1967;26:1–14. doi: 10.1097/00005072-196701000-00001. [DOI] [PubMed] [Google Scholar]
- 21.Klatzo I, Chui E, Fujiwara K, Spatz M. Resolution of vasogenic brain edema. Adv Neurol. 1980;28:359–373. [PubMed] [Google Scholar]
- 22.Krum JM, Mani N, Rosenstein JM. Angiogenic and astroglial responses to vascular endothelial growth factor administration in adult rat brain. Neuroscience. 2002;110:589–604. doi: 10.1016/s0306-4522(01)00615-7. [DOI] [PubMed] [Google Scholar]
- 23.Lemée JM, Clavreul A, Aubry M, Com E, de Tayrac M, Eliat PA, et al. Characterizing the peritumoral brain zone in glioblastoma: a multidisciplinary analysis. J Neurooncol. 2015;122:53–61. doi: 10.1007/s11060-014-1695-8. [DOI] [PubMed] [Google Scholar]
- 24.Lemée JM, Clavreul A, Menei P. Intratumoral heterogeneity in glioblastoma: don’t forget the peritumoral brain zone. Neuro Oncol. 2015;17:1322–1332. doi: 10.1093/neuonc/nov119. [DOI] [PMC free article] [PubMed] [Google Scholar]
- 25.Li L, Welser-Alves J, van der Flier A, Boroujerdi A, Hynes RO, Milner R. An angiogenic role for the α5β1 integrin in promoting endothelial cell proliferation during cerebral hypoxia. Exp Neurol. 2012;237:46–54. doi: 10.1016/j.expneurol.2012.06.005. [DOI] [PMC free article] [PubMed] [Google Scholar]
- 26.Liu WY, Wang ZB, Wang Y, Tong LC, Li Y, Wei X, et al. Increasing the permeability of the blood-brain barrier in three different models in vivo. CNS Neurosci Ther. 2015;21:568–574. doi: 10.1111/cns.12405. [DOI] [PMC free article] [PubMed] [Google Scholar]
- 27.Loubinoux I, Volk A, Borredon J, Guirimand S, Tiffon B, Seylaz J, et al. Spreading of vasogenic edema and cytotoxic edema assessed by quantitative diffusion and T2 magnetic resonance imaging. Stroke. 1997;28:419–427. doi: 10.1161/01.str.28.2.419. [DOI] [PubMed] [Google Scholar]
- 28.Lukovic D, Moreno-Manzano V, Lopez-Mocholi E, Rodriguez-Jiménez FJ, Jendelova P, Sykova E, et al. Complete rat spinal cord transection as a faithful model of spinal cord injury for translational cell transplantation. Sci Rep. 2015;5:9640. doi: 10.1038/srep09640. [DOI] [PMC free article] [PubMed] [Google Scholar]
- 29.Matz PG, Lewén A, Chan PH. Neuronal, but not microglial, accumulation of extravasated serum proteins after intracerebral hemolysate exposure is accompanied by cytochrome c release and DNA fragmentation. J Cereb Blood Flow Metab. 2001;21:921–928. doi: 10.1097/00004647-200108000-00004. [DOI] [PubMed] [Google Scholar]
- 30.Michinaga S, Koyama Y. Pathogenesis of brain edema and investigation into anti-edema drugs. Int J Mol Sci. 2015;16:9949–9975. doi: 10.3390/ijms16059949. [DOI] [PMC free article] [PubMed] [Google Scholar]
- 31.Michinaga S, Seno N, Fuka M, Yamamoto Y, Minami S, Kimura A, et al. Improvement of cold injury-induced mouse brain edema by endothelin ETB antagonists is accompanied by decreases in matrixmetalloproteinase 9 and vascular endothelial growth factor-A. Eur J Neurosci. 2015;42:2356–2370. doi: 10.1111/ejn.13020. [DOI] [PubMed] [Google Scholar]
- 32.Murad GJ, Walbridge S, Morrison PF, Garmestani K, Degen JW, Brechbiel MW, et al. Real-time, image-guided, convection-enhanced delivery of interleukin 13 bound to pseudomonas exotoxin. Clin Cancer Res. 2006;12:3145–3151. doi: 10.1158/1078-0432.CCR-05-2583. [DOI] [PubMed] [Google Scholar]
- 33.Nag S. Cold-injury of the cerebral cortex: immunolocalization of cellular proteins and blood-brain barrier permeability studies. J Neuropathol Exp Neurol. 1996;55:880–888. doi: 10.1097/00005072-199608000-00003. [DOI] [PubMed] [Google Scholar]
- 34.Nduom EK, Yang C, Merrill MJ, Zhuang Z, Lonser RR. Characterization of the blood-brain barrier of metastatic and primary malignant neoplasms. J Neurosurg. 2013;119:427–433. doi: 10.3171/2013.3.JNS122226. [DOI] [PMC free article] [PubMed] [Google Scholar]
- 35.Ohata K, Marmarou A. Clearance of brain edema and macromolecules through the cortical extracellular space. J Neurosurg. 1992;77:387–396. doi: 10.3171/jns.1992.77.3.0387. [DOI] [PubMed] [Google Scholar]
- 36.Pishko GL, Muldoon LL, Pagel MA, Schwartz DL, Neuwelt EA. Vascular endothelial growth factor blockade alters magnetic resonance imaging biomarkers of vascular function and decreases barrier permeability in a rat model of lung cancer brain metastasis. Fluids Barriers CNS. 2015;12:5. doi: 10.1186/2045-8118-12-5. [DOI] [PMC free article] [PubMed] [Google Scholar]
- 37.Proescholdt MA, Heiss JD, Walbridge S, Mühlhauser J, Capogrossi MC, Oldfield EH, et al. Vascular endothelial growth factor (VEGF) modulates vascular permeability and inflammation in rat brain. J Neuropathol Exp Neurol. 1999;58:613–627. doi: 10.1097/00005072-199906000-00006. [DOI] [PubMed] [Google Scholar]
- 38.Radbruch A, Lutz K, Wiestler B, Bäumer P, Heiland S, Wick W, et al. Relevance of T2 signal changes in the assessment of progression of glioblastoma according to the Response Assessment in Neurooncology criteria. Neuro Oncol. 2012;14:222–229. doi: 10.1093/neuonc/nor200. [DOI] [PMC free article] [PubMed] [Google Scholar]
- 39.Reszec J, Hermanowicz A, Rutkowski R, Turek G, Mariak Z, Chyczewski L. Expression of MMP-9 and VEGF in meningiomas and their correlation with peritumoral brain edema. BioMed Res Int. 2015;2015:646853. doi: 10.1155/2015/646853. [DOI] [PMC free article] [PubMed] [Google Scholar]
- 40.Rite I, Machado A, Cano J, Venero JL. Blood-brain barrier disruption induces in vivo degeneration of nigral dopaminergic neurons. J Neurochem. 2007;101:1567–1582. doi: 10.1111/j.1471-4159.2007.04567.x. [DOI] [PubMed] [Google Scholar]
- 41.Rite I, Machado A, Cano J, Venero JL. Intracerebral VEGF injection highly upregulates AQP4 mRNA and protein in the perivascular space and glia limitans externa. Neurochem Int. 2008;52:897–903. doi: 10.1016/j.neuint.2007.10.004. [DOI] [PubMed] [Google Scholar]
- 42.Rosset A, Spadola L, Ratib O. OsiriX: an open-source software for navigating in multidimensional DICOM images. J Digit Imaging. 2004;17:205–216. doi: 10.1007/s10278-004-1014-6. [DOI] [PMC free article] [PubMed] [Google Scholar]
- 43.Roth P, Wick W, Weller M. Steroids in neurooncology: actions, indications, side-effects. Curr Opin Neurol. 2010;23:597–602. doi: 10.1097/WCO.0b013e32833e5a5d. [DOI] [PubMed] [Google Scholar]
- 44.Salhia B, Angelov L, Roncari L, Wu X, Shannon P, Guha A. Expression of vascular endothelial growth factor by reactive astrocytes and associated neoangiogenesis. Brain Res. 2000;883:87–97. doi: 10.1016/s0006-8993(00)02825-0. [DOI] [PubMed] [Google Scholar]
- 45.Salvador E, Shityakov S, Förster C. Glucocorticoids and endothelial cell barrier function. Cell Tissue Res. 2014;355:597–605. doi: 10.1007/s00441-013-1762-z. [DOI] [PMC free article] [PubMed] [Google Scholar]
- 46.Sampson JH, Archer G, Pedain C, Wembacher-Schröder E, Westphal M, Kunwar S, et al. Poor drug distribution as a possible explanation for the results of the PRECISE trial. J Neurosurg. 2010;113:301–309. doi: 10.3171/2009.11.JNS091052. [DOI] [PubMed] [Google Scholar]
- 47.Simard JM, Kent TA, Chen M, Tarasov KV, Gerzanich V. Brain oedema in focal ischaemia: molecular pathophysiology and theoretical implications. Lancet Neurol. 2007;6:258–268. doi: 10.1016/S1474-4422(07)70055-8. [DOI] [PMC free article] [PubMed] [Google Scholar]
- 48.Strugar J, Rothbart D, Harrington W, Criscuolo GR. Vascular permeability factor in brain metastases: correlation with vasogenic brain edema and tumor angiogenesis. J Neurosurg. 1994;81:560–566. doi: 10.3171/jns.1994.81.4.0560. [DOI] [PubMed] [Google Scholar]
- 49.Stummer W. Mechanisms of tumor-related brain edema. Neurosurg Focus. 2007;22(5):E8. doi: 10.3171/foc.2007.22.5.9. [DOI] [PubMed] [Google Scholar]
- 50.Sun FY, Guo X. Molecular and cellular mechanisms of neuroprotection by vascular endothelial growth factor. J Neurosci Res. 2005;79:180–184. doi: 10.1002/jnr.20321. [DOI] [PubMed] [Google Scholar]
- 51.Thompson EM, Pishko GL, Muldoon LL, Neuwelt EA. Inhibition of SUR1 decreases the vascular permeability of cerebral metastases. Neoplasia. 2013;15:535–543. doi: 10.1593/neo.13164. [DOI] [PMC free article] [PubMed] [Google Scholar]
- 52.Thrane AS, Rangroo Thrane V, Nedergaard M. Drowning stars: reassessing the role of astrocytes in brain edema. Trends Neurosci. 2014;37:620–628. doi: 10.1016/j.tins.2014.08.010. [DOI] [PMC free article] [PubMed] [Google Scholar]
- 53.Thurnher MM, Thurnher SA, Fleischmann D, Steuer A, Rieger A, Helbich T, et al. Comparison of T2-weighted and fluid-attenuated inversion-recovery fast spin-echo MR sequences in intracerebral AIDS-associated disease. AJNR Am J Neuroradiol. 1997;18:1601–1609. [PMC free article] [PubMed] [Google Scholar]
- 54.Tomás-Camardiel M, Venero JL, Herrera AJ, De Pablos RM, Pintor-Toro JA, Machado A, et al. Blood-brain barrier disruption highly induces aquaporin-4 mRNA and protein in perivascular and parenchymal astrocytes: protective effect by estradiol treatment in ovariectomized animals. J Neurosci Res. 2005;80:235–246. doi: 10.1002/jnr.20443. [DOI] [PubMed] [Google Scholar]
- 55.Tourdias T, Mori N, Dragonu I, Cassagno N, Boiziau C, Aussudre J, et al. Differential aquaporin 4 expression during edema build-up and resolution phases of brain inflammation. J Neuroinflammation. 2011;8:143. doi: 10.1186/1742-2094-8-143. [DOI] [PMC free article] [PubMed] [Google Scholar]
- 56.Verkman AS, Binder DK, Bloch O, Auguste K, Papadopoulos MC. Three distinct roles of aquaporin-4 in brain function revealed by knockout mice. Biomembranes. 2006;1758:1085–1093. doi: 10.1016/j.bbamem.2006.02.018. [DOI] [PubMed] [Google Scholar]
- 57.Vredenburgh JJ, Cloughesy T, Samant M, Prados M, Wen PY, Mikkelsen T, et al. Corticosteroid use in patients with glioblastoma at first or second relapse treated with bevacizumab in the BRAIN study. Oncologist. 2010;15:1329–1334. doi: 10.1634/theoncologist.2010-0105. [DOI] [PMC free article] [PubMed] [Google Scholar]
- 58.Wang W, Merrill MJ, Borchardt RT. Vascular endothelial growth factor affects permeability of brain microvessel endothelial cells in vitro. Am J Physiol. 1996;271:C1973–C1980. doi: 10.1152/ajpcell.1996.271.6.C1973. [DOI] [PubMed] [Google Scholar]
- 59.Watanabe M, Tanaka R, Takeda N. Magnetic resonance imaging and histopathology of cerebral gliomas. Neuroradiology. 1992;34:463–469. doi: 10.1007/BF00598951. [DOI] [PubMed] [Google Scholar]
- 60.Wei XE, Zhang YZ, Li YH, Li MH, Li WB. Dynamics of rabbit brain edema in focal lesion and perilesion area after traumatic brain injury: a MRI study. J Neurotrauma. 2012;29:2413–2420. doi: 10.1089/neu.2010.1510. [DOI] [PMC free article] [PubMed] [Google Scholar]
- 61.Yasuhara T, Shingo T, Kobayashi K, Takeuchi A, Yano A, Muraoka K, et al. Neuroprotective effects of vascular endothelial growth factor (VEGF) upon dopaminergic neurons in a rat model of Parkinson’s disease. Eur J Neurosci. 2004;19:1494–1504. doi: 10.1111/j.1460-9568.2004.03254.x. [DOI] [PubMed] [Google Scholar]
- 62.Zhao F, Deng J, Yu X, Li D, Shi H, Zhao Y. Protective effects of vascular endothelial growth factor in cultured brain endothelial cells against hypoglycemia. Metab Brain Dis. 2015;30:999–1007. doi: 10.1007/s11011-015-9659-z. [DOI] [PMC free article] [PubMed] [Google Scholar]
- 63.Zinn PO, Mahajan B, Sathyan P, Singh SK, Majumder S, Jolesz FA, et al. Radiogenomic mapping of edema/cellular invasion MRI-phenotypes in glioblastoma multiforme. PLoS One. 2011;6:e25451. doi: 10.1371/journal.pone.0025451. [DOI] [PMC free article] [PubMed] [Google Scholar]


