Abstract
Promoter hypermethylation‐mediated inactivation of ID4 plays a crucial role in the development of solid tumours. This study aimed to investigate ID4 methylation and its clinical relevance in myeloid malignancies. ID4 hypermethylation was associated with higher IPSS scores, but was not an independent prognostic biomarker affecting overall survival (OS) in myelodysplastic syndrome (MDS). However, ID4 hypermethylation correlated with shorter OS and leukaemia‐free survival (LFS) time and acted as an independent risk factor affecting OS in acute myeloid leukaemia (AML). Moreover, ID4 methylation was significantly decreased in the follow‐up paired AML patients who achieved complete remission (CR) after induction therapy. Importantly, ID4 methylation was increased during MDS progression to AML and chronic phase (CP) progression to blast crisis (BC) in chronic myeloid leukaemia (CML). Epigenetic studies showed that ID4 methylation might be one of the mechanisms silencing ID4 expression in myeloid leukaemia. Functional studies in vitro showed that restoration of ID4 expression could inhibit cell proliferation and promote apoptosis in both K562 and HL60 cells. These findings indicate that ID4 acts as a tumour suppressor in myeloid malignancies, and ID4 methylation is a potential biomarker in predicting disease progression and treatment outcome.
Keywords: ID4, methylation, progression, prognosis, myeloid malignancies
Background
Myeloid malignancies are a clonal disease derived from myeloid haematopoietic stem/progenitor cells, which usually include MDS, AML and CML. MDS represents a diverse group of clonal haematopoietic disorders characterized by peripheral blood cytopenias, ineffective production of blood cells and high risks of transformation to AML 1. AML is a heterogeneous disease with variable clinical outcome, characterized by the uncontrolled proliferation of granulocytic, monocytic, megakaryocytic or rarely, erythroid blast cells 2. Cytogenetic abnormalities and molecular biological changes including gene mutations and abnormal gene expression play vital roles in leukaemogenesis 3. However, approximately 45% of de novo AML is normal karyotypes, whose pathogenesis is complex and remains not well understood, and with a quite heterogeneous clinical outcome from a few days to complete cure 4, 5. CML is a disorder resulted from a reciprocal translocation between chromosome 9 and 22 (known as the Philadelphia chromosome) that codes for BCR‐ABL transcripts and fusion proteins with unusual tyrosine‐kinase activity 6. CML is divided into three distinct clinical phases: CP, accelerated phase (AP), and BC according to the course of disease progression 6. Although the molecular pathogenesis of CML is well defined, but the underlying mechanism leading to the progression of CML is not well understood.
Epigenetics refers to variability in gene expression without any underlying modification in the actual genetic sequence, mainly including DNA methylation, histone modifications and microRNAs expression 7. Epigenetic modifications especially DNA methylation play a fundamental role in several aspects of natural development, from embryogenesis taking place in the very early moments after conception, as well as chromatin structure, X chromosome inactivation, genomic imprinting and chromosome stability 7, 8, 9. In addition to the physiological functions, aberrant DNA methylation is also found to be associated with a growing number of human diseases, in particular, human cancers 10. The changes lead to permanent alterations by affecting expression of cancer‐related genes that could regulate the cancer phenotype, such as cellular growth, apoptosis and invasiveness 7. In haematopoietic malignancies, aberrant DNA methylation has been aroused great attentions as crucial molecular events in disease occurrence and progression and also as a predictor for caner progression, diagnosis, risk stratification and prognosis 11, 12, 13.
Highly conserved ID (inhibitor of differentiation) gene family (ID1‐ID4) encodes multifunctional proteins whose transcriptional activity is based on dominant negative inhibition of basic helix‐loop‐helix (bHLH) transcription factors 14. Numerous studies demonstrated an oncogenic function for ID1, ID2 and ID3 in the initiation and development of cancer including leukaemia 14. In contrast, ID4 located on a 4 Mb region on chromosome 6p22.3 presents a paradigm shift in context of well‐established role of ID1, ID2 and ID3 during carcinogenesis 15. Evidence showed that inhibition of ID4 contributes to developmental defects and cancer progression 11. In a majority of human cancers, ID4 acted as a tumour suppressor and was low‐expressed caused by its promoter hypermethylation 15. Furthermore, the adverse impact of reduced ID4 expression on prognosis has been shown in quite a few cancers including colorectal carcinoma, breast cancer and MDS 15. However, ID4 expression and methylation pattern as well as its direct role in myeloid malignancies were rarely investigated.
In this study, we focused on ID4 expression and methylation in MDS, AML and CML and further determined ID4 methylation in predicting prognosis, disease progression and disease surveillance. Moreover, the role of ID4 in myeloid malignancies was further analysed.
Materials and methods
Patients and treatment
This study was approved by Institutional Ethics Committee of the Affiliated People's Hospital of Jiangsu University, and written informed consents were obtained from all participants. A total of 60 healthy donors were used as controls. The diagnosis and classification of 99 MDS, 212 AML and 91 patients with CML were established according to the revised French–American–British (FAB) classification and the 2008 World Health Organization (WHO) criteria 16, 17. The IPSS scores were utilized to classify the risk groups of MDS 18. Our study focused on BM mononuclear cells (BMMNCs) extracted as reported previously 19. The treatment for MDS patients with lower IPSS scores (Low/Int‐1) was symptomatic and supportive treatment with/without thalidomide, whereas patients with higher IPSS scores (Int‐2/High) received chemotherapy included aclacinomycin, cytarabine, granulocyte colony stimulating factor together with symptomatic and supportive treatment. Patients with AML received chemotherapy including induction therapy and subsequent consolidation treatment 20, 21. For non‐M3 patients, induction therapy was one or two courses of daunorubicin combined with cytarabine. Subsequent consolidation treatment included high‐dose cytarabine, mitoxantrone with cytarabine and homoharringtonine combined with cytarabine. Meanwhile, for M3 patients, induction therapy was oral all‐trans retinoic acid (ATRA) together with daunorubicin in combination with cytarabine. Maintenance therapy was oral mercaptopurine, oral methotrexate and oral ATRA over 2 years.
Gene mutation detection
Gene mutations were detected by high‐resolution melting analysis (HRMA) and direct DNA sequencing as reported 22, 23, 24, 25, 26, 27, 28, 29.
Cell line and cell culture
Human leukaemic cell lines K562 and HL60 were cultured in RPMI 1640 medium (Thermo Fisher Scientific, Shanghai, China) containing 10% foetal calf serum (ExCell Bio, Shanghai, China) and grown at 37°C in 5% CO2 humidified atmosphere.
Treatment with 5‐aza‐dC
For demethylation studies, cells at a density of 5 × 10⁵ cells/ml in 10 ml were treated with 5‐aza‐dC (Sigma‐Aldrich, Steinheim, Germany) with a final concentration of 0, 1, 2 and 10 μM during 4 days (added daily).
RNA isolation, reverse transcription and RQ‐PCR
Total RNA isolation and reverse transcription were conducted as reported previously 19. The primers for ID4 expression were 5′‐CATCCCGCCCAACAAGAAAGTCA‐3′ (forward) and 5′‐GCCGGGTCGGTGTTGAGCGCAGT‐3′ (reverse). ID4 expression was examined by RQ‐PCR in 7500 Thermo Cycler (Applied Biosystems, Foster, CA, USA) using AceQ qPCR SYBR Green Master Mix (Vazyme Biotech Co., Piscataway, NJ, USA). RQ‐PCR program was carried out at 95°C for 30 sec., followed by 40 cycles at 95°C for 10 sec., 68°C for 1 min., 72°C for 1 min. and 89°C for 30 sec. to collect fluorescence. Relative ID4 expression was calculated using the following equation:
DNA isolation, bisulphite modification and RQ‐MSP
Genomic DNA isolation and modification were performed as reported previously 20. RQ‐MSP was applied to detect the level of ID4 methylation using AceQ qPCR SYBR Green Master Mix (Vazyme Biotech Co., Piscataway, NJ, USA) with primers reported previously 30. RQ‐MSP program was conducted under the conditions: 95°C for 5 min., 40 cycles for 10 sec. at 95°C, 1 min. at 63°C, 1 min. at 72°C and 80°C for 30 sec. The normalized ratio (NM‐ID4) was used to assess ID4 methylation level in samples. NM‐ID4 was calculated using the following formula:
BSP
TaKaRa Taq™ Hot Start Version kit (Tokyo, Japan) was used for BSP reaction with primers also as reported 31. BSP conditions were 10 sec. at 98°C, 40 cycles for 10 sec. at 98°C, 30 sec. at 59°C, 30 sec. at 72°C and followed by a final 7 min. at 72°C. BSP products cloning sequencing was performed as described 20, 32. Five independent clones from each specimen were sequenced (BGI Tech Solutions Co., Shanghai, China).
Western bolt
Western blotting was performed as described previously 33. The antibodies were rabbit anti‐ID4 (Abcam, Cambridge, MA, USA), mouse anti‐β‐actin (Beyotime Biotechnology, Nanjing, China) and antimouse/anti‐rabbit secondary antibodies (Beyotime Biotechnology, Nanjing, China).
Plasmid construction and transfection
Human full‐length ID4 CDS sequences cloned in PEX‐2 expression vector (PEX‐2‐ID4) were purchased from GenePharma (Shanghai, China). PEX‐2‐ID4 and PEX‐2 were transfected into K562 and HL60 cells, respectively, using Lipofectamine™ 2000 (Invitrogen, San Diego, CA, USA). ID4 stably expressed cells were selected by G418 (50 μg/ml; Thermo Fisher Scientific) and flow sorting (BD FACSAriall, San Jose, CA, USA).
Cell proliferation assays
Cells (1 × 10⁵ cells/ml) were seeded onto a six‐well plate in RPMI 1640 medium containing 10% foetal calf serum. After culturing for 0, 1, 2 and 3 days, cells were counted in counting board for three times.
Flow cytometry analysis
Cells (2 × 10⁵ cells/ml) were seeded onto a six‐well plate in RPMI 1640 medium containing 1% foetal calf serum (for apoptosis analysis) and 10% foetal calf serum (for cell cycle analysis). Annexin V‐PI apoptosis detection and cell cycle detection kits (BD Pharmingen, San Diego, CA, USA) were used to analyse the apoptosis rate and cell cycle distribution according to the manufacturer's protocols and then analysed via flow cytometry (BD FACSCalibur, San Jose, CA, USA). Each experiment was repeated three times.
TCGA databases
ID4 methylation (HM450) and mRNA expression (RNA Seq V2 RSEM) data from a cohort of 200 patients with AML from The Cancer Genome Atlas (TCGA) 34 were downloaded via cBioPortal (http://www.cbioportal.org) 35, 36.
Statistical analyses
SPSS 20.0 software package (SPSS, Chicago, IL, USA) was applied to statistical analyses. Mann–Whitney U‐test was performed to compare the differences of continuous variables. While, the difference of categorical variables was analysed using Pearson chi‐square analysis/Fisher's exact test. Spearman correlation test was conducted to evaluate the correlation between continuous variables. The ROC curve and area under the ROC curve (AUC) were carried out to assess the discriminative capacity of ID4 methylation level between patients and controls. Kaplan–Meier and Cox regression (univariate and multivariate) analyses were used to analyse the impact of ID4 methylation on survival. Statistical significance was set at P < 0.05, and all tests were two sided.
Results
Hypermethylation of ID4 correlated with higher IPSS scores in MDS
ID4 methylation detected by real‐time quantitative methylation‐specific PCR (RQ‐MSP) showed significantly increased level in MDS patients (P < 0.001, Fig. 1). ID4 methylation was further confirmed by bisulphite sequencing PCR (BSP) in six samples (three controls selected randomly and three patients with highest methylation level). The represented results of BSP were shown in Figure S1. To analyse the correlation between ID4 methylation and clinical characteristics, patients were divided into two groups (ID4 hypermethylation and non‐hypermethylation) based on the cut‐off value of 1.021 obtained by receiver operating characteristic (ROC) curve analysis (sensitivity at 49% and specificity at 100%). The comparison of clinical manifestations and laboratory features between the two groups is shown in Table 1. Patients with ID4 hypermethylation tended to have higher percentage of bone marrow (BM) blasts (P = 0.069). ID4 hypermethylated patients had higher incidence of U2AF1 mutation (P = 0.057). Notably, ID4 hypermethylation occurred significantly in patients with Int‐2/High International Prognostic Scoring System (IPSS) scores compared to those with Int‐1/Low IPSS scores [69% (18/26) versus 42% (28/67), P = 0.022].
Figure 1.

Relative methylation levels of ID4 in controls and myeloid malignancies. The distributions of the ID4 methylation were presented with scatter plots. The median level of ID4 methylation in each group was shown with horizontal line.
Table 1.
Comparison of clinical manifestations and laboratory features between ID4 non‐hypermethylated and hypermethylated MDS patients
| Patient's parameter | Non‐hypermethylated (n = 50) | Hypermethylated (n = 49) | P value |
|---|---|---|---|
| Sex (male/female) | 28/22 | 28/21 | 1.000 |
| Age (years) | 56 (14–85) | 62 (20–86) | 0.122 |
| WBC (×109/l) | 2.9 (1.3–19.5) | 2.7 (0.9–82.4) | 0.934 |
| HB (g/l) | 64 (26–128) | 65 (38–118) | 0.869 |
| PLT (×109/l) | 61.5 (3–1176) | 47 (0–754) | 0.746 |
| BM blasts (%) | 2.0 (0.0–16.5) | 6.0 (0.0–27.0) | 0.069 |
| Cytogenetic classification | |||
| Good | 36 (72%) | 34 (69%) | 0.677 |
| Intermediate | 9 (18%) | 7 (14%) | |
| Poor | 2 (4%) | 5 (10%) | |
| No data | 3 (6%) | 3 (6%) | |
| IPSS | |||
| Low | 7 (14%) | 2 (4%) | 0.008 |
| Int‐1 | 32 (64%) | 26 (53%) | |
| Int‐2 | 8 (16%) | 9 (18%) | |
| High | 0 (0%) | 9 (18%) | |
| No data | 3 (6%) | 3 (6%) | |
| Gene mutations | |||
| CEBPA (+/−) | 2/47 | 0/47 | 0.495 |
| IDH1/2 (+/−) | 3/46 | 1/46 | 0.617 |
| DNMT3A (+/−) | 0/49 | 3/44 | 0.113 |
| U2AF1 (+/−) | 1/48 | 6/41 | 0.057 |
| SF3B1 (+/−) | 3/46 | 3/44 | 1.000 |
Median (range); WBC: white blood cells; HB: haemoglobin; PLT: platelet count; BM: bone marrow; IPSS: International Prognostic Scoring System; WHO: World Health Organization; RA: refractory anaemia; RARS: RA with ringed sideroblasts; RCMD: refractory cytopenia with multilineage dysplasia; RCMD‐RS: RCMD with ringed sideroblasts; RAEB: RA with excess of blasts.
ID4 methylation was not an independent prognostic biomarker in MDS
The impact of ID4 hypermethylation on prognosis was analysed in 80 MDS patients (range 1–113 months; median 26 months). According to Kaplan–Meier analysis, ID4 hypermethylated patients had a significantly shorter OS time than ID4 non‐hypermethylated patients (P = 0.038, Fig. 2). However, Cox regression multivariate analysis including variables with P < 0.200 in univariate analysis failed to reveal prognostic value of ID4 methylation in MDS patients (P = 0.433, Table 2).
Figure 2.
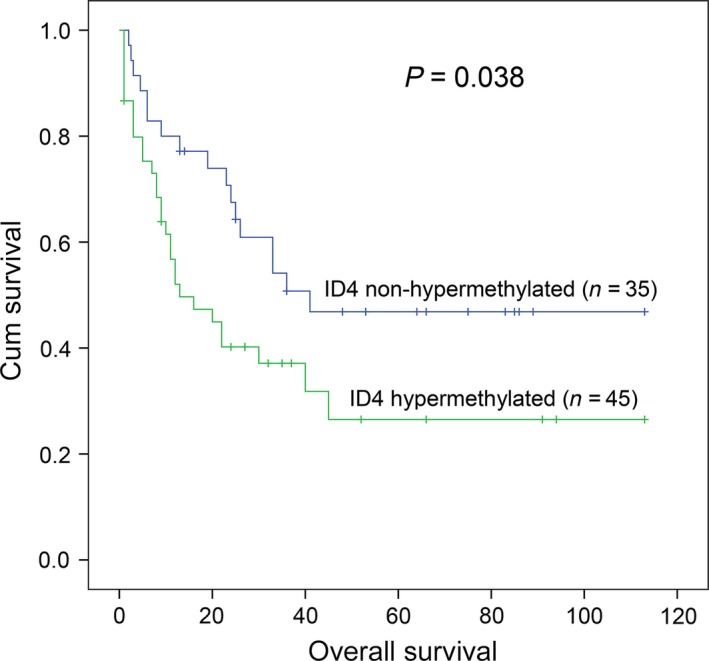
The impact of ID4 methylation on overall survival (OS) in MDS patients. ID4 hypermethylated patients showed significantly shorter OS time as compared with ID4 non‐hypermethylated patients which was compared by Kaplan–Meier analysis.
Table 2.
Univariate and multivariate analyses of prognostic factors for overall survival in MDS patients
| Prognostic factors | Univariate analyses | Multivariate analyses | ||
|---|---|---|---|---|
| Hazard ratio (95% CI) | P value | Hazard ratio (95% CI) | P value | |
| Age | 1.867 (1.082–3.222) | 0.025 | 2.420 (1.308–4.477) | 0.005 |
| IPSS risks | 1.606 (1.141–2.261) | 0.007 | 1.643 (1.107–2.439) | 0.014 |
| ID4 methylation | 1.861 (1.018–3.404) | 0.044 | 1.305 (0.670–2.544) | 0.433 |
| CEBPA mutation | 0.406 (0.056–2.949) | 0.373 | – | – |
| IDH1/2 mutation | 0.939 (0.293–3.012) | 0.915 | – | – |
| U2AF1 mutation | 0.756 (0.272–2.100) | 0.591 | – | – |
| SF3B1 mutation | 1.461 (0.454–4.696) | 0.525 | – | – |
| DNMT3A mutation | 2.968 (0.909–9.684) | 0.071 | 2.496 (0.745–8.366) | 0.138 |
IPSS: International Prognostic Scoring System.
Variables including age (≤60 versus >60 years old), IPSS scores (Low versus Int‐1 versus Int‐2 versus High), ID4 methylation (non‐hypermethylated versus hypermethylated) and gene mutations (mutant versus wild‐type).
ID4 methylation was increased during MDS transformed into AML
To verify whether ID4 methylation was involved in MDS progression, we further determined 11 follow‐up patients with progression from MDS to AML. Of note, ID4 methylation showed significantly increased in patients with AML (P = 0.030, Fig. 3).
Figure 3.
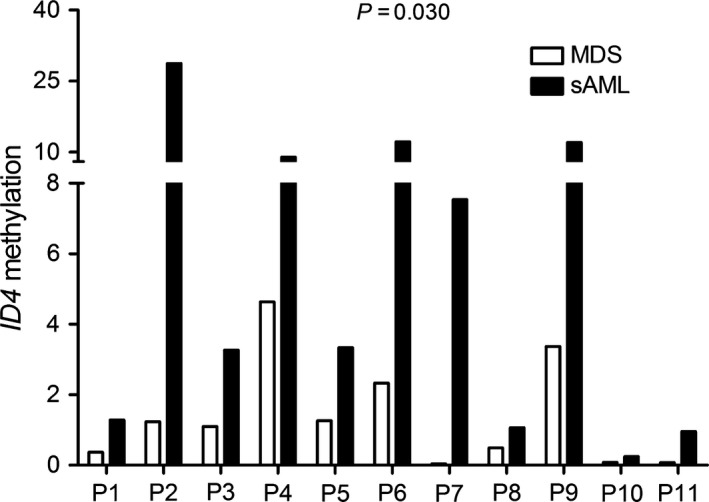
Alterations in ID4 methylation during MDS to secondary AML (sAML) in 11 follow‐up patients. All patients showed significantly increased ID4 methylation level in sAML compared to MDS analysed with non‐parametric test.
Hypermethylation of ID4 was also a frequent event in AML
ID4 methylation level was also significantly increased in patients with AML (P = 0.001, Fig. 1). ID4 methylation was further confirmed by BSP in 10 samples (five patients with lowest methylation level and five patients with highest methylation level). The represented results of BSP are shown in Figure S2. ID4 methylation density in the tested samples was heavily correlated with ID4 methylation level (R = 0.885, P < 0.001). The same cut‐off value also divided the patients into two groups. The comparison of clinical manifestations and laboratory features between the two groups is shown in Table 3. There was a trend that ID4 hypermethylated patients showed lower platelets (PLT) (P = 0.052). Moreover, the cases with ID4 hypermethylation had markedly higher white blood cells (WBC) (P = 0.008). The cases with ID4 hypermethylation presented significantly higher frequency of CEBPA mutation (P = 0.026).
Table 3.
Comparison of clinical manifestations and laboratory features between AML patients with ID4 non‐hypermethylation and hypermethylation
| Patient's parameters | Non‐hypermethylated (n = 130) | Hypermethylated (n = 82) | P value |
|---|---|---|---|
| Sex, male/female | 78/52 | 46/36 | 0.668 |
| Median age, years (range) | 54 (3–87) | 50 (17–93) | 0.625 |
| Median WBC, ×109/l (range) | 10.4 (0.8–528.0) | 31.6 (0.3–249.3) | 0.008 |
| Median haemoglobin, g/l (range) | 74 (32–138) | 76 (40–147) | 0.187 |
| Median platelets, ×109/l (range) | 45 (5–447) | 32 (3–264) | 0.052 |
| BM blasts, % (range) | 48.5 (3.0–97.5) | 35.0 (1.0–109.0) | 0.147 |
| CR (−/+) | 48/47 | 36/29 | 0.629 |
| FAB | |||
| M0 | 0 (0%) | 1 (1%) | 0.324 |
| M1 | 12 (9%) | 9 (11%) | |
| M2 | 50 (38%) | 31 (38%) | |
| M3 | 18 (14%) | 17 (21%) | |
| M4 | 26 (20%) | 17 (21%) | |
| M5 | 17 (13%) | 6 (7%) | |
| M6 | 7 (5%) | 1 (1%) | |
| Karyotype classification | |||
| Favourable | 33 (25%) | 25 (30%) | 0.846 |
| Intermediate | 75 (58%) | 46 (56%) | |
| Poor | 16 (12%) | 8 (10%) | |
| No data | 6 (5%) | 3 (4%) | |
| Karyotype | |||
| Normal | 60 (46%) | 32 (39%) | 0.599 |
| t(8;21) | 15 (12%) | 7 (9%) | |
| t(15;17) | 18 (14%) | 17 (21%) | |
| 11q23 | 1 (1%) | 1 (1%) | |
| Complex | 13 (10%) | 6 (7%) | |
| Others | 17 (13%) | 16 (20%) | |
| No data | 6 (5%) | 3 (4%) | |
| Gene mutation | |||
| CEBPA (+/−) | 14/111 | 17/55 | 0.026 |
| NPM1 (+/−) | 16/109 | 5/67 | 0.238 |
| FLT3‐ITD (+/−) | 17/108 | 6/66 | 0.358 |
| c‐KIT (+/−) | 7/118 | 2/70 | 0.491 |
| N/K‐RAS (+/−) | 9/116 | 10/62 | 0.139 |
| IDH1/2 (+/−) | 7/118 | 5/67 | 0.761 |
| DNMT3A (+/−) | 10/115 | 4/68 | 0.580 |
| U2AF1 (+/−) | 4/121 | 3/69 | 0.708 |
WBC: white blood cells; FAB: French–American–British classification; AML: acute myeloid leukaemia; CR: complete remission.
ID4 methylation was an independent prognostic biomarker in AML
Due to independent disease entity, acute promyelocytic leukaemia (APL) was excluded from the analysis. A total of 127 non‐APL patients with available survival data ranged from 1 to 84 months (median 6 months). Although there was no significant difference in CR rate between the two groups [33% (16/49) versus 45% (38/85), P = 0.202], ID4 hypermethylated cases presented significantly shorter OS and LFS time (P = 0.002 and 0.001, respectively, Fig. 4A and B). Among cytogenetically normal AML (CN‐AML), ID4 hypermethylation significantly correlated with lower CR rate [30% (8/27) versus 57% (27/47), P = 0.030], and shorter OS (P = 0.001, Fig. 4C) but not LFS time (P = 0.326, Fig. 4D). Moreover, Cox regression was further conducted and demonstrated that ID4 methylation may be act as an independent prognostic factor for OS in non‐APL and CN‐AML patients (P = 0.081 and 0.005, respectively, Table 4).
Figure 4.
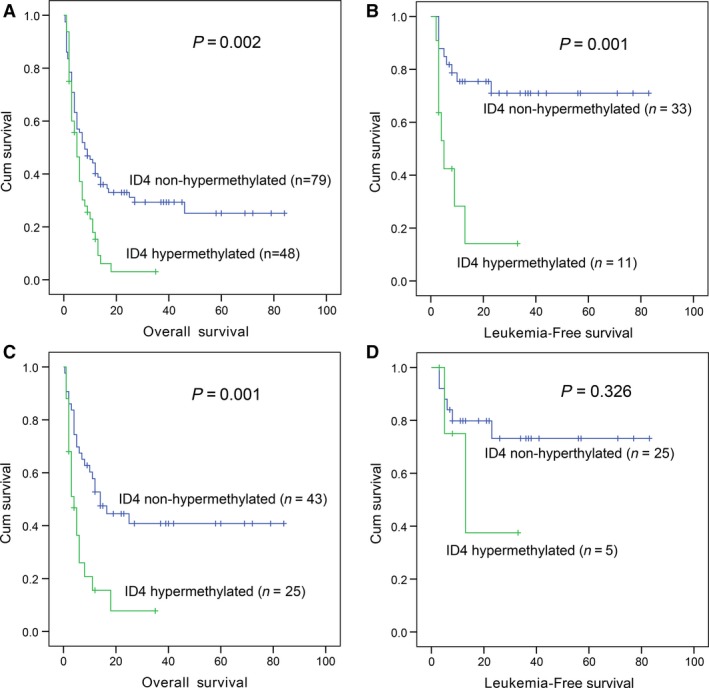
The impact of ID4 methylation on overall survival (OS) and leukaemia‐free survival (LFS) in patients with AML. (A) OS for non‐APL; (B) LFS for non‐APL; (C) OS for AML with normal cytogenetics (CN‐AML); (D) LFS for CN‐AML.
Table 4.
Univariate and multivariate analyses of prognostic factors for overall survival in non‐APL and CN‐AML patients
| Non‐APL | CN‐AML | |||||||
|---|---|---|---|---|---|---|---|---|
| Univariate analysis | Multivariate analysis | Univariate analysis | Multivariate analysis | |||||
| HR (95% CI) | P | HR (95% CI) | P | HR (95% CI) | P | HR (95% CI) | P | |
| Age | 2.229 (1.520–3.269) | <0.001 | 2.083 (1.364–3.182) | 0.001 | 2.800 (1.544–5.077) | 0.001 | 2.568 (1.345–4.901) | 0.004 |
| WBC | 1.913 (1.299–2.817) | 0.001 | 1.539 (0.990–2.393) | 0.055 | 1.722 (0.996–3.150) | 0.052 | 1.581 (0.854–2.927) | 0.145 |
| Karyotype | 1.709 (1.359–2.149) | <0.001 | 1.675 (1.227–2.288) | 0.001 | – | – | – | – |
| ID4 * | 1.845 (1.217–2.798) | 0.004 | 1.507 (0.950–2.391) | 0.081 | 2.695 (1.452–4.999) | 0.002 | 2.483 (1.309–4.712) | 0.005 |
| FLT3‐ITD† | 1.071 (0.558–2.058) | 0.836 | – | – | 0.707 (0.280–1.783) | 0.463 | – | – |
| NPM1 † | 1.135 (0.589–2.189) | 0.705 | – | – | 0.967 (0.433–2.159) | 0.935 | – | ‐ |
| CEBPA † | 0.858 (0.479–1.537) | 0.607 | – | – | 1.075 (0.482–2.394) | 0.860 | – | – |
| c‐KIT † | 0.585 (0.185–1.847) | 0.361 | – | – | 0.404 (0.056–2.927) | 0.369 | – | – |
| N/K‐RAS † | 1.124 (0.583–2.166) | 0.727 | – | – | 1.129 (0.447–2.854) | 0.797 | – | – |
| IDH1/2 † | 1.469 (0.783–2.756) | 0.230 | – | – | 1.721 (0.833–3.558) | 0.143 | 1.641 (0.705–3.818) | 0.250 |
| DNMT3A † | 0.948 (0.185–1.847) | 0.885 | – | – | 0.786 (0.312–1.982) | 0.609 | – | – |
| U2AF1 † | 2.356 (1.081–5.136) | 0.031 | 2.576 (1.155–5.747) | 0.021 | 2.174 (0.664–7.119) | 0.199 | 1.671 (0.447–6.241) | 0.445 |
*Methylation; †Mutation; HR: hazard ratio.
Variables including age (≤60 versus >60 years), WBC (≥30 × 109 versus <30 × 109/l), karyotypic classification (favourable versus intermediate versus poor), ID4 methylation (non‐hypermethylated versus hypermethylated) and gene mutations (mutant versus wild‐type).
ID4 methylation was decreased in patients with AML achieving CR after induction therapy
To identify whether ID4 methylation could be act as a biomarker for disease surveillance, we assessed ID4 methylation in 18 follow‐up paired AML patients from the initial diagnosis to CR. Notably, ID4 methylation was significantly decreased in post‐CR after induction therapy (P < 0.001, Fig. 5).
Figure 5.
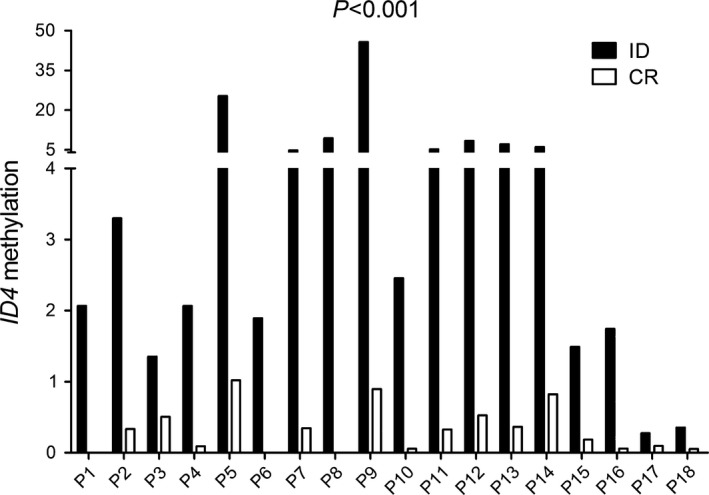
ID4 methylation changes in patients achieved complete remission (CR) after induction therapy in 18 follow‐up AML. ID4 hypermethylated patients showed significantly decreased methylation level in CR compared to initial diagnosis (ID) analysed with non‐parametric test.
Hypermethylation of ID4 was associated with later clinical stage in CML
ID4 methylation was further detected in patients with CML and showed significantly hypermethylated in BC stage, but not in AP/CP stage (P < 0.001 and =0.676, respectively, Fig. 1). The patients were also divided into two groups to further analyse its clinical relevance (Table 5). ID4 hypermethylated cases had significantly lower WBC and PLT (P = 0.017 and 0.041, respectively). According to cytogenetics, patients with t(9;22) with additional alteration karyotype had significantly higher frequency of ID4 hypermethylation compared with patients with t(9;22) karyotype [50% (4/8) versus 11% (6/54), P = 0.019]. Moreover, the frequency of ID4 hypermethylation in BC stage was significantly higher than in CP/AP stages [85% (11/13) versus 9% (7/78), P < 0.001].
Table 5.
Comparison of clinical manifestations and laboratory features between CML patients with ID4 non‐hypermethylation and hypermethylation
| Patient's parameters | Non‐hypermethylated (n = 73) | Hypermethylated (n = 18) | P value |
|---|---|---|---|
| Sex, male/female | 44/29 | 11/7 | 1.000 |
| Median age, years (range) | 46 (15–83) | 53 (22–75) | 0.687 |
| Median WBC, ×109/l (range) | 82.2 (2.5–321.9) | 23.7 (0.9–142.0) | 0.017 |
| Median haemoglobin, g/l (range) | 101.5 (47–152) | 96.5 (57–119) | 0.387 |
| Median platelets, ×109/l (range) | 393 (22–1175) | 200 (30–939) | 0.041 |
| Cytogenetics | |||
| t(9;22) | 48 (66%) | 6 (33%) | 0.022 |
| t(9;22) with additional alteration | 4 (5%) | 4 (22%) | |
| Normal karyotype | 3 (4%) | 2 (11%) | |
| No data | 18 (25%) | 6 (33%) | |
| Staging | |||
| CP | 66 (90%) | 5 (28%) | <0.001 |
| AP | 5 (7%) | 2 (11%) | |
| BC | 2 (3%) | 11 (61%) | |
| BCR/ABL transcript, % (range) | 278.4 (16.9–100658.0) | 89.2 (71.9–1340.4) | 0.795 |
WBC: white blood cells; CP: chronic phase; AP: accelerated phase; BC: blast crisis.
ID4 methylation was increased during the progression in CML
To confirm that ID4 methylation was associated with disease progression in CML, ID4 methylation was further detected in five follow‐up paired CML patents from earlier to later clinical stage. Expectedly, BC‐CML but not AP‐CML showed significantly higher ID4 methylation level than CP‐CML (P = 0.004 and 0.347, respectively, Fig. 6).
Figure 6.
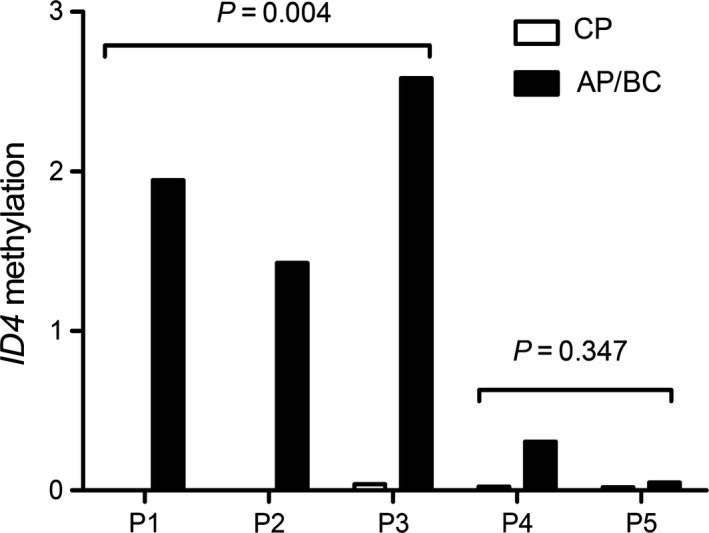
Alterations in ID4 methylation during CML progression in five follow‐up patients. P1, P2 and P3 were CML in chronic phase (CP‐CML) progression to CML in blast crisis (BC‐CML). P4 and P5 were CP‐CML progression to CML in accelerated phase (AP‐CML). Patients showed significantly increased ID4 methylation level in CP‐CML progression to BC‐CML but not in CP‐CML progression to AP‐CML.
ID4 methylation silenced ID4 expression in myeloid leukaemia
ID4 transcript level was detected by real‐time quantitative PCR (RQ‐PCR) in 145 AML, 52 CML and 33 control samples with available mRNA. ID4 expression was significantly down‐regulated in both AML and CML patients (P = 0.003 and 0.006, respectively, Fig. S3). In the tested samples, ID4 transcript level was negatively correlated with ID4 methylation level in patients with AML (R = −0.275, P = 0.001, Fig. 7A) and patients with CML (R = −0.424, P = 0.002, Fig. 7B).
Figure 7.
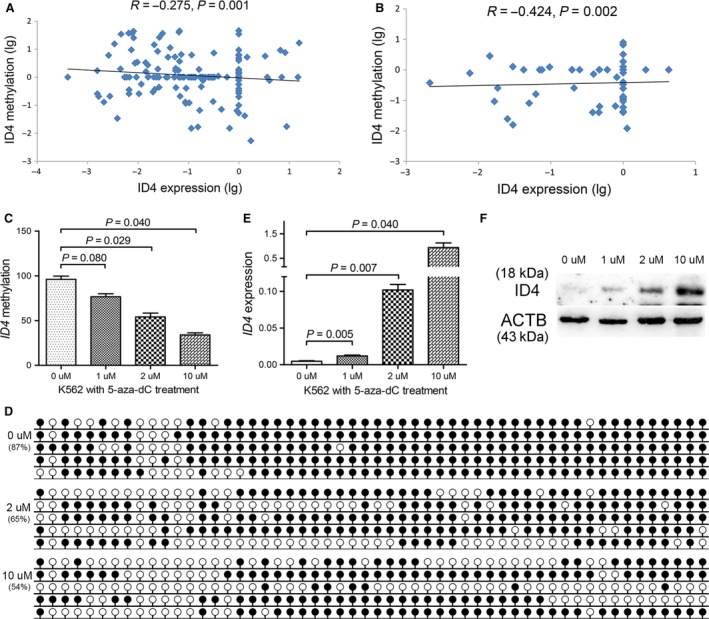
Epigenetic dysregulation silencing ID4 expression in myeloid leukaemia. (A and B) correlation between ID4 methylation and ID4 expression in patients with CML and AML. (C and D) ID4 methylation level and density before and after 5‐aza‐dC treatment. (E and F) ID4 transcript and protein level alterations before and after 5‐aza‐dC treatment. White cycle: unmethylated CpG dinucleotide; Black cycle: methylated CpG dinucleotide.
Moreover, an independent assessment of ID4 methylation and expression in 200 patients with AML from The Cancer Genome Atlas (TCGA) databases also observed a negative correlation between ID4 methylation and expression (R = −0.163, P = 0.034). Moreover, by the median level of ID4 expression set as the cut‐off value, the cohort of patient with AML was classified into two groups: ID4 low‐expressed (ID4 low) and ID4 high‐expressed (ID4 high). Although no significant difference was observed in OS time between two groups in non‐APL AML patients, ID4 low groups presented markedly shorter OS time than ID4 high groups among patients with CN‐AML (Fig. S4).
To explore whether ID4 promoter methylation could silence ID4 expression, ID4‐hypermethylated K562 cells were treated with 5‐aza‐2′‐deoxycytidine (5‐aza‐dC). As a result, the density of ID4 methylation was significantly decreased after the treatment (Fig. 7C and D), and ID4 transcript and protein level was significantly increased (Fig. 7E and F).
Restoration of ID4 inhibited cell proliferation and promoted apoptosis
To study the potential biological role of ID4 in myeloid leukaemia, we performed proliferation assays and apoptosis assays. We established K562 (Fig. 8A and B) and HL60 (Fig. 9A and B) cells overexpressing ID4 confirmed by RQ‐PCR and Western blot. The proliferation of K562 and HL60 cells was significantly inhibited by ID4 overexpression (Figs 8C and 9C) and may be caused by G0/G1 arrest (Figs 8D–F and 9D–F). Moreover, an increased ratio of apoptosis was also observed in K562 cells (Fig. 8G,H and I) and HL60 cells (Fig. 9G,H and I) due to ID4 overexpression.
Figure 8.
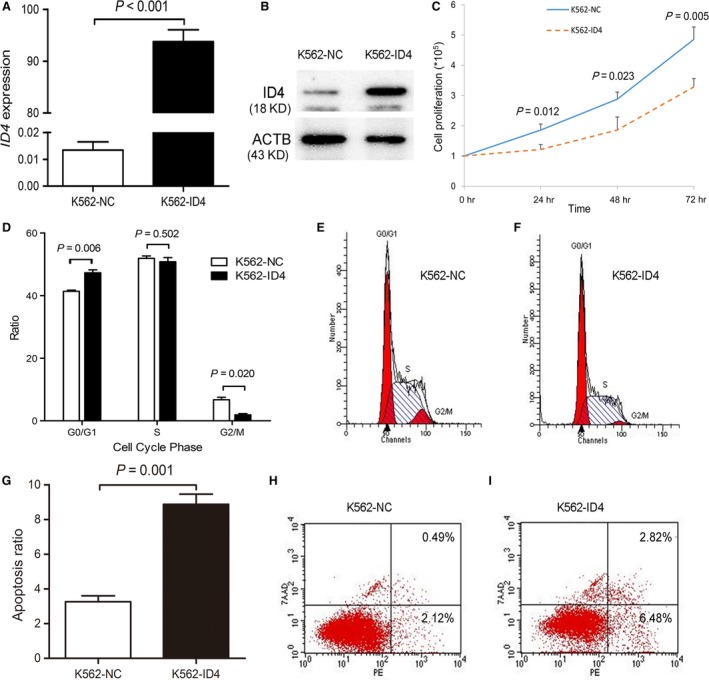
The biological role of ID4 on leukaemic cell line K562. (A and B) ID4 transcript and protein level before and after ID4 transfection. (C–I) the effect of ID4 on cell proliferation, cell cycle and apoptosis.
Figure 9.
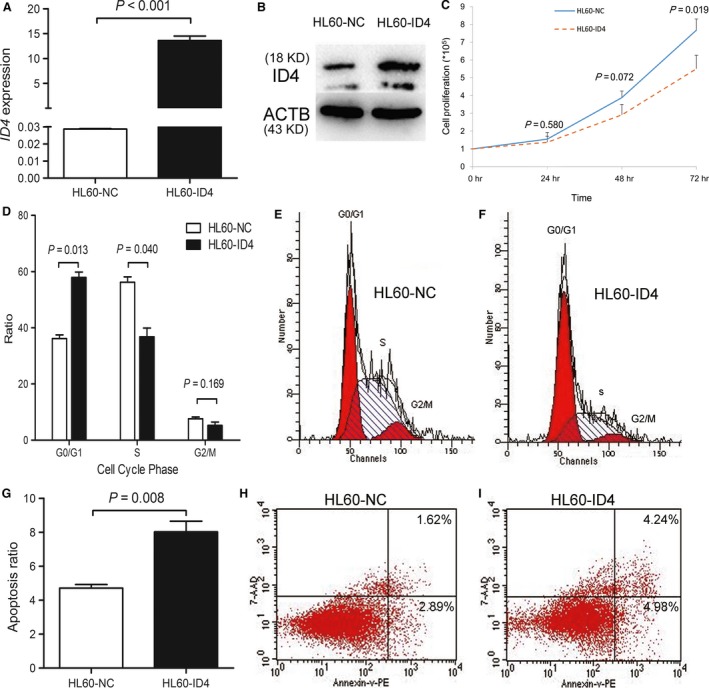
The biological role of ID4 on leukaemic cell line HL60. (A and B) ID4 transcript and protein level before and after ID4 transfection. (C–I) the effect of ID4 on cell proliferation, cell cycle and apoptosis.
Discussion
In the current study, we detected ID4 methylation in a large cohort of myeloid malignancies using RQ‐MSP, a rapid and precise methodology in detecting DNA methylation 37. Increased ID4 methylation level was frequently occurred in patients with MDS, AML and BC‐CML. We also confirmed that hypermethylation of ID4 was one of the epigenetic mechanisms leading to silencing ID4 expression in clinical samples and leukaemic cell lines. Moreover, by the functional experiments in vitro, restoration of ID4 expression inhibited cell proliferation through cell cycle arrest and promoted cell apoptosis in accordance with previous studies in mouse lymphoma Yac‐1 cells 38. Similarly, ectopic ID4 expression led to increased apoptosis and decreased cell proliferation due in part by an S‐phase arrest in prostate cancer 39. Chen et al. through functional studies in vivo revealed that hemizygous loss of ID4 in non‐transformed TCL1‐positive B cells enhanced cell proliferation triggered by CpG oligonucleotides and decreases sensitivity to dexamethasone‐mediated apoptosis in chronic lymphocytic leukaemia (CLL) 40. In addition, the crossing of ID4 +/− mice with Eμ‐TCL1 mice triggered a more aggressive murine CLL 40. These results suggested a crucial role of ID4 as a tumour suppressor in both lymphoid and myeloid malignancies.
Substantial progress has been achieved in understanding of the underlying mechanism of MDS and CML progression. Chromosomal abnormalities, such as −7/7q‐, +8, 6q‐, 11q‐, i(7q), 11q‐, t(7;9), i(9q) and complex karyotypes (for MDS progression), double Ph chromosome, trisomy chromosome 8, trisomy chromosome 19, i(17q), t(3;21) and t(7;11) (for CML progression), as well as genetic mutations including TP53, DNMT3A, TET2, IDH1/2, EZH2 and ASXL1 in MDS are considered as progression‐related drivers 41, 42, 43. Recently, epigenetic modifications especially in DNA methylation have been shown contributing to cancer progression including haematological malignancies. Jiang et al. reported that aberrant methylation was seen in every sample, on average affecting 91/1505 CpG loci in early MDS and 179 of 1505 loci after blast transformation 11. Our investigation by testing the follow‐up paired patients (MDS to AML and CP/AP‐CML to BC‐CML) indicated that ID4 methylation was associated with leukaemia transformation in MDS and disease progression in CML. These results together disclosed that ID4 methylation might also act as vital role contributing to the progression in myeloid malignancies. Accordingly, understanding the mechanisms leading to leukaemic transformation in MDS provides us new antileukaemia therapies.
Clinical implication of ID4 methylation has been investigated. However, its prognostic impact on prognosis remains controversial in patients with MDS. Previous study by Wang et al. suggested that ID4 methylation was associated with shorter OS or LFS time but not an independent indicator for OS 44. However, a recent study by Kang et al. indicated that ID4 methylation the independently prognostic factor for OS in patients with MDS 45. Our investigation further confirmed the association between ID4 hypermethylation and adverse prognosis among MDS patients. However, Cox multivariate analysis revealed that it was not an independently prognostic biomarker in MDS patients in accordance with study reported by Wang et al. 44. Notably, both Kaplan–Meier and Cox regression analyses disclosed that ID4 methylation was an independent prognostic biomarker in patients with CN‐AML. Besides this, ID4 methylation could also act as a promising predictor in disease surveillance in patients with AML. These results together suggested that ID4 methylation might play a more crucial role in AML. Of course, further studies are needed to determine whether it could be used as a potential predictor for risk stratification in patients with CN‐AML.
Genetic alterations and epigenetic modifications are common molecular events involved in the process of carcinogenesis and interacted with each other. Studies showed that somatic gene mutations such as IDH1/2, DNMT3A, TET2, ASXL1 and EZH2 affected epigenetic patterning including DNA methylation and histone modifications in patients with myeloid malignancies 46, 47. In our study, we further investigated the association between ID4 methylation and common gene mutations in patients with MDS and AML. Interestingly, our data showed that ID4 methylation was likely to be associated with U2AF1 mutation in MDS and CEBPA mutation in AML. Recently, RNA splicing factors gene U2AF1 mutation could cause splicing alterations in biological pathways previously implicated in myeloid malignancies, including the DNA damage response and epigenetic regulation usually in DNA methylation through DNMT3B pathway 48. Moreover, our previous study also found that GPX3 hypermethylation was correlated with CEBPA wild‐type in AML, while DLX4 hypermethylation was associated with U2AF1 mutation 20, 32. However, the underlying mechanism of the relation between ID4 methylation CEBPA and/or U2AF1 mutation remains unknown. Further studies are required to determine the role of ID4 methylation during the leukaemogenesis caused by CEBPA and/or U2AF1 mutation.
Taken together, our study demonstrates that epigenetically silenced ID4 acts as a tumour suppressor in myeloid malignancies. ID4 hypermethylation is not an independently prognostic predictor in MDS, but is a valuable indicator in predicting prognosis and disease surveillance in patients with AML. Moreover, ID4 methylation is associated with disease progression in both MDS and CML.
Conflict of interest
The authors declared that we have no conflict of interest.
Supporting information
Figure S1 Methylation density of ID4 in controls and MDS patients.
Figure S2 Methylation density of ID4 in controls and AML patients.
Figure S3 Relative expression levels of ID4 in controls and myeloid leukemia.
Figure S4 The impact of ID4 expression on overall survival (OS) in a cohort of 200 AML patients from The Cancer Genome Atlas (TCGA) databases.
Acknowledgements
This work was supported by National Natural Science foundation of China (81270630), Science and Technology Special Project in Clinical Medicine of Jiangsu Province (BL2012056), Six talent peaks project in Jiangsu Province (2015‐WSN‐115), Social Development Foundation of Zhenjiang (SH2014044, SH2014086, SH2015058), Clinical Medical Science, Development Foundation of Jiangsu University (JLY20140018), Key Medical Talent Program of Zhenjiang City.
Contributor Information
Jiang Lin, Email: linjiangmail@sina.com.
Jun Qian, Email: qianjun0007@hotmail.com.
Reference
- 1. Adès L, Itzykson R, Fenaux P. Myelodysplastic syndromes. Lancet. 2014; 383: 2239–52. [DOI] [PubMed] [Google Scholar]
- 2. Estey E, Döhner H. Acute myeloid leukaemia. Lancet. 2006; 368: 1894–907. [DOI] [PubMed] [Google Scholar]
- 3. Marcucci G, Haferlach T, Döhner H. Molecular genetics of adult acute myeloid leukemia: prognostic and therapeutic implications. J Clin Oncol. 2011; 29: 475–86. [DOI] [PubMed] [Google Scholar]
- 4. Rowley JD. Chromosomal translocations: revisited yet again. Blood. 2008; 112: 2183–9. [DOI] [PubMed] [Google Scholar]
- 5. Mrozek K, Heerema NA, Bloomfield CD. Cytogenetics in acute leukemia. Blood Rev. 2004; 18: 115–36. [DOI] [PubMed] [Google Scholar]
- 6. Apperley JF. Chronic myeloid leukaemia. Lancet. 2015; 385: 1447–59. [DOI] [PubMed] [Google Scholar]
- 7. Taby R, Issa JP. Cancer epigenetics. CA Cancer J Clin. 2010; 60: 376–92. [DOI] [PubMed] [Google Scholar]
- 8. Messerschmidt DM, Knowles BB, Solter D. DNA methylation dynamics during epigenetic reprogramming in the germline and preimplantation embryos. Genes Dev. 2014; 28: 812–28. [DOI] [PMC free article] [PubMed] [Google Scholar]
- 9. Marcho C, Cui W, Mager J. Epigenetic dynamics during preimplantation development. Reproduction. 2015; 150: R109–20. [DOI] [PMC free article] [PubMed] [Google Scholar]
- 10. Robertson KD. DNA methylation and human disease. Nat Rev Genet. 2005; 6: 597–610. [DOI] [PubMed] [Google Scholar]
- 11. Jiang Y, Dunbar A, Gondek LP, et al Aberrant DNA methylation is a dominant mechanism in MDS progression to AML. Blood. 2009; 113: 1315–25. [DOI] [PMC free article] [PubMed] [Google Scholar]
- 12. Chen J, Odenike O, Rowley JD. Leukaemogenesis: more than mutant genes. Nat Rev Cancer. 2010; 10: 23–36. [DOI] [PMC free article] [PubMed] [Google Scholar]
- 13. Avivi I, Rowe JM. Prognostic factors in acute myeloid leukemia. Curr Opin Hematol. 2005; 12: 62–7. [DOI] [PubMed] [Google Scholar]
- 14. Lasorella A, Benezra R, Iavarone A. The ID proteins: master regulators of cancer stem cells and tumour aggressiveness. Nat Rev Cancer. 2014; 14: 77–91. [DOI] [PubMed] [Google Scholar]
- 15. Patel D, Morton DJ, Carey J, et al Inhibitor of differentiation 4 (ID4): from development to cancer. Biochim Biophys Acta. 2015; 1855: 92–103. [DOI] [PMC free article] [PubMed] [Google Scholar]
- 16. Bennett JM, Catovsky D, Daniel MT, et al Proposed revised criteria for the classification of acute myeloid leukaemia. A report of the French‐American‐British Cooperative Group. Ann Intern Med. 1985; 103: 620–5. [DOI] [PubMed] [Google Scholar]
- 17. Swerdlow SH, Campo E, Harris NL, et al WHO classification of tumours of haematopoietic and lymphoid tissues. Lyon: IARC Press; 2008. [Google Scholar]
- 18. Greenberg P, Cox C, LeBeau MM, et al International scoring system for evaluating prognosis in myelodysplastic syndromes. Blood. 1997; 89: 2079–88. [PubMed] [Google Scholar]
- 19. Zhou JD, Yang L, Zhang YY, et al Overexpression of BAALC: clinical significance in Chinese de novo acute myeloid leukemia. Med Oncol. 2015; 32: 386. [DOI] [PubMed] [Google Scholar]
- 20. Zhou JD, Zhang TJ, Wang YX, et al DLX4 hypermethylation is a prognostically adverse indicator in de novo acute myeloid leukemia. Tumour Biol. 2016; 37: 8951–60. [DOI] [PubMed] [Google Scholar]
- 21. Li Y, Lin J, Yang J, et al Overexpressed let‐7a‐3 is associated with poor outcome in acute myeloid leukemia. Leuk Res. 2013; 37: 1642–7. [DOI] [PubMed] [Google Scholar]
- 22. Lin J, Yao DM, Qian J, et al Recurrent DNMT3A R882 muta‐tions in Chinese patients with acute myeloid leukemia and myelodysplastic syndrome. PLoS One. 2011; 6: e26906. [DOI] [PMC free article] [PubMed] [Google Scholar]
- 23. Lin J, Yao DM, Qian J, et al IDH1 and IDH2 mutation analysis in Chinese patients with acute myeloid leukemia and myelodysplastic syndrome. Ann Hematol. 2012; 91: 519–25. [DOI] [PubMed] [Google Scholar]
- 24. Yang X, Qian J, Sun A, et al RAS mutation analysis in a large cohort of Chinese patients with acute myeloid leukemia. Clin Biochem. 2013; 46: 579–83. [DOI] [PubMed] [Google Scholar]
- 25. Qian J, Yao DM, Lin J, et al U2AF1 Mutations in Chinese patients with acute myeloid leukemia and myelodysplastic syndrome. PLoS One. 2012; 7: e45760. [DOI] [PMC free article] [PubMed] [Google Scholar]
- 26. Wen XM, Lin J, Yang J, et al Double CEBPA mutations are prognostically favourable in non‐M3 acute myeloid leukemia patients with wild‐type NPM1 and FLT3‐ITD. Int J Clin Exp Pathol. 2014; 7: 6832–40. [PMC free article] [PubMed] [Google Scholar]
- 27. Wen XM, Hu JB, Yang J, et al CEBPA methylation and mutation in myelodysplastic syndrome. Med Oncol. 2015; 32: 192. [DOI] [PubMed] [Google Scholar]
- 28. Lin J, Yang J, Wen XM, et al Detection of SRSF2‐P95 mutation by high‐resolution melting curve analysis and its effect on prognosis in myelodysplastic syndrome. PLoS One. 2014; 9: e115693. [DOI] [PMC free article] [PubMed] [Google Scholar]
- 29. Yang J, Yao DM, Ma JC, et al The prognostic implication of SRSF2 mutations in Chinese patients with acute myeloid leukemia. Tumour Biol. 2016; 37: 10107–14. [DOI] [PubMed] [Google Scholar]
- 30. Noetzel E, Veeck J, Niederacher D, et al Promoter methylation‐associated loss of ID4 expression is a marker of tumour recurrence in human breast cancer. BMC Cancer. 2008; 8: 154. [DOI] [PMC free article] [PubMed] [Google Scholar]
- 31. Ryan JL, Jones RJ, Kenney SC, et al Epstein‐Barr virus‐specific methylation of human genes in gastric cancer cells. Infect Agent Cancer. 2010; 5: 27. [DOI] [PMC free article] [PubMed] [Google Scholar]
- 32. Zhou JD, Yao DM, Zhang YY, et al GPX3 hypermethylation serves as an independent prognostic biomarker in non‐M3 acute myeloid leukemia. Am J Cancer Res. 2015; 5: 2047–55. [PMC free article] [PubMed] [Google Scholar] [Retracted]
- 33. Ma J, Lin J, Qian J, et al MiR‐378 promotes the migration of liver cancer cells by down‐regulating Fus expression. Cell Physiol Biochem. 2014; 34: 2266–74. [DOI] [PubMed] [Google Scholar]
- 34. Cancer Genome Atlas Research Network . Genomic and epigenomic landscapes of adult de novo acute myeloid leukemia. N Engl J Med. 2013; 368: 2059–74. [DOI] [PMC free article] [PubMed] [Google Scholar]
- 35. Cerami E, Gao J, Dogrusoz U, et al The cBio cancer genomics portal: an open platform for exploring multidimensional cancer genomics data. Cancer Discov. 2012; 2: 401–4. [DOI] [PMC free article] [PubMed] [Google Scholar]
- 36. Gao J, Aksoy BA, Dogrusoz U, et al Integrative analysis of complex cancer genomics and clinical profiles using the cBioPortal. Sci Signal. 2013; 6: pl1. [DOI] [PMC free article] [PubMed] [Google Scholar]
- 37. Lim AM, Candiloro IL, Wong N, et al Quantitative methodology is critical for assessing DNA methylation and impacts on correlation with patient outcome. Clin Epigenetics. 2014; 6: 22. [DOI] [PMC free article] [PubMed] [Google Scholar]
- 38. Yu L, Liu C, Vandeusen J, et al Global assessment of promoter methylation in a mouse model of cancer identifies ID4 as a putative tumor‐suppressor gene in human leukemia. Nat Genet. 2005; 37: 265–74. [DOI] [PubMed] [Google Scholar]
- 39. Carey JP, Asirvatham AJ, Galm O, et al Inhibitor of differentiation 4 (Id4) is a potential tumor suppressor in prostate cancer. BMC Cancer. 2009; 9: 173. [DOI] [PMC free article] [PubMed] [Google Scholar]
- 40. Chen SS, Claus R, Lucas DM, et al Silencing of the inhibitor of DNA binding protein 4 (ID4) contributes to the pathogenesis of mouse and human CLL. Blood. 2011; 117: 862–71. [DOI] [PMC free article] [PubMed] [Google Scholar]
- 41. Papaemmanuil E, Gerstung M, Malcovati L, et al Clinical and biological implications of driver mutations in myelodysplastic syndromes. Blood. 2013; 122: 3616–27. [DOI] [PMC free article] [PubMed] [Google Scholar]
- 42. Bravo GM, Lee E, Merchan B, et al Integrating genetics and epigenetics in myelodysplastic syndromes: advances in pathogenesis and disease evolution. Br J Haematol. 2014; 166: 646–59. [DOI] [PMC free article] [PubMed] [Google Scholar]
- 43. Dan C, Chi J, Wang L. Molecular mechanisms of the progression of myelodysplastic syndrome to secondary acute myeloid leukaemia and implication for therapy. Ann Med. 2015; 47: 209–17. [DOI] [PubMed] [Google Scholar]
- 44. Wang H, Wang XQ, Xu XP, et al ID4 methylation predicts high risk of leukemic transformation in patients with myelodysplastic syndrome. Leuk Res. 2010; 34: 598–604. [DOI] [PubMed] [Google Scholar]
- 45. Kang H, Wang X, Gao L, et al Clinical implications of the quantitative detection of ID4 gene methylation in myelodysplastic syndrome. Eur J Med Res. 2015; 20: 16. [DOI] [PMC free article] [PubMed] [Google Scholar]
- 46. Woods BA, Levine RL. The role of mutations in epigenetic regulators in myeloid malignancies. Immunol Rev. 2015; 263: 22–35. [DOI] [PubMed] [Google Scholar]
- 47. Shih AH, Abdel‐Wahab O, Patel JP, et al The role of mutations in epigenetic regulators in myeloid malignancies. Nat Rev Cancer. 2012; 12: 599–612. [DOI] [PubMed] [Google Scholar]
- 48. Ilagan JO, Ramakrishnan A, Hayes B, et al U2AF1 mutations alter splice site recognition in hematological malignancies. Genome Res. 2015; 25: 14–26. [DOI] [PMC free article] [PubMed] [Google Scholar]
Associated Data
This section collects any data citations, data availability statements, or supplementary materials included in this article.
Supplementary Materials
Figure S1 Methylation density of ID4 in controls and MDS patients.
Figure S2 Methylation density of ID4 in controls and AML patients.
Figure S3 Relative expression levels of ID4 in controls and myeloid leukemia.
Figure S4 The impact of ID4 expression on overall survival (OS) in a cohort of 200 AML patients from The Cancer Genome Atlas (TCGA) databases.


