Abstract
The risk of radiation-induced toxicity in patients treated for head and neck (HN) cancer with radiation therapy (RT) is traditionally estimated by condensing the 3D dose distribution into a monodimensional cumulative dose-volume histogram which disregards information on dose localization. We hypothesized that a voxel-based approach would identify correlations between radiation-induced morbidity and local dose release, thus providing a new insight into spatial signature of radiation sensitivity in composite regions like the HN district. This methodology was applied to a cohort of HN cancer patients treated with RT at risk of radiation-induced acute dysphagia (RIAD). We implemented an inter-patient elastic image registration framework that proved robust enough to match even the most elusive HN structures and to provide accurate dose warping. A voxel-based statistical analysis was then performed to test regional dosimetric differences between patients with and without RIAD. We identified a significantly higher dose delivered to RIAD patients in two voxel clusters in correspondence of the cricopharyngeus muscle and cervical esophagus. Our study goes beyond the well-established organ-based philosophy exploring the relationship between radiation-induced morbidity and local dose differences in the HN region. This approach is generally applicable to different HN toxicity endpoints and is not specific to RIAD.
Introduction
In radiation therapy (RT) treatment planning (TP), the dose-volume histogram (DVH), introduced in the late 1970s1, has proved to be a valuable tool for summarizing a three-dimensional (3D) dose distribution in a two-dimensional (2D) graph. For practical reasons, most biological models developed in RT to predict tumor control or normal tissue side effects start with the target or organ-at-risk (OAR) DVH, respectively, rather than with the complete radiation dose distribution. This implies that the structures of interest are considered homogeneous, and, therefore, any spatial dose distribution information and possible inhomogeneity in regional organ radiosensitivity are disregarded. Also, different definition of the OARs may influence the toxicity prediction2.
After nearly 40 years, we have reached the maturity and computational tools to exploit the information included in the full 3D dose distribution. Recently, 2D or 3D methods for dose distribution analysis (dose mapping), collectively referred to as voxel-based (VB) methods, have tried to evaluate local dose response patterns beyond the organ-based philosophy, and have been proposed as alternative approaches to the DVH for identifying dose sensitive regions of normal tissue. These methods have been successfully applied to prostate and thoracic cancer patients3–8, but, to the best of our knowledge, no VB analysis has been performed on patients with tumors in the head and neck (HN) area.
RT is one of the most effective modalities for the treatment of HN cancers. However, because of the complex shape of target volumes in close proximity to sensitive organs, it may be associated with acute and late radiation morbidities such as xerostomia, mucositis and dysphagia affecting the patient’s quality of life9. Many studies have investigated dose-volume predictors as well as spatial dose metrics in order to minimize those radiation induced side effects10–14. However, many of these studies might be limited by a large spectrum of issues ranging from the difficulty or inconsistency in the delineation of the related OARs to the use of a single summary measure from the DVH. In particular, the definition and contouring of swallowing-related normal tissues (i.e., the pharyngeal constrictor muscles, base of tongue, supraglottic larynx, soft palate, cricopharyngeal muscle and cervical esophagus) can be time consuming and prone to inter- and intra-operator variations13, 15.
At the same time, the use of the intensity-modulated RT (IMRT) for HN cancer treatment as a standard technique calls for an afterthought in the definition of dose and volume constraints for plan optimization in order to take full advantage of IMRT improved therapeutic ratio. This issue is even more important in light of the recent introduction in TP systems of automated engines designed to create an optimized plan with minimal user interaction. In HN region, in particular, they proved able to further improve the clinical quality of IMRT plans and OAR sparing16, 17.
Given this background, the current study was designed to apply a VB analysis in order to explore the correlation between radiation induced acute dysphagia (RIAD) and local dose differences in a cohort of patients treated with RT for HN cancer. The VB approach relies on mapping all patient dose distributions into a single reference case anatomy, which serves as anchor for local dosimetric evaluations. Compared to other districts, the HN presents peculiar difficulties in the registration procedure, thus posing several challenges for the achievement of an accurate dose warping18, 19. We implemented an inter-patient elastic image registration (EIR) framework that proved robust enough to match even the most elusive structures involved in the investigated toxicity endpoint. Thereafter, a VB statistical analysis was performed to test dosimetric regional differences between patients with different outcomes. Finally, the application of the VB analysis in HN clinical TP optimization was verified.
Materials and Methods
Patient dataset
The patients analyzed in this study are part of a cohort of 100 subjects treated at the Department of Radiation Therapy of the European Institute of Oncology (Milano) for HN tumors, and prospectively evaluated for radiation-induced acute dysphagia (RIAD). The study was part of a research regarding image guided RT for HN cancer approved by the Ethical Committee of the European Institute of Oncology (Notification n. 94/11). All patients gave written informed consent. All experimental protocols and procedures were performed in accordance with the guidelines of the European Institute of Oncology. All clinical imaging data were used in anonymized form. Applied selection criteria included:
Curative RT for HN cancer associated or not with concurrent or induction chemotherapy;
No prior surgery in HN region;
No baseline mechanical dysphagia;
No clinically relevant weight loss in the 3 months prior to RT;
No requirement of enteral nutrition before RT.
A subset of 42 patients resulted eligible for the analysis. Twenty-three of these were treated with 3D conformal RT and the remaining 19 patients with IMRT. TP Computer Tomographic (CT) scans were acquired with an in-plane matrix of 512 × 512 and a slice thickness of 3 mm. Standard OARs, including oral cavity, larynx and esophagus for HN, were contoured according to RTOG 061520. Median total prescribed RT dose was 70 Gy (range: [64, 70] Gy) in daily fractions of 2 Gy. All patients but one received induction (6/42) or concurrent chemotherapy (35/42).
Nine patients developed a severe RIAD (CTCAE v.4.0 grade ≥3). Patient, disease and treatment-related characteristics were examined according to the development of RIAD by univariate statistical methods: categorical variables were tested by Pearson’s χ2-test or Fisher’s exact test when appropriate; continuous variables were tested by Mann-Whitney U-test. None of the considered clinical variables (gender, age, tumor stage and location, RT technique and chemotherapy) showed a significant correlation with RIAD. A detailed description of the patient and treatment characteristics has been reported elsewhere (submitted).
Data processing
Individual DICOM-RT plans (CT scans, dose maps, and contoured structures) were converted into a Matlab (MathWorks, Natick, MA) object using the Computational Environment for Radiation therapy Research software21.
The VB analysis, which entails
inter-patient normalization consisting in the registration of CT and dose for each patient to a common spatial reference
statistical analysis of regional dose differences between RIAD and non-RIAD patients’ groups,
was performed according to the scheme developed in Palma et al.5, as illustrated in the upper panel of Fig. 1.
Figure 1.
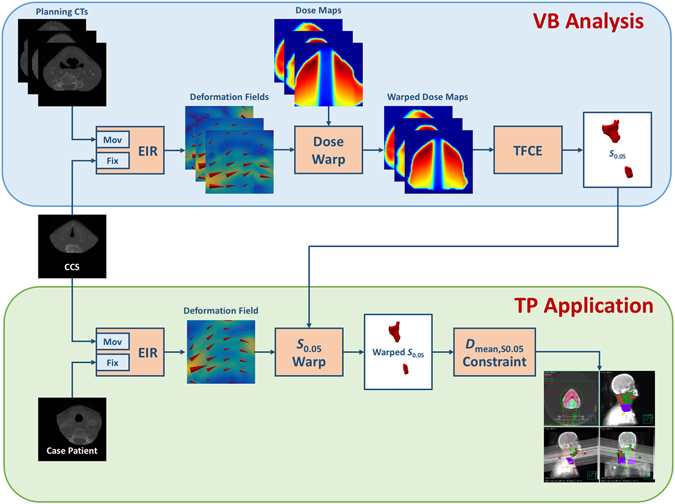
Schematic flowchart of the voxel-based (VB) analysis (upper panel) and of its treatment planning (TP) application (lower panel) in head and neck (HN) cancer patients. Planning CTs are registered to the common coordinate system (CCS) by an elastic image registration (EIR) tool. The obtained deformation fields are used to warp the dose maps into the CCS. A statistical mapping scheme (TFCE) is applied to extract the clusters of voxels (S 0.05) significantly associated with higher doses released in patients developing the radiation-induced toxicity. For any new HN patient (case patient), the S 0.05 region is warped as a new avoidance structure into the DICOM-RT object according to the deformation field that maps the CCS into the considered planning CT, and the corresponding mean dose (Dmean,S0.05) is used as planning constraint.
Briefly, a masked planning CT of each patient was registered to a common coordinate system (CCS) via a log-diffeomorphic demons approach22, an EIR tool that guarantees the invertibility of the deformation field. The mask was given by the intersection of the patient’s body structure with the dilation (by a spherical structuring element of 30 mm radius) of the union of oral cavity, larynx and esophagus. The obtained deformation fields were used to map the dose of each patient into the CCS. The dose warping accuracy was evaluated by Dice23, modified Hausdorff distance (MHD)24 and dose-organ overlap (DOO)3 scores.
Next, a preliminary significance analysis of the dose differences between groups was performed according to a non-parametric multiple comparison permutation test (104 permutations) by single maximum threshold, generally referred to as the normalized maximum dose difference, T max 25. Having obtained the evidence that a statistical regional difference holds, a statistical mapping scheme for non-parametric multiple permutation inference on dose maps with threshold-free cluster enhancement (TFCE)26 was applied in order to highlight the clusters of voxels significantly associated with higher doses released in RIAD patients, within the region of the swallowing related structures (superior, middle and inferior pharyngeal constrictor muscles, cricopharyngeal muscle, cervical esophagus, base of tongue, supraglottic and glottic larynx15) segmented in the CCS.
A set of subregions {S p} was thus defined as the family of the sublevel sets of the significance map in correspondence of the TFCE significance level p. A Receiver Operating Characteristic- (ROC) based test was performed on the mean doses {D m,i|i = 1, …, 42} extracted from S 0.05. Furthermore, the significance (p U) of the mean dose differences on S p between RIAD and non-RIAD patients was evaluated by a Mann-Whitney U test and plotted as function of p.
Treatment Planning application
In order to demonstrate the practical relevance of the above analysis, a new IMRT plan (Plan1) for an oropharyngeal cancer patient (not included within the analyzed cohort) was generated according to Merlotti et al.27 for dose prescription, OARs dose-volume objectives and plan optimization. Three dose levels were prescribed to planning target volumes (PTVs): 70 Gy (2 Gy/die) for macroscopic disease (PTV1), 63 Gy (1.8 Gy/die) for high risk areas (PTV2), and 58.1 Gy (1.66 Gy/die) for low risk areas (PTV3).
A second plan (Plan2) was generated as a re-optimization of Plan1 by using the S 0.05 structure as an avoidance region. For this purpose, the S 0.05 region was warped as a new structure into the patient DICOM-RT plan according to the deformation field that maps the CCS into the considered planning CT reference, estimated as before via log diffeomorphic demons. For the S 0.05 structure we imposed the constraint that the corresponding mean dose (Dmean,S0.05) would not exceed the first percentile on RIAD patients (lower panel of Fig. 1). In this regard, since the number of RIAD patients is relatively low (in particular, less than 100), the first percentile was estimated as
| 1 |
provided that the Kolmogorov-Smirnov test on indicates that Gaussianity held.
Both plans were implemented using Volumetric Modulated Arc Therapy (VMAT) technique with two 360°-arcs and nominal energy of 6MV. Plans were optimized by the automatic optimization module integrated in the TP system Pinnacle 9.10 (Philips Radiation Oncology Systems, Fitchburg, WI).
Data availability
The data analyzed in the present study are available at http://www.ibb.cnr.it/?command=viewcms&and2=80&id=187.
Results
The registration process resulted in a geometrically robust and accurate dose warping, as confirmed by visual inspection on CT images (Fig. 2). Indeed, the voxelwise average of the patients’ CTs resulted much sharper after EIR, compared to the blurred appearance of the mean original CT. Moreover, the comparison of medians and ranges of Dice, MHD and DOO scores, computed before and after EIR on the whole patient dataset, showed a consistent significant improvement of inter-patient match accuracy (Table 1).
Figure 2.
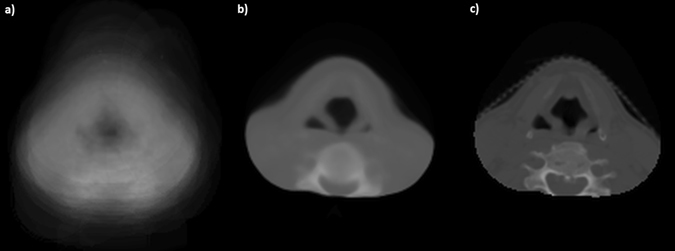
Elastic image registration (EIR) results. Average of the patient population computed tomographic scans (a) before EIR and (b) after EIR, compared to (c) the corresponding reference patient’s scan.
Table 1.
Registration scores for pre- and post-elastic image registration.
| Dice | MHD (mm) | DOO | ||||
|---|---|---|---|---|---|---|
| pre | post | pre | post | pre | post | |
| Median | 0.67 | 0.80 | 2.31 | 1.22 | 0.51 | 0.66 |
| Range | [0.03,0.83] | [0.59,0.82] | [0.53,24.13] | [0.78,4.46] | [0.02,0.68] | [0.46,0.76] |
| p-value§ | <10−5 | <10−4 | <10−6 | |||
Abbreviations: MHD, Modified Housdorff Distance; DOO, Dose-Organ Overlap. § p-values express the significance of the interpatient match improvement at Wilcoxon signed rank test.
A significantly higher dose was delivered to RIAD patients, given a p = 0.038 value of the T max statistic. The S 0.05 overall volume of 5.1 cm3 was located in two voxel-clusters in correspondence of the cricopharyngeus muscle and cervical esophagus (Figs 3 and 4). The area under the ROC curve (AUC) from the mean dose on S 0.05 (D m,i) resulted to be 0.81 (95% CI: [0.67, 0.95]). On RIAD patients, D m,i ranged from 38 Gy to 58 Gy (median = 48 Gy) while on non-RIAD patients, D m,i ranged from 10 Gy to 57 Gy (median = 33 Gy); at a Mann-Whitney U test the two distributions were significantly different (p = 0.003). Interestingly, the significance p U of the mean dose differences between RIAD and non-RIAD patients within S p subregions showed a global maximum (i.e. p U attains a minimum) roughly in correspondence of p = 0.05 (Fig. 5).
Figure 3.
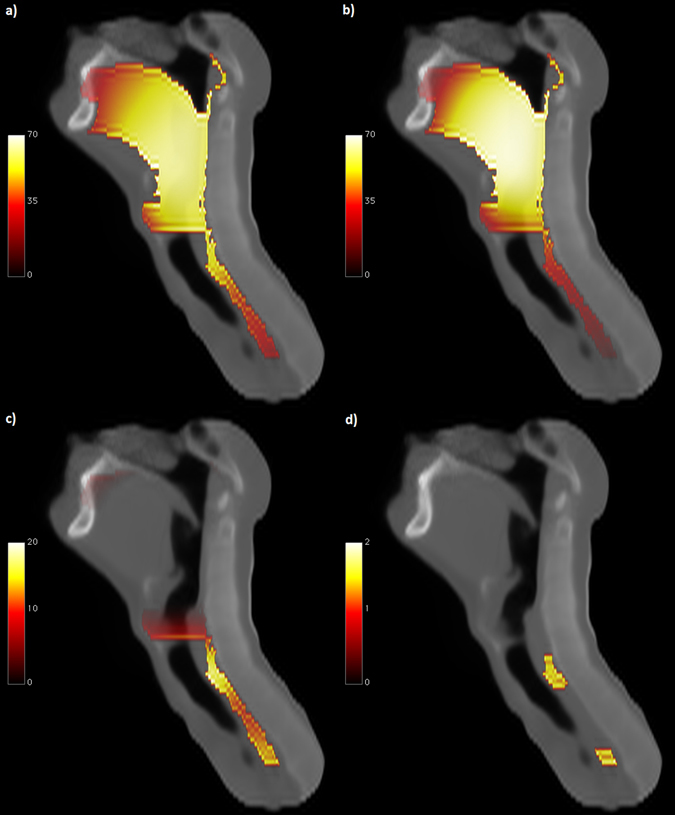
Dose distribution differences. Sagittal view of: mean dose map (Gy) for patients (a) who experienced radiation-induced acute dysphagia and (b) who did not; (c) corresponding dose difference map; (d) subregions showing a statistically significant dose difference between groups (p < 0.05) according to TFCE permutation test (the color map represents -Log p).
Figure 4.
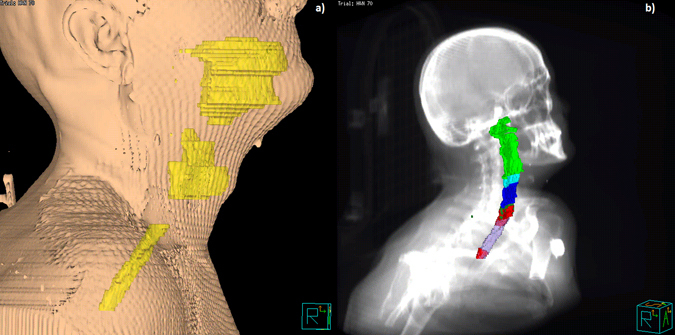
Volume rendering of head and neck structures in the common coordinate system: (a) 3D body rendering of the reference patient along with the three structures (yellow) used to derive the registration mask (oral cavity, larynx and esophagus); (b) 3D rendering of the superior (light green), middle (cyan) and inferior (blue) pharyngeal constrictor muscles, the cricopharyngeus muscle (forest green) and the cervical esophagus (violet), along with the S 0.05 structure (red), superimposed on the Digital Reconstructed Radiograph.
Figure 5.
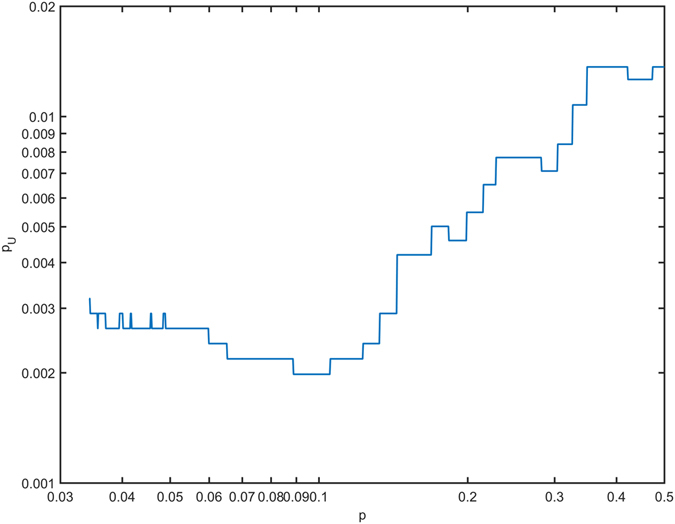
Discriminating power of mean dose in S p subregions. Significance (p U), as evaluated by a Mann-Whitney U test, of the mean dose differences on S p between patients who developed toxicity and who did not.
The p-value computed according to Kolmogorov-Smirnov test on was 0.99, thus confirming that mean dose values in RIAD patients followed a Gaussian distribution. The first percentile of the distribution was thus estimated by equation (1) to be equal to 30.5 Gy.
The introduction of the S 0.05 structure in Plan2 and the additional requirement in the optimization procedure that Dmean,S0.05 does not exceed 30.5 Gy led to a large sparing of the S 0.05 (Dmean,S0.05: 30.4 Gy on Plan2 vs. 39.1 Gy on Plan1) at the cost of a negligible loss in the PTVs compared to Plan1 without jeopardizing the attainment of OAR objectives (Fig. 6).
Figure 6.
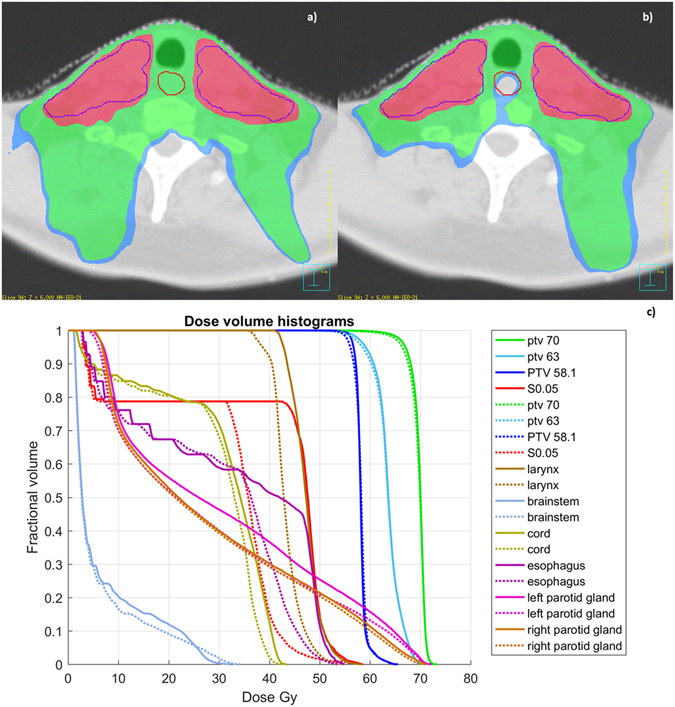
Treatment plan optimization. Plan1 (a) and Plan2 (b) dose distributions (the red line is the S 0.05 structure) along with the comparative dose-volume histograms (c) for planning target volumes, organs at risk and the S 0.05 structure (solid lines for Plan1 and dashed lines for Plan2). In the color wash, the blue, green and red regions correspond to 36 Gy, 38 Gy and 55.2 Gy dose levels, respectively.
Discussion
We established a comprehensive pipeline for the application of a VB approach to explore and to exploit the relationship between local dose release and radiation induced morbidity (Fig. 1). In particular, we implemented a procedure to assess local dose differences potentially associated to the development of RIAD. The developed tool was applied to a cohort of HN cancer patients treated with definitive RT and the identified significant subregion was subsequently used for TP optimization purpose in a representative patient.
The technological RT developments, such as IMRT, have contributed to improve local tumor control in HN cancer patients, but also to reduce normal tissue doses, thus preventing radiation-induced side effects. Radiation induced toxicities in HN structures remain however the major dose-limiting factors and many survivors must cope with long-term effects of radiation treatments negatively impacting their quality of life. Besides radiation induced xerostomia, the swallowing dysfunction (i.e. dysphagia) is becoming one of the most relevant side effects of HN RT, more frequently observed in association with concomitant chemotherapy12, 13. Numbers of studies identified the DVH-parameters associated with both acute and late dysphagia in curative HN RT11–14, 28–30. Interestingly, acute dysphagia was a strong prognostic factor for late dysphagia31. However, most of those studies applied an organ-based approach that relies on identifying the multiple muscles and structures involved in the swallowing dysfunction, thus leading to a huge amount of dosimetric parameters and to the inherent well-known overfitting issue11, 13. In addition, the tiny and elusive swallowing related OARs exhibit a poor contrast on planning CTs (e.g. the cricopharyngeus and the three levels of pharyngeal constrictor muscles), hence posing concrete risks of structure misclassification. Indeed, the studies available in literature reported heterogeneous results concerning the dose parameters predictive for late or acute dysphagia.
It is our belief that a possible solution to this conundrum is represented by a reversed, i.e. holistic, approach to the radiation-induced toxicity analysis. Instead of splitting further and further the organs into their substructures, the VB approach allows for a blind identification of the involved regions, irrespective of their anatomical classification.
VB analyses have long been exploited in several neuroimaging frameworks, and the underlying philosophy has been recently introduced in the RT toxicity studies. The correlation between regional dose deposition and a toxicity outcome has been explored for a few organs, such as bladder, rectum and lungs3–8.
One of the major issues of the VB approach consists in the massive multiple comparison problem, which hinders a straightforward application of standard statistical tests, such as parametric (t) or non-parametric (Mann-Whitney) hypothesis tests. Solutions are available from the neuroimaging literature32; in this respect, we here adopted the non-parametric permutation inference coupled to the TFCE method26, which is particularly effective to enhance areas of signal that exhibit some spatial contiguity without relying on hard-threshold-based clustering.
The other central issue of the VB analysis concerns the inter-patient registration strategy adopted to anchor all the dose distributions to a common anatomical reference, which greatly impacts on the dose warping accuracy. In this study we implemented a multi-resolution version of the log-diffeomorphic demons approach22 which emerged as a highly performing scheme in the HN district according to Rigaud et al.18, 19. Indeed, the visual inspection of Fig. 2 as well as the Dice and MHD scores, reported in Table 1, indicates that the registration process was geometrically robust. Similarly, the DOO index shows that the method is accurate in dose warping.
The joint application of registration process and statistical mapping led to the identification of a regional dose-RIAD relationship. Interestingly, the highlighted statistically significant subregion S 0.05 is located in correspondence of the cricopharyngeus muscle and cervical esophagus (Figs 3 d and 4b), with a median dose of 48 Gy in RIAD patients compared to the median dose of 33 Gy released to non-RIAD patients. The ROC analysis revealed a good prediction performance (AUC = 0.8) of the mean dose extracted from the subregion S 0.05. Of note, Otter et al.13 found that mean dose to inferior pharyngeal constrictor muscles, immediately above the upper cluster in S 0.05, is correlated with grade 3 acute dysphagia. Differently, the dose to the 2% of the superior pharyngeal constrictor was found to be a dosimetric predictor for the same endpoint by De Ruyck et al.12.
The evidence of a correlation between the dose delivered in a specific region of the swallowing-involved organs and the RIAD onset can be exploited to construct an avoidance criterion in the planning optimization strategy. The findings obtained by the statistical mapping analysis indeed allowed for an optimization of the TP procedure in a HN cancer patient external to the analyzed cohort. Furthermore, we demonstrated the practical feasibility of a S 0.05 sparing plan (Plan2) within an IMRT framework (Fig. 6). In particular, the auto-planning engine coupled with the VMAT technique was applied to an oropharyngeal cancer patient with and without the S 0.05 mean dose constraint. By adding the Dmean,S0.05 <30.5 Gy to the standard OAR optimization goals for the HN cancer IMRT and with only one single optimization cycle, we succeeded to sharply decrease the mean dose to the S 0.05 structure and even to improve the sparing of all the OARs involved as it can be observed in Fig. 6c.
Remarkably, the presented results were obtained thanks to the heterogeneity of dose distribution within the considered cohort. Should the doses to the subregion S 0.05 be lowered by a dedicated TP scheme, it may be expected that the incidence and severity of RIAD would be accordingly reduced, thus allowing the proposed method to provide knowledge on milder grade of radiation induced toxicities.
In conclusion, the VB method applied to HN tumor patients treated with RT successfully allowed to identify HN regions correlated with radiation-induced morbidity and, as such, it might be included in the IMRT optimization strategy. Overall, the proposed approach may provide new insights into spatial signature of radiation sensitivity in a highly composite region such as the HN district. The practical relevance of the VB analysis in HN clinical TP optimization was also demonstrated.
Author Contributions
L.C. and G.P. conceived and designed the study. M.G., G.M., D.C., B.A.J.F., D.A. and R.P. participated in patient recruitment and collected the data. V.D.A. checked the data integrity. S.M., G.P., L.C. processed and analyzed the data. S.M., G.P., L.C. wrote the paper. All authors have reviewed the final manuscript.
Competing Interests
The authors declare that they have no competing interests.
Footnotes
Serena Monti and Giuseppe Palma contributed equally to this work.
Daniela Alterio and Laura Cella jointly supervised this work.
Publisher's note: Springer Nature remains neutral with regard to jurisdictional claims in published maps and institutional affiliations.
References
- 1.Shipley WU, et al. Proton radiation as boost therapy for localized prostatic carcinoma. JAMA. 1979;241:1912–5. doi: 10.1001/jama.1979.03290440034024. [DOI] [PubMed] [Google Scholar]
- 2.Huang BT, et al. Different definitions of esophagus influence esophageal toxicity prediction for esophageal cancer patients administered simultaneous integrated boost versus standard-dose radiation therapy. Sci Rep. 2017;7:120. doi: 10.1038/s41598-017-00168-x. [DOI] [PMC free article] [PubMed] [Google Scholar]
- 3.Acosta O, et al. Voxel-based population analysis for correlating local dose and rectal toxicity in prostate cancer radiotherapy. Phys Med Biol. 2013;58:2581–95. doi: 10.1088/0031-9155/58/8/2581. [DOI] [PMC free article] [PubMed] [Google Scholar]
- 4.Wortel RC, et al. Dose-surface maps identifying local dose-effects for acute gastrointestinal toxicity after radiotherapy for prostate cancer. Radiother Oncol. 2015;117:515–20. doi: 10.1016/j.radonc.2015.10.020. [DOI] [PubMed] [Google Scholar]
- 5.Palma G, et al. A Voxel-Based Approach to Explore Local Dose Differences Associated With Radiation-Induced Lung Damage. Int J Radiat Oncol Biol Phys. 2016;96:127–33. doi: 10.1016/j.ijrobp.2016.04.033. [DOI] [PMC free article] [PubMed] [Google Scholar]
- 6.Palorini F, et al. First application of a pixel-wise analysis on bladder dose-surface maps in prostate cancer radiotherapy. Radiother Oncol. 2016;119:123–8. doi: 10.1016/j.radonc.2016.02.025. [DOI] [PubMed] [Google Scholar]
- 7.Yahya N, et al. Modeling Urinary Dysfunction After External Beam Radiation Therapy of the Prostate Using Bladder Dose-Surface Maps: Evidence of Spatially Variable Response of the Bladder Surface. Int J Radiat Oncol Biol Phys. 2017;97:420–426. doi: 10.1016/j.ijrobp.2016.10.024. [DOI] [PubMed] [Google Scholar]
- 8.McWilliam A, Faivre-Finn C, Kennedy J, Kershaw L, van Herk M. Data Mining Identifies the Base of the Heart as a Dose-Sensitive Region Affecting Survival in Lung Cancer Patients. International Journal of Radiation Oncology Biology Physics. 2016;96:S48–S49. doi: 10.1016/j.ijrobp.2016.06.128. [DOI] [Google Scholar]
- 9.de Figueiredo BH, Grégoire V. How to minimize morbidity in radiotherapy of pharyngolaryngeal tumors? Current opinion in otolaryngology & head and neck surgery. 2016;24:163–169. doi: 10.1097/MOO.0000000000000235. [DOI] [PubMed] [Google Scholar]
- 10.Buettner F, et al. Novel approaches to improve the therapeutic index of head and neck radiotherapy: an analysis of data from the PARSPORT randomised phase III trial. Radiother Oncol. 2012;103:82–7. doi: 10.1016/j.radonc.2012.02.006. [DOI] [PubMed] [Google Scholar]
- 11.Christianen ME, et al. Predictive modelling for swallowing dysfunction after primary (chemo)radiation: results of a prospective observational study. Radiother Oncol. 2012;105:107–14. doi: 10.1016/j.radonc.2011.08.009. [DOI] [PubMed] [Google Scholar]
- 12.De Ruyck K, et al. A predictive model for dysphagia following IMRT for head and neck cancer: introduction of the EMLasso technique. Radiother Oncol. 2013;107:295–9. doi: 10.1016/j.radonc.2013.03.021. [DOI] [PubMed] [Google Scholar]
- 13.Otter S, et al. Evaluation of the Risk of Grade 3 Oral and Pharyngeal Dysphagia Using Atlas-Based Method and Multivariate Analyses of Individual Patient Dose Distributions. Int J Radiat Oncol Biol Phys. 2015;93:507–15. doi: 10.1016/j.ijrobp.2015.07.2263. [DOI] [PubMed] [Google Scholar]
- 14.Dean JA, et al. Normal tissue complication probability (NTCP) modelling using spatial dose metrics and machine learning methods for severe acute oral mucositis resulting from head and neck radiotherapy. Radiother Oncol. 2016;120:21–7. doi: 10.1016/j.radonc.2016.05.015. [DOI] [PMC free article] [PubMed] [Google Scholar]
- 15.Christianen ME, Langendijk JA, Westerlaan HE, van de Water TA, Bijl HP. Delineation of organs at risk involved in swallowing for radiotherapy treatment planning. Radiother Oncol. 2011;101:394–402. doi: 10.1016/j.radonc.2011.05.015. [DOI] [PubMed] [Google Scholar]
- 16.Krayenbuehl J, Norton I, Studer G, Guckenberger M. Evaluation of an automated knowledge based treatment planning system for head and neck. Radiat Oncol. 2015;10:226. doi: 10.1186/s13014-015-0533-2. [DOI] [PMC free article] [PubMed] [Google Scholar]
- 17.Hazell I, et al. Automatic planning of head and neck treatment plans. J Appl Clin Med Phys. 2016;17:5901. doi: 10.1120/jacmp.v17i1.5901. [DOI] [PMC free article] [PubMed] [Google Scholar]
- 18.Rigaud B, et al. Evaluation of deformable image registration methods for dose monitoring in head and neck radiotherapy. Biomed Res Int. 2015;2015:726268. doi: 10.1155/2015/726268. [DOI] [PMC free article] [PubMed] [Google Scholar]
- 19.Nithiananthan S, et al. Demons deformable registration for CBCT-guided procedures in the head and neck: convergence and accuracy. Med Phys. 2009;36:4755–64. doi: 10.1118/1.3223631. [DOI] [PMC free article] [PubMed] [Google Scholar]
- 20.Lee NY, et al. Addition of bevacizumab to standard chemoradiation for locoregionally advanced nasopharyngeal carcinoma (RTOG 0615): a phase 2 multi-institutional trial. Lancet Oncol. 2012;13:172–80. doi: 10.1016/S1470-2045(11)70303-5. [DOI] [PMC free article] [PubMed] [Google Scholar]
- 21.Deasy JO, Blanco AI, Clark VH. CERR: a computational environment for radiotherapy research. Med Phys. 2003;30:979–85. doi: 10.1118/1.1568978. [DOI] [PubMed] [Google Scholar]
- 22.Vercauteren, T., Pennec, X., Perchant, A. & Ayache, N. Symmetric log-domain diffeomorphic registration: A demons-based approach. In International Conference on Medical Image Computing and Computer-Assisted Intervention 754–761 (Springer, 2008). [DOI] [PubMed]
- 23.Dice LR. Measures of the amount of ecologic association between species. Ecology. 1945;26:297–302. doi: 10.2307/1932409. [DOI] [Google Scholar]
- 24.Dubuisson, M. P. & Jain, A. K. In Pattern Recognition, 1994. Vol. 1-Conference A: Computer Vision & Image Processing., Proceedings of the 12th IAPR International Conference on 566–568 (IEEE, 1994).
- 25.Chen C, Witte M, Heemsbergen W, van Herk M. Multiple comparisons permutation test for image based data mining in radiotherapy. Radiat Oncol. 2013;8:293. doi: 10.1186/1748-717X-8-293. [DOI] [PMC free article] [PubMed] [Google Scholar]
- 26.Smith SM, Nichols TE. Threshold-free cluster enhancement: addressing problems of smoothing, threshold dependence and localisation in cluster inference. Neuroimage. 2009;44:83–98. doi: 10.1016/j.neuroimage.2008.03.061. [DOI] [PubMed] [Google Scholar]
- 27.Merlotti A, et al. Technical guidelines for head and neck cancer IMRT on behalf of the Italian association of radiation oncology - head and neck working group. Radiat Oncol. 2014;9:264. doi: 10.1186/s13014-014-0264-9. [DOI] [PMC free article] [PubMed] [Google Scholar]
- 28.Christianen ME, et al. Patterns of long-term swallowing dysfunction after definitive radiotherapy or chemoradiation. Radiother Oncol. 2015;117:139–44. doi: 10.1016/j.radonc.2015.07.042. [DOI] [PubMed] [Google Scholar]
- 29.Mazzola R, et al. Dose-volume-related dysphagia after constrictor muscles definition in head and neck cancer intensity-modulated radiation treatment. Br J Radiol. 2014;87:20140543. doi: 10.1259/bjr.20140543. [DOI] [PMC free article] [PubMed] [Google Scholar]
- 30.Sanguineti G, et al. Weekly dose-volume parameters of mucosa and constrictor muscles predict the use of percutaneous endoscopic gastrostomy during exclusive intensity-modulated radiotherapy for oropharyngeal cancer. Int J Radiat Oncol Biol Phys. 2011;79:52–9. doi: 10.1016/j.ijrobp.2009.10.057. [DOI] [PubMed] [Google Scholar]
- 31.van der Laan HP, et al. Acute symptoms during the course of head and neck radiotherapy or chemoradiation are strong predictors of late dysphagia. Radiother Oncol. 2015;115:56–62. doi: 10.1016/j.radonc.2015.01.019. [DOI] [PubMed] [Google Scholar]
- 32.Friston, K. J., Ashburner, J. T., Kiebel, S. J., Nichols, T. E. & Penny, W. D. Statistical parametric mapping: the analysis of functional brain images (Academic press, 2011).
Associated Data
This section collects any data citations, data availability statements, or supplementary materials included in this article.
Data Availability Statement
The data analyzed in the present study are available at http://www.ibb.cnr.it/?command=viewcms&and2=80&id=187.


