

Abstract
Glucocorticoid stress hormones, such as corticosterone (CORT), have profound effects on the behaviour and physiology of organisms, and thus have the potential to alter host competence and the contributions of individuals to population- and community-level pathogen dynamics. For example, CORT could alter the rate of contacts among hosts, pathogens and vectors through its widespread effects on host metabolism and activity levels. CORT could also affect the intensity and duration of pathogen shedding and risk of host mortality during infection. We experimentally manipulated songbird CORT, asking how CORT affected behavioural and physiological responses to a standardized West Nile virus (WNV) challenge. Although all birds became infected after exposure to the virus, only birds with elevated CORT had viral loads at or above the infectious threshold. Moreover, though the rate of mortality was faster in birds with elevated CORT compared with controls, most hosts with elevated CORT survived past the day of peak infectiousness. CORT concentrations just prior to inoculation with WNV and anti-inflammatory cytokine concentrations following viral exposure were predictive of individual duration of infectiousness and the ability to maintain physical performance during infection (i.e. tolerance), revealing putative biomarkers of competence. Collectively, our results suggest that glucocorticoid stress hormones could directly and indirectly mediate the spread of pathogens.
Keywords: glucocorticoid, competence, tolerance, resistance, transmission
1. Introduction
Glucocorticoid stress hormones, such as corticosterone (CORT), orchestrate behavioural and physiological changes that allow animals to cope with and recover from adversity [1,2]. For example, CORT can enhance anti-predator behaviours [3], sharpen cognitive abilities and short-term memory formation [2], upregulate some aspects of immunity [1,2], and activate tissue repair mechanisms [1,2,4]. However, when a stressor perturbs an organism away from homeostasis for an extended period of time (e.g. days to weeks), CORT and related hormones can also mediate a cascade of negative effects including reduced growth [5], diminished reproductive success [6], impaired memory and cognition [7], and immunosuppression [1,2,4]. Indeed, glucocorticoids and other stress hormones are well-known mediators of disease susceptibility through their impacts on the immune system. However, their wide-ranging effects on multiple target tissues also suggest that they could play a far more extensive role in host–pathogen dynamics. Our interest in this study was to discern whether and how CORT influences the propensity of an individual bird to generate new infections in susceptible hosts and/or vectors.
One major effect of CORT is the mobilization of glucose reserves into the bloodstream [2]. In some animals, this physiological change facilitates an increase in locomotor activity [8,9], intensity and duration of post-fasting feeding behaviours [10], and foraging behaviour and parental provisioning effort [11]. These behavioural modifications could all alter the frequency of contacts among hosts, pathogens and vectors. CORT also influences aggressive interactions [12–14], territorial defence [15], and mating and other reproductive behaviours [1,16]. CORT therefore is apt to affect both intra- and interspecific interactions, which could be important in multi-host pathogen systems. Recently, we reported that a common mosquito vector of West Nile virus, Culex quinquefasciatus, preferentially feeds on songbirds with high CORT despite their higher defensive behaviours (in birds with elevated CORT, relative to controls) towards mosquitoes [17]. Specific mechanisms driving this vector preference are currently unknown, but could be related to metabolic changes associated with elevated CORT, including elevated CO2 output, host body temperature, or altered host volatile profiles [18].
CORT can also increase the chances that a host becomes infected upon exposure to a pathogen (e.g. susceptibility) and affect the intensity and duration of such an infection [1,2,4], which has direct implications for host competence and transmission dynamics [19]. Whereas many types of host defences against pathogens are influenced by glucocorticoids [2], factors that initiate and subsequently resolve inflammation are among the most important, as changes to these factors alter the trajectory of host outcomes (i.e. pathogen control and/or morbidity and mortality) during infection [20]. Small, short-duration elevations in CORT can be protective, potentiating modest but effective inflammatory responses [1,2]. Over longer periods, though, CORT tends to shift host defences away from inflammation, which could reduce resistance—the ability to reduce and/or clear pathogen burden [1,2]. In such circumstances, hosts might succumb to pathogens, dying fairly soon after exposure; alternatively, hosts might come to tolerate pathogens [20,21] by minimizing collateral damage and other negative side-effects associated with inflammation [22]. Such a bias towards pathogen tolerance (i.e. alleviation of pathogen effects on health and fitness without affecting pathogen burden) could have profound implications for health outcomes and disease dynamics [22,23]. Individuals with highly tolerant phenotypes could sustain infections for long periods of time without reductions in behaviours that facilitate transmission [21–25].
Here, our goal was to assess the role of CORT in generating a West Nile virus (WNV) superspreader phenotype. Superspreaders comprise the small proportion of populations responsible for the majority of new cases of infections; indeed, they probably contribute strongly to the recurrent observation that 20% of individuals tend to generate 80% of secondary infections [19,26–28]. We hypothesized that CORT would enhance competence to transmit WNV by exacerbating and extending the duration of host infectiousness. We also hypothesized that birds with elevated CORT would display high performance during viral infection, as a result of damped inflammation. We examined the predictive capacity of pre-infection circulating concentrations of CORT as well as post-infection inflammatory and anti-inflammatory cytokines (interferon-gamma; IFN-γ and interleukin-10; IL-10, respectively) in the blood of infected birds for individual resistance to and tolerance of WNV. Qualitative and quantitative relationships between these measures and within-host infection dynamics could reveal biomarkers of host competence, and provide additional insight for predicting where and when pathogens are most likely to emerge.
2. Material and methods
We used laboratory-reared adult male and female zebra finches (Taeniopygia guttata) for experiments (N = 30; n = 10 per treatment). See the electronic supplementary material, Supplementary Methods, for more detailed information about avian husbandry.
(a). Corticosterone implant surgery
Levels of CORT, the main avian glucocorticoid, were altered via implantation of either empty or one or two CORT-filled silastic tubes (Sigma Aldrich, St Louis, MO, product 27840; 7 mm long; inner diameter 1.5 mm, Dow Corning, Midland MI, product 508-006) according to Ouyang et al. [29] and identically to Gervasi et al. [17]. Birds receiving either one or two implants are hereafter referred to as belonging to ‘CORT+’ and ‘CORT++’ treatments (n = 10 in each treatment group); we used two CORT treatments in an attempt to simulate the complex effects of CORT on host immune defences and behaviours [17]. We quantified CORT concentrations in finches 3 days after implant surgery and on the same day as, and immediately prior to, viral inoculations. We measured CORT concentrations of birds with enzyme immunoassay (EIA) kits (Arbor Assays, Ann Arbor, MI, product K014-h5). We ran samples in duplicate and extrapolated concentration values from a standard curve. All samples were observed to fall within our standard curve and all samples were run on a single EIA plate. Intra-assay variation (the coefficient of variation among standards within the assay) was 4.84%. Sensitivity for the assay was approximately 114 pg ml−1. For more information about experimental hormone manipulation and validation, see electronic supplementary material, Supplementary Methods, figure S1 (see also [17]).
(b). West Nile virus inoculation and quantification in circulation
Three days after hormonal manipulation and immediately following an initial blood draw (approx. 20–30 µl of whole blood) to assess circulating CORT concentrations, we inoculated birds with a low-passage WNV 1999 isolate, 16399-3 (obtained from the US Geological Survey, National Wildlife Health Center), collected from an American crow (Corvus brachyrhynchos) liver, lung and kidney pool. We determined inoculate viral titre with a Vero cell plaque assay [30]. Each bird was inoculated subcutaneously above the right pectoral muscle with 100 µl of 108 PFU ml−1 WNV (i.e. 107 PFU total inoculate). This dosage was determined in previous pilot studies to be an infectious but sub-lethal dose of our strain of WNV in adult zebra finches from our colony. Doses in this range have also been used in previous comparative experimental studies with songbirds [31]. WNV aliquots were maintained and suspended for inoculation in BA-1 diluent [32]. We sampled serum (approx. 20–30 μl) from birds on 2, 4, 6 and 14 days post-inoculation (dpi) to quantify viral burden (i.e. viremia). We quantified viral burden in finches with quantitative-PCR. Each plate was run with a standard curve of WNV stock (same inoculate used to infect finches) that was quantified by Vero cell plaque assay. Serum samples from finches were observed to fall within the range of standard curves. See electronic supplementary material, Supplementary Methods, for additional information about WNV quantification.
(c). Behavioural performance trials to quantify West Nile virus tolerance
We hypothesized that host physical performance would change after exposure to WNV inoculations and that these changes in performance could be related to CORT exposure, and might be associated with host competence to transmit new infections. Just prior to serum sample collection on days 2 and 4 post-inoculation, we performed behavioural trials and collected body mass on all finches. We assessed vertical flight ability first by placing finches individually in a Plexiglas flight chamber (dimensions 115 cm height × 21.5 cm width × 21.5 cm depth) with a marked ruler running up the side to enable rapid visual observation of flight height [33]. The flight chamber was out of view by investigators and other birds, behind a curtain. After a 1 min acclimation period where birds could not view investigators, the curtain was drawn back, causing a startle flight response. For each individual, we measured the height of two consecutive flight events separated by a 1 min recovery period within the flight chamber (e.g. two trials per bird, averaged for our final performance metric at 2 dpi and 4 dpi).
(d). Cytokine expression quantification
We measured circulating levels of two cytokines (interferon-gamma, IFN-γ; and interleukin-10, IL-10) in the blood of infected birds for individual resistance and tolerance of WNV. Sampling time points were the same as those for viremia, although blood for viremia and cytokine assessment was kept separately (the latter preserved immediately in RNA-later solution). We chose IFN-γ because it is critical in early stages of WNV infection and can affect within-host infection trajectories [34]; we chose IL-10 because it counterbalances the inflammatory effects of IFN-γ and a suite of other pro-inflammatory cytokines [35,36], and may be responsive to CORT. In addition to examining these cytokines independently (average expression levels), we also considered the predictive capacity of the ratio of pro- to anti-inflammatory mediators within individual birds [37]. See electronic supplementary material, Supplementary Methods, for more information about cytokine sampling and processing.
(e). Estimates of individual tolerance
To estimate host tolerance, we first log10-transformed flight data; body mass did not require transformation to meet normality assumptions. Population-level tolerance was then calculated using a linear mixed model with flight performance or body mass (average for 2 and 4 dpi) as the dependent variable and log10-transformed viremia (2 and 4 dpi average) as a predictor. In mass tolerance models, body mass prior to WNV inoculations was also used as a proxy for vigour, and included as an additional dependent variable. Average viremia (for 2 and 4 dpi) and bird ID were used as random variables. Tolerance estimates (i.e. individual slope coefficients) were then extracted from the population models, separately for body mass and flight performance. This method of estimating individual tolerance allows the slope of relationships between viremia and performance (but not the intercept) to vary among individuals but also accounts for the population average (i.e. main effect of CORT treatment on viremia/performance relationship).
(f). Calculation of number of days infectious
To assess the number of days each host was infectious with WNV, we estimated the number of days viral burden exceeded the established 105 PFU ml−1 transmission threshold for individual birds [31,38]. Viral burdens on 2, 4 and 6 and 14 dpi for each bird were retrieved from the output of quantitative PCR analysis (viral burdens on day 0 were assumed to be zero, since no previous exposure to the virus occurred, and finches were laboratory-reared). Thus, a curve was created based on five time points over two weeks. Birds with viral burdens below 105 PFU ml−1 at all time points were considered infectious for zero days. For birds that exceed the 105 threshold, the slope and intercept of the relationship between viral burden and time were calculated for the time points immediately before, during and after surpassing 105 PFU ml−1. Slope was calculated using the basic formula m = (y2 − y1)/(t2 − t1), and intercept was estimated via the formula a = −mt + y. Using the slope and intercept to generate the equation of a line, the time at which viral burden crosses 105 PFU ml−1 was estimated with the formula x = (y − a)/m, with y = 5. The time at which burden initially crossed the threshold was subtracted from the time at which burden fell below the threshold of 105 PFU ml−1. For birds that died in between sampling days, but that were above the threshold at their final sampling time point, the time at which viral burden initially crossed the threshold was subtracted from day of death.
(g). Data analysis
Statistics were carried out in R v. 3.2.3 [39]. We considered two types of models in our analysis. In the first type, we asked about categorical, treatment-level effects of CORT on host survival, viremia, cytokine levels, performance and tolerance (the viremia–performance relationship). We used Kaplan–Meier curves to display treatment-level survival rates and Cox proportional hazards models (‘survival’ package in R [40]) to examine statistical predictors of survival rate. In addition to treatment, we included peak IFN-γ and peak IL-10 expression (highest expression levels observed between 2 and 4 dpi, log10 transformed) as fixed predictors in survival models and summarized results using likelihood ratio test values (obtained using the ‘Anova’ function in R package ‘car’ [41]) and hazard ratio (HR) estimates ± s.e. from the model summary. To examine the effect of CORT treatment and sampling time as predictors of host viremia (log transformed PFU ml−1 of WNV in serum), we used mixed effects models (‘lmer’ function in R package ‘lme4’ [42]). Treatment and time were treated as fixed factors, individual ID was used as a random effect, and we also investigated the interaction between treatment and time in the host viremia model. We summarized results using type II Wald χ2 values and associated p-values (and also confirmed significant interactive effects with type III tests, ‘Anova’ function in R package ‘car’ [41]). We also provide tables of estimates from the model (indicated as β) ± s.e. in the Supplementary Results file (electronic supplementary material, table S1). We used linear mixed models (‘lmer’ function in R package ‘lme4’ [42]) to examine whether CORT treatment and time could predict host cytokine levels. We used separate generalized mixed models (Gaussian distribution, log link; ‘glmer’ function in R package ‘lme4’ [42]) and linear mixed models to examine whether CORT treatment and time predicted host flight performance and changes in host body mass, respectively. For linear and generalized models, individual ID was a random factor and results were summarized with type II Wald χ2 values (‘Anova’ function in R package ‘car’ [41]). We examined whether CORT treatment and the two cytokines, IFN-γ and IL-10, predicted host tolerance estimates (i.e. slope coefficients for individual regressions of performance on viremia over the course of infection for all 30 birds) with linear models and summarize results using type II analysis of variance F tests. We summarized results of the generalized and linear mixed models using type II Wald χ2 values tests for main effects (‘Anova’ function in R package ‘car’ [41]). We also visualized relationships among factor levels using the R package ‘effects’ [43].
We also considered a second group of predictive models using (i) individual CORT concentration values (ng ml−1) obtained after hormone implantation, but just prior to WNV inoculation, and (ii) peak peripheral cytokine levels (2 or 4 days after WNV exposure) as possible predictors of host competence. Specifically, we separated competence into (i) duration of infectiousness (e.g. the number of days a host was observed with viremia levels at or above the 105 PFU ml−1 threshold [31,38]) and (ii) tolerance (e.g. the individual-level estimates relating individual flight or mass performance with viremia). Both models exclusively considered hosts who attained viremia above the transmission threshold; this included CORT+ and CORT++ birds only [31–38,44]. For the infectiousness model, the estimated number of days infectious were treated as integers (counts) and treated as the dependent variable in a zero-inflated regression model with a Poisson distribution (‘glmmadmb’ function in R package ‘glmmADMB’ [45,46]; electronic supplementary material, table S2). A separate infectiousness model included within-host cytokine ratios (IFN-γ : IL-10) as a possible predictor of number of days infectious, along with pre-inoculation CORT concentration. Infectiousness models were summarized by giving coefficient values of each of the predictors (β ± s.e.) and associated p-values for these predictors (testing the null hypothesis that β = 0) in the days infectious models (electronic supplementary material, table S3). We also performed likelihood ratio tests on alternative models with main effects or interaction terms dropped from the full model (‘anova’ function in R) to confirm significant effects of these terms on model fit (electronic supplementary material, tables S2 and S3). In our predictive models of host competence via tolerance, we used linear models to examine the explanatory power of peak IFN-y and IL-10 levels (and, separately, the ratio of IFN-y : IL-10 expression [37]) along with pre-inoculation CORT concentrations (ng ml−1). We summarize results of the linear models with type II analysis of variance F-tests (‘Anova’ function in the R package ‘car’ [41]). We removed interaction terms from host tolerance models because they were all non-significant and removal improved overall model fit.
3. Results
(a). Treatment-level effects of corticosterone implantation on finch competence for West Nile virus
(i). Survival
CORT treatment affected survival of zebra finches exposed to WNV ( , p = 0.029; figure 1); No mortality was observed among control birds during the 14-day trial. Total mortality was 40% and 70% in the CORT+ and CORT++ treatment groups, respectively. However, there was no statistical difference in the rate of mortality between the CORT+ and CORT++ treatments (estimated HR for CORT++ versus CORT+ = 0.273 ± 0.893, p = 0.147). There was also no significant effect of either IFN-γ or IL-10 expression on zebra finch survival (HR = 7.25 ± 1.34,
  , p = 0.092 for IFN-γ and HR = 0.99 ± 0.597,
  , p = 0.99 for IL-10). In a recent study with identical experimental hormone manipulation in zebra finches, we observed zero mortality following exposure to CORT+ and CORT++ treatments [17], suggesting that the mortality observed in this study was due to interactions between CORT and WNV.
Figure 1.
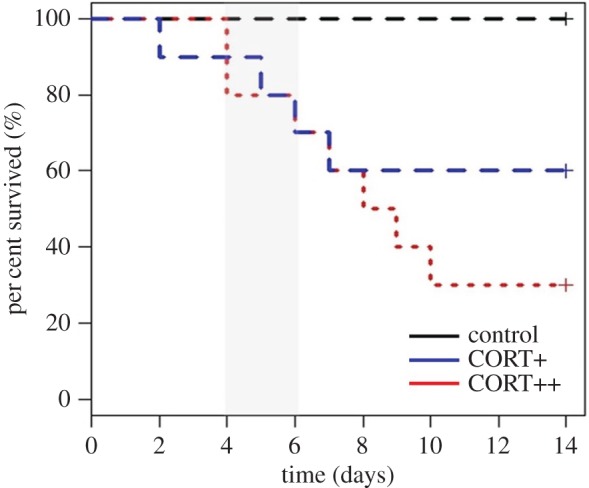
Effects of experimental corticosterone (CORT) treatment on zebra finch survival after exposure to West Nile virus (WNV). CORT treatment predicted survival rate of zebra finch hosts exposed to WNV ( , p = 0.029). The grey shaded bar between 4 and 6 days-post-inoculation on the x-axis indicates the period of peak infection intensity detected via quantitative-PCR in CORT+ and CORT++ hosts. The black, large-dashed line at the top (no mortality) corresponds to the control treatment; the blue, large-dashed line (middle) corresponds to the CORT+ treatment, and the red dotted line corresponds to the CORT++ treatment. (Online version in colour.)
(ii). West Nile virus viremia
Host viremia was strongly influenced by CORT treatment ( , p < 0.0001), time (
 , p < 0.0001), and the interaction of CORT treatment and time (
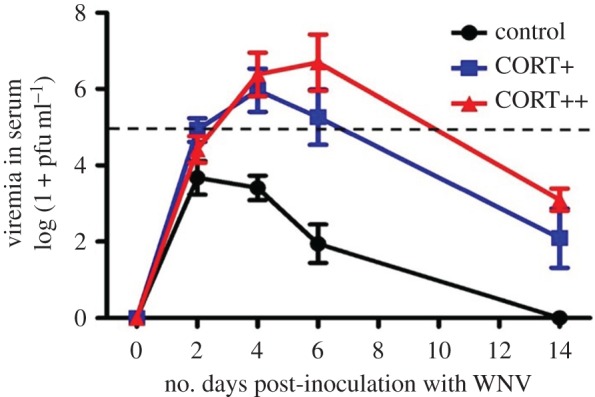
 , p < 0.0001; figure 2). Viremia tended to decrease across subsequent sampling time points in control birds, but changed dynamically in CORT+ and CORT++ birds (figure 2; electronic supplementary material, table S1). Notably, only birds in the CORT+ and CORT++ treatments were observed with viral burdens above the 105 PFU ml−1 threshold, generally considered necessary for transmitting the virus [31,38]. Most birds in the control group (9/10) became infected, but were presumably non-infectious after exposure to WNV, as judged by circulating viremia levels below the 105 PFU ml−1 level (figure 2). All CORT+ and CORT++ birds became infected after exposure to WNV. We observed enduring infections in CORT-treated birds compared with controls; several individuals in both CORT treatments maintained detectable virus in serum up to 14 dpi, the final sampling time point in the study. Estimates of the duration of infectiousness (duration of time hosts had viral loads detected via qPCR above the 105 PFU ml−1 level) were extrapolated from temporal viral profiles based on 5 sampling time points. They averaged 0.2 days for controls (only 1/10 control birds had a non-zero value for days infectious), and 2.2 and 3.5 days for CORT+ and CORT++ treatments, respectively. Notably, approximately 80% of the mortality experienced by birds in the CORT+ and CORT++ treatments occurred after the day that peak viremia was detected in circulation (figures 1 and 2).
Figure 2.
Viremia of zebra finches exposed to WNV across different experimental CORT treatments. CORT treatment ( , p < 0.0001), time (
 , p < 0.0001) and the interaction between treatment and time (
 , p < 0.0001) predicted host viremia. At peak viremia levels, hosts in the CORT+ and CORT++ treatments (square and triangle symbols, respectively) had viral infection intensities that were approximately 2 orders of magnitude greater than those of control birds (circle symbols). The horizontal dashed line at 105 pfu WNV ml−1 indicates the proposed threshold for transmission of WNV from bird to mosquito; only birds in the elevated CORT treatments attained viremia levels above this transmission threshold. Points represent averages at sampled time points over the study. Error bars are ±1 s.e. of the mean. (Online version in colour.)
(iii). Cytokine expression
Expression level of IFN-γ was not predicted by CORT treatment ( , p = 0.778). However, time predicted IFN-γ expression (
 , p < 0.0001; electronic supplementary material, figure S2a). IFN-γ levels decreased from 2 to 4 dpi in avian hosts exposed to WNV (β = −0.506 ± 0.129, electronic supplementary material, figure S2a). There was no significant interaction between CORT treatment and time on average IFN-γ expression (
 , p = 0.565). Expression levels of IL-10 were not predicted by treatment (
 , p = 0.188) or time (
 , p = 0.213; electronic supplementary material, figure S2b). There was also no significant interaction between CORT treatment and sampling time point on IL-10 expression (
 , p = 0.940).
(iv). Host performance
CORT treatment ( , p = 0.0028) and time (
 , p < 0.0001), but not the interaction between treatment and time (
 , p = 0.853), predicted flight performance in the vertical flight challenge. Flight performance was reduced in CORT+ and CORT++ birds compared with control birds at both sampling time points (2 and 4 dpi; β = −0.794 ± 0.255 and β = −0.455 ± 0.260, respectively), but all birds increased flight performance from 2 to 4 dpi (β = 0.322 ± 0.061; electronic supplementary material, figure S3a). Change in host body mass from 0 to 2 dpi and from 2 to 4 dpi (e.g. delta mass) was not affected by CORT treatment (
 , p = 0.8539) or the interaction of treatment and time (
 , p = 0.3202), but was affected by time alone (
 , p < 0.0001). Birds showed less mass loss from day 2 to 4 dpi than they did from 0 to 2 dpi (β = 0.661 ± 0.167; electronic supplementary material, figure S3b).
(v). Host tolerance of West Nile virus
CORT treatment tended to predict average vertical flight tolerance of WNV infection, (F2,22 = 3.24, p = 0.0584; electronic supplementary material, figure S4a). Inflammatory IFN-γ levels also negatively predicted average flight tolerance (F1,22 = 4.33, p = 0.049, β = −0.051 ± 0.024), and anti-inflammatory IL-10 levels did not significantly predict average flight tolerance across the three experimental treatments (F1,22 = 0.034, p = 0.854). Average flight tolerance tended to be highest in control birds and lower in the CORT++ and CORT+ treatments (β = −0.049 ± 0.019, p = 0.019 and β = −0.03 ± 0.021, p = 0.135 for CORT++ and CORT+ compared to the control treatment reference, respectively; electronic supplementary material, figure S4a). Average mass tolerance was not significantly predicted by treatment (F2,22 = 2.015, p = 0.1572), IFN-γ expression (F1,22 = 1.8985, p = 0.1821) or IL-10 expression (F1,22 = 2.917, p = 0.1017; electronic supplementary material, figure S4b).
(b). Individual-level predictors of host competence for West Nile virus
(i). Days infectious
Only birds in the CORT+ and CORT++ treatments had viremia levels at or above the 105 PFU ml−1 transmission threshold; thus, subsequent model results for individual infectiousness and tolerance pertain only to these hosts (n = 20, possible). Individual pre-inoculation CORT concentrations (ng ml−1) and individual IL-10 expression levels significantly predicted the number of days a host was detected as infectious; higher pre-inoculation CORT concentrations and greater IL-10 expression after WNV exposure predicted a longer duration of host infectiousness (β = 14.59 ± 7.45, p = 0.050 and β = 8.75 ± 4.21, p = 0.038 for CORT and IL-10 effects, respectively; figure 3; electronic supplementary material, figure S5a and table S2). An interaction between individual pre-inoculation CORT concentration and IL-10 also predicted number of days infectious (β = −3.31 ± 1.66, p = 0.046; electronic supplementary material, figure S6a and table S2). At high IL-10 expression levels, there was a weak or no relationship between individual pre-inoculation CORT concentration and individual duration of infectiousness, but at low IL-10 expression levels, pre-inoculation CORT concentration strongly and positively predicted duration of host infectiousness. IFN-γ expression levels and the interaction between host CORT concentration and IFN-γ expression did not significantly predict infectiousness (β = 2.71 ± 6.26, p = 0.667 and β = −1.53 ± 2.53, p = 0.545, for the main and interaction effects on days infectious, respectively; electronic supplementary material, figure S6b and table S2). In a separate model using within-host cytokine ratio (IFN-γ : IL-10 expression in an individual) as a predictor, we observed a significant tendency for host cytokine ratio and host CORT concentration to predict duration of infectiousness (β = −4.452 ± 1.85, p = 0.016 and β = 6.11 ± 2.18, p = 0.005, respectively; electronic supplementary material, table S3). Larger cytokine ratios (more IFN-γ relative to IL-10) were associated with fewer number of days a host was infectious (electronic supplementary material, figure S5b), while higher pre-inoculation CORT concentrations were (as with the previous infectiousness model) associated with longer duration of infectiousness. There was a significant interaction between within-host cytokine ratios and pre-inoculation CORT concentration (β = 1.546 ± 0.694, p = 0.026; electronic supplementary material, figure S6c and table S3). When IFN-γ expression was high relative to IL-10 within a host, CORT strongly and positively predicted duration of infection. Conversely, when birds expressed little IFN-γ relative to IL-10, there was a weak relationship between CORT concentration and number of days infectious.
Figure 3.

Pre-inoculation CORT concentrations (after hormone manipulation and just before WNV inoculation) positively predicted host infectiousness (i.e. the number of days a host was detected with viremia levels at or above the 105 pfu ml−1 transmission threshold). Higher pre-inoculation CORT concentrations were associated with longer infectiousness (p = 0.01 for main effect of CORT concentration by comparing alternative zero-inflated generalized linear models with a Poisson distribution with and without this explanatory factor; β = 14.59 ± 7.45, p = 0.050 for null hypothesis of slope = 0 for CORT effect on days infectious). The effects display is based on the full model predicting infectiousness (which included CORT concentration, IFN-γ expression, IL-10 expression, and the interactions between CORT and each cytokine; see text and electronic supplementary material, table S2). The line depicts the estimates (based on a GLM with a Poisson distribution, no zero inflation) and the shaded region represents the 95% confidence interval around the estimated effect of CORT concentration on days infectious. The vertical axis is labelled on the response variable scale and effects are plotted on the scale of the linear predictor (i.e. effects are plotted on the log scale).
(ii). Host tolerance
Individual pre-inoculation CORT concentration predicted flight tolerance during WNV infection (F1,12 = 11.01, p = 0.006); higher pre-inoculation CORT concentrations were associated with reduced individual flight tolerance (β = −0.063 ± 0.019; figure 4). Neither cytokine was a significant predictor of individual flight tolerance (F1,12 = 2.77, p = 0.12 and F1,12 = 1.58, p = 0.232 for IFN-γ and IL-10, respectively), and there were no significant interactive effects of cytokines and CORT concentrations on predictions of individual flight tolerance so these interactions were removed from the final model. In a separate model, however, within-host cytokine ratios (IFN-γ : IL-10) and pre-inoculation CORT concentrations significantly predicted an individual's flight tolerance (F1,13 = 6.465, p = 0.024 and F1,13 = 11.65, p = 0.004, respectively); more tolerant hosts expressed less IFN-γ relative to IL-10 expression (β = −0.019 ± 0.007; electronic supplementary material, figure S7a) and had lower pre-inoculation CORT levels (β = −0.0643 ± 0.019). The interaction between cytokine ratios and CORT concentration was non-significant and removal improved model fit. There was no effect of pre-inoculation CORT concentration, IL-10 expression or IFN-γ expression (or their interaction) on predictions of individual body mass tolerance (F1,12 = 0.09, p = 0.775 for CORT effect; F1,12 = 1.28, p = 0.279 for IL-10 effect; F1,12 = 1.81, p = 0.203 for IFN-γ effect). In a separate model, within-host cytokine ratios (but not pre-inoculation CORT concentrations) tended to predict a host's mass tolerance (F1,13 = 4.81, p = 0.047). As with flight tolerance, smaller cytokine ratios, or less IFN-γ relative to IL-10 expression predicted greater individual mass tolerance (β = −0.068 ± 0.031; electronic supplementary material, figure S7b).
Figure 4.

Individual pre-inoculation CORT concentration negatively predicted the ability to maintain vertical flight during WNV infection (F1,12 = 11.01, p = 0.006); higher pre-inoculation CORT concentrations were associated with reduced individual flight tolerance. In the effects display, the line depicts estimates and the shaded area represents the 95% confidence interval around the estimated effect of the predictor (CORT concentration) on host tolerance. The vertical axis is labelled on the response variable scale, effects are plotted on the scale of the linear predictor, and the results come from linear model regression model fitted with main effects of each cytokine and pre-inoculation CORT concentration.
4. Discussion
Corticosterone (CORT) treatment and CORT concentrations assessed prior to pathogen exposure affected several dimensions of host competence to transmit WNV. First, individuals with experimentally elevated CORT were, on average, 2 orders of magnitude more viremic than control hosts exposed to WNV (figure 2). Second, CORT-treated, compared to sham-implanted birds, sustained WNV infections longer than control hosts (figure 2). Third, CORT treatment tended to reduce host flight tolerance (but had no effect on mass tolerance; electronic supplementary material, figure S4a,b), which could potentially influence patterns of contact with susceptible vectors of WNV. Fourth, WNV caused mortality only in the CORT-manipulated groups; no control birds exposed to WNV died during the experiment, although most became infected but presumably not infectious (figure 1). Fifth and finally, although CORT negatively affected WNV-associated mortality, the majority of birds with experimentally elevated CORT (approx. 80%) survived past the sampling time point where viremia peaked. Altogether, our results reveal that CORT promotes elevated competence in this species; controls in nature would play a minimal (or even diluting) role in WNV dynamics whereas individuals with elevated stress hormone profiles could act as superspreaders and drive transmission risk in the community. Moreover, at the level of individual birds, pre-WNV-inoculation CORT concentrations were predictive of two aspects of host competence: duration of infectiousness (figure 3) and ability to tolerate WNV (figure 4). Changes in cytokine levels accompanying exposure to the virus explained some, but not all of the effects of CORT on host competence. Overall, our results suggest that CORT could mediate multiple behavioural and physiological aspects of host competence, and perhaps serve as a biomarker of individual infectiousness or transmission risk in a population.
(a). Implications of individual heterogeneity in host infectiousness in natural systems
Individual-level variation in competence could have cascading effects on disease dynamics at higher levels of biological organization [19,23–27], such as the timing and risk of epidemics and long-term persistence of infections in populations and multi-host communities. At the species level, these possibilities are well recognized. Dilution hosts, for example, can reduce the risk of infection to other susceptible hosts [47–49], whereas amplification hosts and pathogen reservoirs [49,50] can increase disease risk through their distinct relationships with pathogens and/or vectors. Recent emphases on superspreaders of infections such as SARS-coV, HIV and others suggest that individual variation can also mediate pathogen spread [19,26,27]. Superspreader phenotypes may arise when there is a high degree of heterogeneity in individual behaviours that increase contacts among susceptible hosts and vectors [26,27,51]. As we show here, differences in physiological characteristics, namely those that promote persistent infections and/or reduction of pathological signs of infection or morbidity during the period of infectiousness [19], could also underlie superspreading.
Contact rates between susceptible hosts and vectors are important for pathogen spread, as are the factors that will influence how hosts cope with infections when exposed [19,24,25]. We found that one form of host tolerance of WNV, vertical flight performance, was compromised by CORT concentrations. This effect of CORT on host tolerance could affect competitive interactions, anti-predator defences, and reproductive behaviours, modifying the role of stressed hosts in disease dynamics depending on the stage of their interactions with pathogens. Importantly, we previously showed that CORT also amplifies the rate of contact between mosquito vectors and zebra finches [17]. In our previous study, a highly competent and ubiquitous vector of WNV, the southern house mosquito, Culex quinquefasciatus, preferred to feed on and was more successful at feeding on finches with elevated CORT [17]. Combined with the observations here that most CORT-mediated WNV mortality occurred after peak infectiousness and that CORT extended the duration of infectiousness, it appears that CORT could strongly influence some of the most critical parameters relevant to disease spread.
(b). Mechanistic drivers of host competence: interactions between corticosterone and cytokines
CORT has clear direct effects on organismal aspects of host competence, and such effects appear partly mediated by the balance of pro- and anti-inflammatory cytokine expression [37]. IFN-γ is a key mediator of host resistance to WNV infection in rodents [52]. WNV-exposed mice lacking IFN-γ (via IFN-γ−/− and IFN-γ receptor−/− knockouts) had higher viremia, quicker time to death and greater rates of mortality than wild-type mice [34,53]. By contrast, IL-10 seems to offset collateral damage arising during inflammatory responses, including IFN-γ effects [54]. Mice lacking IL-10 (via signalling blockade or IL-10−/− knockout) expressed more antiviral cytokines (including IFN-γ) and had greater mortality rates to WNV infection than wild-type mice [54]. Here, we observed similar relationships between cytokine expression and an ecologically salient form of host resistance, host infectiousness (i.e. days an individual host was able to transmit virus based on circulating viremia levels). Higher IFN-γ expression relative to IL-10 expression within a host predicted fewer infectious days (electronic supplementary material, figure S5b). Critically, though, effects of cytokines on infectiousness depended on host CORT levels (electronic supplementary material, figure S6a,c). At low levels of IL-10 expression (or large IFN-γ : IL-10 ratios within a host), for example, CORT strongly and positively predicted the duration of host infectiousness. At high levels of IL-10 expression, CORT did not strongly predict number of infectious days, possibly indicating that IL-10 could buffer some negative impacts of stress hormones on host infectiousness.
Interactions between CORT exposure and cytokines also changed the way that individuals tolerated WNV infection [55]. Specifically, the balance of inflammatory and anti-inflammatory cytokines appears to underlie variation in behaviours that might influence exposure during the infectious period. First, CORT treatment negatively impacted host vertical flight, which might affect a host's ability to avoid vectors, predators or certain habitats (electronic supplementary material, figure S4a). Second, pre-inoculation CORT concentrations (e.g. CORT concentration immediately before inoculating birds with the virus) negatively predicted the ability of hosts to tolerate WNV (figure 4). With regard to within-host cytokine expression, low tolerance was associated with apparently overzealous inflammatory activity (i.e. high levels of IFN-γ expression relative to IL-10 expression; electronic supplementary material, figure S7a,b). In other words, larger cytokine ratios might result in reduced duration of infectiousness, but are also associated with reduced flight and mass tolerance during WNV infection. In nature, these effects might alter social behaviours that facilitate among-host direct transmission or host–vector transmission, and change competitive or aggressive interactions among uninfected or and infected hosts. Similarly, effects on performance could affect the motivation to seek resources and exploit different parts of the environment, potentially altering the spatial encounter rate with susceptible vectors or other avian hosts.
It is difficult to compare circulating CORT concentrations of birds in this study with hormone concentrations in other experiments [56–58] for several reasons. First, the constraints of working in an animal biosafety level 3 (ABSL3) laboratory made it necessary to complete hormone surgeries in a separate facility. After a 2-day recovery period, birds were transported to the ABSL-3 laboratory, where they acclimated to their new environment for another 24 h before we first took blood samples (day 0) and performed viral inoculations. Blood draws in the ABSL-3 environment take more time than captures outside of such a facility, meaning that most bleeds did not occur within the ideal of less than 3 min from capturing, as with most stress-sampling protocols. Given recent transport, manipulation and acclimation of birds, we assume that CORT levels in our finches were elevated above levels induced by implants. However, we cannot disentangle these effects in this study. Rather, we show that comparatively elevated CORT concentrations (i.e. in CORT implanted compared to sham control birds) predicted greater individual risk of mortality due to infection as well as greater population risk via elevated host competence to transmit the virus. We did not monitor circulating CORT concentrations of birds throughout the period of infectiousness and recovery. CORT implantation is apt to alter various elements of the hypothalamic–pituitary–adrenal (HPA) axis over the time scale of our study [1], and given the well-known feedbacks between stress and infection [4], it is difficult to predict how CORT concentrations in the blood changed over the course of the study. Similarly, feedbacks such as those on steroid binding globulins [2], which transport steroids to cell nuclei to serve as transcription factors (among other functions), and expression levels of glucocorticoid and mineralocorticoid receptors in key brain regions (responsible for negative feedback [2,4]) could change with CORT implantation and exposure to the virus. Indeed, high and low levels of circulating CORT could be difficult to translate given the dynamic systemic feedbacks on the HPA system over time. Thus, we suggest that one way to disentangle these effects would be to design a study with the specific aim of characterizing multiple aspects of HPA feedback and circulating hormone levels of birds exposed or unexposed to CORT implants and WNV infection. Understanding the interactions among circulating hormones, the CNS and viral infection outcomes could provide additional insight into the mechanisms of the patterns observed in this study.
5. Conclusion and implications
Our findings have important implications for targeting at-risk populations for disease management. For example, some populations, species or other taxonomic groups may be more prone to spread and maintain multi-host pathogens [59], and this propensity may correlate with the expression of spatial and temporal stress hormone profiles. Invasive species, range edge animals and species with particular life histories that regulate CORT differently may have distinct competence profiles [1,2,16,60]. One study showed that CORT levels and the insecticide resmethrin had interactive effects on host immunity and West Nile virus shedding in chickens [61]. This work, and ours, suggests that variation within species might be as extensive (and epidemiologically impactful) as variation among species [25]. Effective prevention and management of infectious disease depends on pro-active surveillance before epidemics occur, and the relationship between CORT, infectiousness and host contact rates [17] suggests that understanding among-host CORT dynamics might shed additional light on population-level risk.
WNV transmission is largely dependent on songbirds and Culex spp. vectors, but there is a high level of interspecific variation in competence among avian and mosquito hosts of the virus [27,31,38,62–64]. For example, Kilpatrick et al. [27] showed that vectors preferentially feed on one species of songbird, the American robin, and this feeding preference was not mediated by abundance of this species in the environment. Our data reveal that intra-specific variation, too, could be integral to disease dynamics. Indeed, natural and anthropogenic stressors could lead to the emergence of superspreader phenotypes within a population. We have recently shown that a cosmopolitan vector of WNV (Culex quinquefasciatus) displays strong feeding preferences for hosts with elevated CORT levels [17]. Coupled with data in the present study, stressor effects on competence could arise via both behavioural and physiological mechanisms [17,24]. Given the ubiquitous nature of environmental stressors and the increasing frequency of habitat alteration and human encroachment, we suggest that stress effects on host (and vector) competence receive more attention in other vectored and non-vectored pathogen systems [65,66].
Supplementary Material
Supplementary Material
Supplementary Material
Acknowledgements
We wish to thank A. Bingham and H. Hassan for valuable training in molecular diagnostic techniques and L. Brown for statistical advice. We thank the Martin and Unnasch labs as well as two anonymous reviewers for helpful comments. Any use of trade, firm or product names is for descriptive purposes only and does not imply endorsement by the US government.
Ethics
Procedures were carried out under permit of the Institutional Animal Care and Use Committee permit number 0396 from the University of South Florida, Department of Comparative Medicine.
Data accessibility
All data for statistical analyses are deposited in the Dryad repository [67]. Additional information and data are provided in the electronic supplementary material files.
Authors' contributions
S.S.G., L.B.M., T.R.U. and S.C.B. designed the experiments; S.S.G., L.B.M. and S.C.B. performed experimental procedures; E.H. provided technical expertise for experimental diagnostics; S.S.G. performed statistical analysis; S.S.G. and L.B.M wrote the manuscript.
Competing interests
We declare we have no competing interests.
Funding
This work was supported by NSF IOS grant no. 1257773 to L.B.M. and T.R.U.
References
- 1.Martin LB. 2009. Stress and immunity in wild vertebrates: timing is everything. Gen. Comp. Endocrinol. 163, 70–76. ( 10.1016/j.ygcen.2009.03.008) [DOI] [PubMed] [Google Scholar]
- 2.Sapolsky RM, Romero LM, Munck AU. 2000. How do glucocorticoids influence stress responses? Integrating permissive, suppressive, stimulatory, and preparative actions. Endocr. Rev. 21, 55–89. ( 10.1210/er.21.1.55) [DOI] [PubMed] [Google Scholar]
- 3.Thaker M, Lima SL, Hews DK. 2009. Acute corticosterone elevation enhances antipredator behaviors in male tree lizard morphs. Horm. Behav. 56, 51–57. ( 10.1016/j.yhbeh.2009.02.009) [DOI] [PubMed] [Google Scholar]
- 4.Dhabhar FS. 2009. A hassle a day may keep the pathogens away: the flight-or-fight stress response and the augmentation of immune function. Integr. Comp. Biol. 49, 215–236. ( 10.1093/icb/icp045) [DOI] [PubMed] [Google Scholar]
- 5.Laugero KD, Moberg CP. 2000. Energetic response to repeated restraint stress in rapidly growing mice. Am. J. Physiol. Endocrinol. Metab. 279, E33–E43. [DOI] [PubMed] [Google Scholar]
- 6.Greenberg N, Wingfield JC. 1987. Stress and reproduction: reciprocal relationships. In Hormones and reproduction in fishes, amphibians, and reptiles (eds Norris DO, Jones RE), pp. 461–503. New York, NY: Springer. [Google Scholar]
- 7.McEwen BS, Wingfield JC. 2003. The concept of allostasis in biology and medicine. Horm. Behav. 43, 2–15. ( 10.1016/S0018-506X(02)00024-7) [DOI] [PubMed] [Google Scholar]
- 8.Breuner CW, Greenberg AL, Wingfield JC. 1998. Non-invasive corticosterone treatment rapidly increases activity in Gambel's White-crowned Sparrows (Zonotrichia leucophrys gambelii). Gen. Comp. Endocrinol. 111, 386–394. ( 10.1006/gcen.1998.7128) [DOI] [PubMed] [Google Scholar]
- 9.DeNardo DF, Sinervo B. 1994. Effect of steroid hormone interaction on activity and home-range size of male lizards. Horm. Behav. 28, 273–287. ( 10.1006/hbeh.1994.1023) [DOI] [PubMed] [Google Scholar]
- 10.Astheimer LB, Buttemer WA, Wingfield JC. 1992. Interactions of corticosterone with feeding, activity and metabolism in passerine birds. Ornis Scandinavica 23, 355–365. ( 10.2307/3676661) [DOI] [Google Scholar]
- 11.Crossin GT, Trathan PN, Phillips RA, Gorman KB, Dawson A, Sakamoto KQ, Williams TD. 2012. Corticosterone predicts foraging behavior and parental care in Macaroni penguins. Am. Nat. 180, E31–E41. ( 10.1086/666001) [DOI] [PubMed] [Google Scholar]
- 12.Tokarz RR. 1987. Effects of corticosterone treatment on male aggressive behavior in a lizard (Anolis sagrei). Horm. Behav. 21, 358–370. ( 10.1016/0018-506X(87)90020-1) [DOI] [PubMed] [Google Scholar]
- 13.DeNardo DF, Licht P. 1993. Effects of corticosterone on social behavior of male lizards. Horm. Behav. 27, 184–199. ( 10.1006/hbeh.1993.1014) [DOI] [PubMed] [Google Scholar]
- 14.Meddle SL, Romero LM, Astheimer LB, Buttemer WA, Moore IT, Wingfield JC. 2002. Steroid hormone interrelationships with territorial aggression in an Arctic-breeding songbird, Gambel's white-crowned sparrow, Zonotrichia leucophrys gambelii. Horm. Behav. 42, 212–221. ( 10.1006/hbeh.2002.1813) [DOI] [PubMed] [Google Scholar]
- 15.Wingfield JC, Silverin B. 1986. Effects of corticosterone on territorial behavior of free-living male song sparrows Melospiza melodia. Horm. Behav. 20, 405–417. ( 10.1016/0018-506X(86)90003-6) [DOI] [PubMed] [Google Scholar]
- 16.Ricklefs RE, Wikelski M. 2002. The physiology–life history nexus. Trends Ecol. Evol. 17, 462–468. ( 10.1016/S0169-5347(02)02578-8) [DOI] [Google Scholar]
- 17.Gervasi SS, Burkett-Cadena N, Burgan SC, Schrey AW, Hassan HK, Unnasch TR, Martin LB. 2016. Host stress hormones alter vector feeding preferences, success and productivity. Proc. R. Soc. B. 283, 20161278 ( 10.1098/rspb.2016.1278) [DOI] [PMC free article] [PubMed] [Google Scholar]
- 18.Takken W, Verhulst NO. 2013. Host preferences of blood-feeding mosquitoes. Annu. Rev. Entomol. 58, 433–453. ( 10.1146/annurev-ento-120811-153618) [DOI] [PubMed] [Google Scholar]
- 19.VanderWaal KL, Ezenwa VO. 2016. Heterogeneity in pathogen transmission: mechanisms and methodology. Funct. Ecol. 30, 1606–1622. ( 10.1111/1365-2435.12645) [DOI] [Google Scholar]
- 20.Sears BF, Rohr JR, Allen JE, Martin LB. 2011. The economy of inflammation: when is less more? Trends Parasitol. 27, 382–387. ( 10.1016/j.pt.2011.05.004) [DOI] [PubMed] [Google Scholar]
- 21.Martin LB, Burgan SA, Adelman JS, Gervasi SS. 2016. Host competence: an organismal trait to integrate immunology and epidemiology. Integr. Comp. Biol. 56, 1225–1237. ( 10.1093/icb/icw064) [DOI] [PubMed] [Google Scholar]
- 22.Medzhitov R, Schneider DS, Soares MP. 2012. Disease tolerance as a defense strategy. Science 335, 936–941. ( 10.1126/science.1214935) [DOI] [PMC free article] [PubMed] [Google Scholar]
- 23.Schneider DS, Ayres JS. 2008. Two ways to survive infection: what resistance and tolerance can teach us about treating infectious diseases. Nat. Rev. Immunol. 8, 889–895. ( 10.1038/nri2432) [DOI] [PMC free article] [PubMed] [Google Scholar]
- 24.Barron DG, Gervasi SS, Pruitt JN, Martin LB. 2015. Behavioral competence: how host behaviors can interact to influence parasite transmission risk. Curr. Opin. Behav. Sci. 6, 35–40. ( 10.1016/j.cobeha.2015.08.002) [DOI] [Google Scholar]
- 25.Gervasi SS, Civitello DJ, Kilvitis HJ, Martin LB. 2015. The context of host competence: a role for plasticity in host-parasite dynamics. Trends Parasitol. 31, 419–425. ( 10.1016/j.pt.2015.05.00) [DOI] [PMC free article] [PubMed] [Google Scholar]
- 26.Lloyd-Smith JO, Schreiber SJ, Kopp PE, Getz WM. 2005. Superspreading and the impact of individual variation on disease emergence. Nature 438, 355–359. ( 10.1038/nature04153) [DOI] [PMC free article] [PubMed] [Google Scholar]
- 27.Kilpatrick AM, Daszak P, Jones MJ, Marra PP, Kramer LD. 2006. Host heterogeneity dominates West Nile virus transmission. Proc. R. Soc. B. 273, 2327–2333. ( 10.1098/rspb.2006.3575) [DOI] [PMC free article] [PubMed] [Google Scholar]
- 28.Woolhouse MEJ, Taylor LH, Haydon DT. 2001. Population biology of multihost pathogens. Science 292, 1109–1112. ( 10.1126/science.1059026) [DOI] [PubMed] [Google Scholar]
- 29.Ouyang JQ, Muturi M, Quetting M, Hua M. 2013. Small increases in corticosterone before the breeding season increase parental investment but not fitness in a wild passerine bird. Horm. Behav. 63, 776–781. ( 10.1016/j.yhbeh.2013.03.002) [DOI] [PubMed] [Google Scholar]
- 30.Brien JD, Lazear HM, Diamond MS. 2013. Propagation, quantification, detection and storage of West Nile virus. Curr. Protoc. Microbiol. 31, 15D.3.1–15D.3.18. ( 10.1002/9780471729259.mc15d03s31) [DOI] [PubMed] [Google Scholar]
- 31.Komar N, Langevin S, Hinten S, Nemeth N, Edwards E, Hettler D, Davis B, Bowen R, Bunning M. 2003. Experimental infection of North American birds with the New York 1999 strain of West Nile virus. Emerg. Infect. Dis. 9, 311–322. ( 10.3201/eid0903.020628) [DOI] [PMC free article] [PubMed] [Google Scholar]
- 32.Lanciotti RS, et al. 2000. Rapid detection of West Nile virus from human clinical specimens, field-collected mosquitoes, and avian samples by a Taq-Man reverse transcriptase-PCR assay. J. Clin. Microbiol. 8, 4066–4071. [DOI] [PMC free article] [PubMed] [Google Scholar]
- 33.Martin LB, Brace AJ, Urban A, Coon CAC, Liebl AL. 2012. Does immune suppression during stress occur to promote physical performance? J. Exp. Biol. 215, 4097–4103. ( 10.1242/jeb.073049) [DOI] [PubMed] [Google Scholar]
- 34.Shrestha BT, Wang T, Samuel MA, Whitby K, Craft J, Fikrig E, Diamond MS. 2006. Gamma interferon plays a crucial early antiviral role in protection against West Nile virus infection. J. Virol. 80, 5338–5348. ( 10.1128/JVI.00274-06) [DOI] [PMC free article] [PubMed] [Google Scholar]
- 35.de Wall Malefyt R, Abrams J, , Bennett B, , Figdor CG, de Vries JE. 1991. Interleukin-10(Il-10) inhibits cytokine synthesis by human monocytes—an autoregulatory role of Il-10 produced by monocytes. J. Exp. Med. 174, 1209–1220. ( 10.1084/jem.174.5.1209) [DOI] [PMC free article] [PubMed] [Google Scholar]
- 36.Opal SM, Depalo VA. 2000. Anti-inflammatory cytokines. Chest 117, 1162–1172. ( 10.1378/chest.117.4.1162) [DOI] [PubMed] [Google Scholar]
- 37.Adelman JS, Kirkpatrick L, Grodio JL, Hawley DM. 2013. House finch populations differ in early inflammatory signaling and pathogen tolerance at the peak of Mycoplasma gallisepticum infection. Am. Nat. 181, 674–689. ( 10.1086/670024) [DOI] [PubMed] [Google Scholar]
- 38.Turell M, O'Guinn M, Oliver J. 2000. Potential for New York mosquitoes to transmit West Nile virus. Am. J. Trop. Med. Hyg. 62, 413–414. ( 10.4269/ajtmh.2000.62.413) [DOI] [PubMed] [Google Scholar]
- 39.R Development Core Team. 2014. R: a language and environment for statistical computing. Vienna, Austria: R Foundation for Statistical Computing. [Google Scholar]
- 40.Therneau T. 2015. Package ‘coxme’. R package version 2.2-5. [Google Scholar]
- 41.Fox J, Weisberg S. 2011. An R companion to applied regression, 2nd edn Thousand Oaks, CA: Sage Publications. [Google Scholar]
- 42.Bates D, Maechler M, Bolker B, Walker S. 2015. Fitting linear mixed-effects models using lme4. J. Stat. Softw. 67, 1–48. ( 10.18637/jss.v067.i01) [DOI] [Google Scholar]
- 43.Fox J. 2003. Effects displays for R for generalized linear models. J. Stat. Softw. 8, 1–27. ( 10.18637/jss.v008.i15) [DOI] [Google Scholar]
- 44.Kauffman EB, Jones SA, Dupuis AP, Ngo KA, Bernard KA, Kramer LD. 2003. Virus detection protocols for West Nile virus in vertebrate and mosquito specimens. J. Clin. Microbiol. 41, 3661–3667. ( 10.1128/JCM.41.8.3661-3667.2003) [DOI] [PMC free article] [PubMed] [Google Scholar]
- 45.Orley A, Levine P, Zimmerman D. 2003. Statistics and ecometrics: methods and applications. New York, NY: John Wiley and Sons. [Google Scholar]
- 46.Jackman S. 2009. Bayesian analysis for the social sciences. Hoboken, NJ: Wiley. [Google Scholar]
- 47.Ostfeld RS, Keesing F. 2000. Biodiversity and disease risk: The case of Lyme disease. Conserv. Biol. 14, 722–728. ( 10.1046/j.1523-1739.2000.99014.x) [DOI] [Google Scholar]
- 48.LoGiudice K, Ostfeld RS, Schmidt KA, Keesing F. 2003. The ecology of infection disease: effects of host diversity and community composition on Lyme disease risk. Proc. Natl Acad. Sci. USA 100, 567–571. ( 10.1073/pnas.0233733100) [DOI] [PMC free article] [PubMed] [Google Scholar]
- 49.Levi T, Keesing F, Holt RD, Barfield M, Ostfeld RS. 2016. Quantifying dilution and amplification in a community of hosts for tick-borne pathogens. Ecol. Appl. 26, 484–498. ( 10.1890/15-0122) [DOI] [PubMed] [Google Scholar]
- 50.Haydon DT, Cleaveland S, Taylor LH, Laurenson MK. 2002. Identifying reservoirs of infection: a conceptual and practical challenge. Emerg. Infect. Dis. 8, 1468–1473. ( 10.3201/eid0812.010317) [DOI] [PMC free article] [PubMed] [Google Scholar]
- 51.Anderson RM, May RM. 1991. Infectious diseases of humans dynamics and control. Oxford, UK: Oxford University Press. [Google Scholar]
- 52.Samuel MA, Diamond MS. 2006. Pathogenesis of West Nile virus infection: a balance between virulence, innate and adaptive immunity, and viral evasion. J. Virol. 80, 9349–9360. ( 10.1128/JVI.01122-06) [DOI] [PMC free article] [PubMed] [Google Scholar]
- 53.Wang T, et al. 2003. IFN-γ-producing γδ T cells help control murine West Nile virus infection. J. Immunol. 171, 2524–2531. ( 10.4049/jimmunol.171.5.2524) [DOI] [PubMed] [Google Scholar]
- 54.Bai FW, et al. 2009. IL-10 signaling blockade controls murine West Nile virus infection. PLoS Pathog. 5, e1000610 ( 10.1371/journal.ppat.1000610) [DOI] [PMC free article] [PubMed] [Google Scholar]
- 55.Adelman JS, Bentley GE, Wingfield JC, Martin LB, Hau M. 2010. Population differences in fever and sickness behaviors in a wild passerine: a role for cytokines. J. Exp. Biol. 213, 4099–4109. ( 10.1242/jeb.049528) [DOI] [PubMed] [Google Scholar]
- 56.Wada H, Salvante KG, Stables C, Wagner E, Williams TD, Breuner CW. 2008. Adrenocortical responses in zebra finches (Taeniopygia guttata): individual variation, repeatability, and relationship to phenotypic quality. Horm. Behav. 53, 472–480. ( 10.1016/j.yhbeh.2007.11.018) [DOI] [PubMed] [Google Scholar]
- 57.Beck ML, Davies S, Moore IT, Schoenle LA, Kerman K, Vernasco BJ, Sewall KB. 2016. Beeswax corticosterone implants produce long-term elevation of plasma corticosterone and influence condition. Gen. Comp. Endocrinol. 233, 109–114. ( 10.1016/j.ygcen.2016.05.021) [DOI] [PubMed] [Google Scholar]
- 58.Lynn SE, Perfito N, Guardado D, Bentley GE. 2015. Food, stress, and circulating testosterone: cue integration by the testes, not the brain, in male zebra finches (Taeniopygia guttata). Gen. Comp. Endocrinol. 215, 1–9. ( 10.1016/j.ygcen.2015.03.010) [DOI] [PubMed] [Google Scholar]
- 59.Han BA, Kramer AM, Drake JM. 2016. Global patterns of zoonotic diseases in mammals. Trends Parasitol. 32, 565–577. ( 10.1016/j.pt.2016.04.007) [DOI] [PMC free article] [PubMed] [Google Scholar]
- 60.Bonier F. 2012. Hormones in the city: endocrine ecology of urban birds. Horm. Behav. 61, 763–772. ( 10.1016/j.yhbeh.2012.03.016) [DOI] [PubMed] [Google Scholar]
- 61.Jankowski MD, Franson JC, Möstl E, Porter WP, Hofmeister EK. 2010. Testing independent and interactive effects of corticosterone and synergized resmethrin on the immune response to West Nile virus in chickens. Toxicology 269, 81–88. ( 10.1016/j.tox.2010.01.010) [DOI] [PMC free article] [PubMed] [Google Scholar]
- 62.Rizzoli A, et al. 2015. Understanding West Nile virus ecology in Culex pipiens host feeding preference in a hotspot of virus emergence. Parasit. Vectors 8, 213 ( 10.1186/s13071-015-0831-4) [DOI] [PMC free article] [PubMed] [Google Scholar]
- 63.Amo J Del, Llorente F, Figuerola J, Soriguer RC, Moreno AM, Cordioli P, Weissenböck H, Jiménez-Clavero M. 2014. Experimental infection of house sparrows (Passer domesticus) with West Nile virus isolates of Euro-Mediterranean and North American origins. Vet. Res. 45, 33 ( 10.1186/1297-9716-45-33) [DOI] [PMC free article] [PubMed] [Google Scholar]
- 64.Perez-Ramirez E, Llorente F, Jimenez-Clavero MA. 2014. Experimental infections of wild birds with West Nile virus. Viruses 6, 752–781. ( 10.3390/v6020752) [DOI] [PMC free article] [PubMed] [Google Scholar]
- 65.Becker DJ, Streicker DG, Altizer S. 2015. Linking anthropogenic resources to wildlife-pathogen dynamics: a review and meta-analysis. Ecol. Lett. 18, 483–495. ( 10.1111/ele.12428) [DOI] [PMC free article] [PubMed] [Google Scholar]
- 66.Martin LB, Hopkins WA, Mydlarz LD, Rohr JR. 2010. The effects of anthropogenic global changes on immune functions and disease resistance. Ann. N. Y. Acad. Sci. 1195, 129–148. ( 10.1111/j.1749-6632.2010.05454.x) [DOI] [PubMed] [Google Scholar]
- 67.Gervasi SS, Burgan SC, Hofmeister E, Unnasch TR, Martin LB. 2017. Data from: Stress hormones predict a host superspreader phenotype in the West Nile virus system. Dryad Digital Repository. ( 10.5061/dryad.1s9g1) [DOI] [PMC free article] [PubMed]
Associated Data
This section collects any data citations, data availability statements, or supplementary materials included in this article.
Data Citations
- Gervasi SS, Burgan SC, Hofmeister E, Unnasch TR, Martin LB. 2017. Data from: Stress hormones predict a host superspreader phenotype in the West Nile virus system. Dryad Digital Repository. ( 10.5061/dryad.1s9g1) [DOI] [PMC free article] [PubMed]
Supplementary Materials
Data Availability Statement
All data for statistical analyses are deposited in the Dryad repository [67]. Additional information and data are provided in the electronic supplementary material files.