Abstract
As the adoption of Electronic Healthcare Records has grown, the need to transform manual processes that extract and characterize medical data into automatic and high-throughput processes has also grown. Recently, researchers have tackled the problem of automatically extracting candidate phenotypes from EHR data. Since these phenotypes are usually generated using unsupervised or semi-supervised methods, it is necessary to examine and validate the clinical relevance of the generated “candidate” phenotypes. We present PheKnow–Cloud, a framework that uses co-occurrence analysis on the publicly available, online repository ofjournal articles, PubMed, to build sets of evidence for user-supplied candidate phenotypes. PheKnow–Cloud works in an interactive manner to present the results of the candidate phenotype analysis. This tool seeks to help researchers and clinical professionals evaluate the automatically generated phenotypes so they may tune their processes and understand the candidate phenotypes.
Introduction
The widespread use of Electronic Health Records (EHRs) to record patient-level medical data has resulted in an ever growing number of clinical narratives. A key challenge for clinicians and researchers using EHR data is distilling the noisy, heterogeneous information into concise, clinically relevant concepts. One approach that addresses this challenge is EHR-based, or computational, phenotyping, which is the process of extracting and mapping key features of electronic health records to clinically relevant concepts or phenotypes. These phenotypes can be used to identify patients with specific characteristics or conditions of interest from EHR data.
In the past, domain experts have manually derived phenotypes, but this is a laborious, time–consuming process 1,2,3. Recent efforts have focused on using machine learning techniques to automatically extract candidate phenotypes from sets of electronic health records with minimal supervision 4,5,6,7,8. When candidate phenotypes are generated using an automatic, unsupervised, and high throughput process, it is necessary to explore their validity, clinical significance, and relevance. To date, these methods are validated from a panel of domain experts, which is still time–consuming albeit less than the manual derivation process. However, other issues can also arise during the phenotype verification process. First, domain expert annotators may disagree on the clinical relevance of a candidate phenotype based on their different experiences as medical professionals. Second, unsupervised methods may generate phenotypes that are unfamiliar to annotators, so they may incorrectly judge a phenotype as clinically insignificant when it is not. Additionally, given that these methods can result in a diverse set of candidate phenotypes, annotators may feel that the objective of phenotype validation is subjective or not well defined.
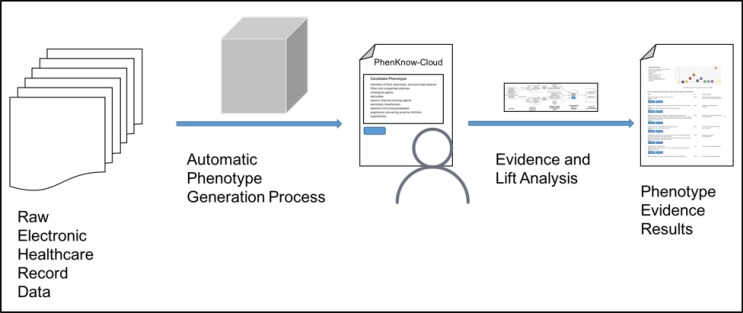
In this paper, we present PheKnow–Cloud, an interactive tool that begins to address these challenges. Given a phe notype supplied by the user, PheKnow–Cloud builds a set of evidence for the phenotype and presents it to the user. Specifically, PheKnow–Cloud leverages the medical expertise within the PubMed Open Access Subset,1 a publicly available, online database of over one million scientific articles. The tool builds the evidence set by generating co-occurrence counts of phenotypic terms from the articles and uses lift, a metric that summarizes if two or more items co-occur more often than average while accounting for the frequency of the item (see Figure 1 for an overview of the process). We present PheKnow–Cloud, describe the process by which the output of PheKnow–Cloud is generated, and show experimental results to support generating the output in this manner. We then discuss and demonstrate how PheKnow–Cloud can not only help with the assessment of candidate phenotype validity but also has the potential to aid researchers in tuning and improving the automatic phenotype generation process. PheKnow–Cloud builds on preliminary work by Bridges et al 9 by substantially improving the evidence set generation process and introducing an interactive interface.
Figure 1.
PheKnow–Cloud process.
Methods
We first describe the PheKnow–Cloud interface and then discuss the methods that generate each of the features on this interface.
PheKnow–Cloud: Front End Process
A standard usage case of PheKnow–Cloud is illustrated in Figure 1. First, a user generates phenotypes through an automatic (statistical) method2. Then, the user enters a phenotype into the PheKnow–Cloud Welcome Page and starts the analysis process by pressing the “Enter” button. The tool parses the phenotype, and on the backend, uses analysis of PubMed to generate the evidence sets it then presents to the user.
The use of PubMed to explore and discover issues in biology, medicine, and health informatics is not new, but few studies have used PubMed as a validation tool. A notable study by Boland et al. mined EHR records for patients who had disease–specific codes and then compared the association between birth month and the disease to a group of control patients who did not have the disease codes present in their EHRs 10. They validated their results against papers queried from PubMed that had disease and birth month as topics. Although Neveol et al. did not use PubMed for validation, their tool generated candidate annotations for PubMed queries and then measured the inter–annotator agreement as well as annotation time between sets of queries with and without the candidate annotations 11. However, annotating before annotators can examine the text can have the effect of biasing annotators, so it should be used carefully. Rather than annotating the phenotype as valid or invalid, PheKnow–Cloud helps the user understand and consider the credibility of the phenotype via metrics and sets of relevant articles.
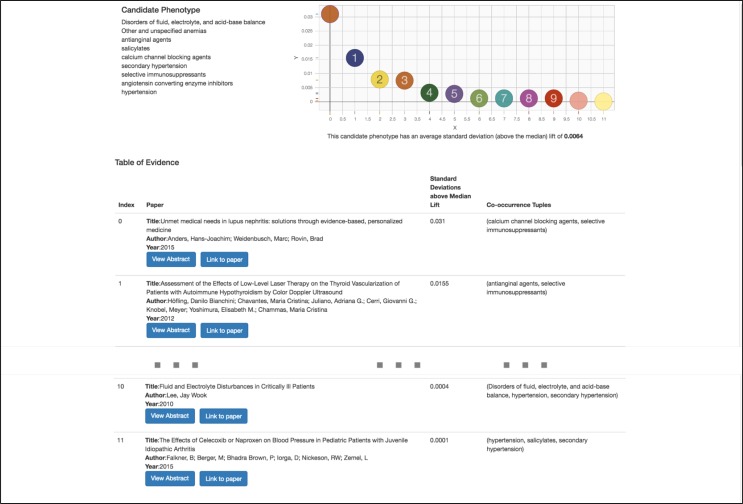
Once PheKnow–Cloud has run the analysis on PubMed, the particulars of which are discussed in the next section, it then presents the user with the results of the analysis on a new page. Figure 3 shows a screenshot of the example output on a user-supplied candidate phenotype (with the middle entries of the table omitted for space reasons). The Results page consists of three main parts. The top lefthand corner lists the candidate phenotype the user entered on the Welcome Page. The top right hand corner contains a scatter plot depicting the standard deviations above the median lift of each of the contributing tuples of terms that occurred once or more in the test corpus. This allows the user to understand the distribution of the lifts. Below the plot is the average of the standard deviations above the median of non–zero lifts depicted in the scatterplot. The calculation of these values are discussed in the next section.
Figure 3.
Screenshot of PheKnow–Cloud search result.
The majority of the page consists of a table of information listing a curated set of articles. This is the crux of PheKnow– Cloud and is the body of evidence that can either give support to the hypothesis that the candidate phenotype is valid or cast doubt on the validity of the hypothesis. The table contains information about the articles that were deemed the most relevant to the phenotype via a process detailed in the next section. The results are sorted by lift in a descending manner, with each row of the table containing information about a PubMed article including the title, author, year, buttons that link to more information, and the tuple of terms that co–occur in the paper. The abstracts of the papers are initially collapsed to allow users to view more articles, but can be expanded using the “Abstract” button for users to see if the paper is relevant to the phenotype. Pushing the “Link to the paper” button takes the user to article on PubMed should the user want to examine the article in more detail.
Our framework is flexible and modular to support new metrics and features like sorting and filtering. PheKnow–Cloud can be easily updated with additional refinements to validation process to help the user better gather evidence for the validity of the supplied candidate phenotype. For example, we plan to allow users to filter on the sets of co-occurring items so they can examine the papers corresponding to those terms. Our tool is built on the new client–server stack, Node.js, Javascript, HTML, and D3.js, which allows us to refine and further develop PhenKnow–Cloud to leverage new interactive visualizations.
PheKnow–Cloud: Back End Process
Using PheKnow–Cloud, a user can sift through curated evidence that can either support or detract from the validity of a candidate phenotype. We first discuss the motivation for the evidence curation process and then detail the evidence curation and lift calculation process, which is depicted in Figure 2.
Figure 2.
Co-occurrence and lift analysis process.
Many researchers have used PubMed as an exploratory and information extraction tool. Jensen et al. provide a thor- ough overview of how PubMed can be harnessed for information extraction and entity recognition 12. Amongst the two methods they discuss for information extraction, natural language processing and co-occurrence analysis, co- occurrence is more prevalent due to its straightforward implementation and the intuitive interpretation of the results. Co-occurrence analysis does not give information about the type of relationship or any causal information, but work done on bias towards publishing positive results allows for the assumption that when two phrases occur together the relationship exists 13,14,15. Researchers have also applied co-occurrence strategies to generate phenotypes. Some have used PubMed to study links between diseases 16, which can be thought of as phenotype discovery, and to explore rela- tionships between phenotypes and genotypes 17. Having generated phenotypes through machine learning techniques, PheKnow–Cloud uses co-occurrence analysis of PubMed as a way to study and assess the clinical significance of candidate phenotypes.
Although the idea of using co-occurrence of terms to examine the relationship of those terms is conceptually simple, there are several challenges that our automated framework must address before the co-occurrence analysis can take place. For one, each phenotype consists of a phenotypic items, and the representation of each element of the phenotype is important as it can drastically impact the number of articles returned during the PubMed query. Thus, the co-occurrence search needs to take into account encoding, form/tense, incorrect spellings, capitalization, and regular- ization as well as be flexible enough that at least a subset of synonyms and concepts related to the phenotypic item will be captured in a query. For example, if –myocardial failure” is a phenotypic item, our method should also know to count “heart failure” when it occurs in an article in PubMed. To this end, the first step of the co-occurrence analysis process is gathering sets of potential synonyms and related terms for each item in a phenotype using several medical ontologies.3
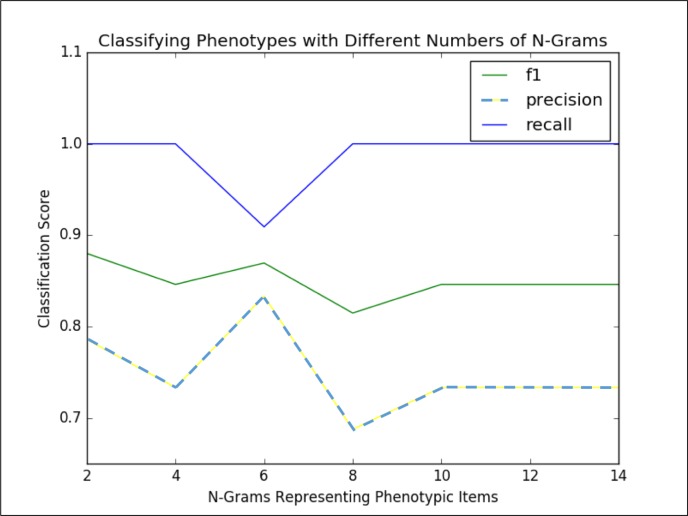
We then filter the set of potential synonyms based on the amount of overlap between PubMed searches on the synonym and the phenotypic item. Based on experimentation (refer to the discussion of Figure 4 in the Results section), we found that using the six synonyms, or n-grams, with the highest overlap in a search with the phenotypic items resulted in a good trade off between computational complexity (i.e., the more terms used to represent the phenotypic item, the longer it will take to perform the co-occurrence counts) and representing the phenotypic item well enough to be captured in the co-occurrence analysis. The phenotypic items are thus represented by themselves as well as a list of synonyms and related concepts, which we refer to as the “phenotypic item synonym set.”
Figure 4.
Classification Scores for Marble/Rubik Phenotypes versus size of Synonym Set
With the phenotypic synonym sets in hand, we now outline the co–occurrence calculation. For computational reasons, we used a randomly selected subset of 25% of the articles available in PubMed for this analysis. Given the phenotypic item synonym sets, all possible power sets between these synonym sets are computed. The co–occurrences for each power set is then tallied. Thus any appearance of an item from the phenotypic item synonym set counts as an appear- ance of the phenotypic item. We minimally process the PubMed text but do regularize capitalization and encoding (utf-8), remove words included in NLTK’s English stopword list, use a conservative regular expression to remove references (e.g. Smith, et al.), and remove special characters like quotes and parenthesis.
Having counted all co-occurrences the next challenge is to choose a phenotype significance metric that reflects the strength of association of the phenotypic items overall.We use lift as a measure of significance, where lift is defined in the following way: given the words/word sets A, B, and C in a sentence,
Probabilities are calculated as the number of sentences where the item occurs divided by the total number of sentences. Having calculated the lift for each co–occurring set of terms within a phenotype, the next task is to combine the lifts in such a way that will give a measure of the clinical “significance” of a phenotype. Experimentation showed that the size of the co-occurrence tuple is positively correlated to the size of the lift. This suggests that aggregating all the lifts within a phenotype will drown out the lifts of the smaller sets, and based on this observation, the goal of the measure of the overall significance of a phenotype should somehow take into account the size of the phenotypic items subsets (the size we refer to as the “phenotype cardinality”).
To address this problem we calculate measures of significance with respect to the size of co–occurring phenotypic item sets. We first combine the lifts of all the phenotypic item subsets across all phenotypes, and then partition the lifts into sets based on the phenotype item cardinality. We then calculate the median and standard deviation of the lifts within these partitioned sets. As a final step, we repartition the subsets of phenotypic items back into the phenotypes to which they belong and calculate the average of the standard deviations above the median. The average standard deviation above the median across all the possible subsets of phenotypic items within a phenotype is used as the measurement of phenotype clinical significance.
After this analysis has been run, it is summarized and presented to the user of PheKnow–Cloud (like in Figure 3). In the “Lift” column, we present the standard deviations above the median that the co-occurring phenotypic item tuple has in the analysis. In the Results section, we discuss how this analysis can be used to determine whether or not a given phenotype is clinically meaningful.
Data: Test Phenotypes
We use two sets of phenotypes to explore and test the potential of PheKnow–Cloud and the phenotype validation framework. The first set consists of annotated results of candidate phenotypes generated by two different unsupervised, high-throughput phenotype generation processes. The first automatic method, Rubik7, generated phenotypes from a de-identified EHR dataset from Vanderbilt University Medical Center with 7,744 patients over a five year observation period. For more details about the pre-processing of the data and phenotype generation, please refer to their paper7. The authors graciously shared the file with 30 computational phenotypes as well as the annotations of a panel of three domain experts. For each phenotype, each expert assigned one of the following three choices: 1) yes - the phenotype is clinically meaningful, 2) possible - the phenotype is possibly meaningful, and 3) not – the phenotype is not clinically meaningful. The second set of candidate phenotypes was generated by Marble5 using the EHR data of a random subset of 10,000 patients from the Centers for Medicare and Medicaid Services (CMS) Linkable 2008-2010 Medicare Data Entrepreneurs’ Synthetic Public Use File (DE-SynPUF), a publicly available dataset with claim records that span 3 years.4 The 50 candidate phenotypes that Marble generated were then annotated by two domain experts in a manner identical to above.
We combined the 30 Rubik-generated candidate phenotypes with the 50 Marble-generated candidate phenotypes and used the resulting set of 80 candidate phenotypes in the co-occurrence experiment. Of these 80 phenotypes, the annotators found that approximately 14% are clinically meaningful, 78% are possibly significant and 8% are not clinically meaningful.
The second set of phenotypes consists of randomly generated phenotypes and phenotypes curated to represent known significant clinical narratives. The random phenotypes are generated by randomly selecting phenotypic items from a set of 1000+ phenotypic items generated by Marble/Rubik phenotypes not used in this work. The curated phenotypes were constructed by representing clinical narratives described in Epocrates references5 and the AHRQ national guide-lines6 using phenotypic items. We randomly generated phenotypes and created phenotypes based on known medical concepts to demonstrate the efficacy of our method.
Results
Analysis of Lift Generation Process
First we used the Marble and Rubik phenotypes that were annotated as either “clinically significant” or “not clini- cally significant” to determine the optimal size of the phenotypic item synonym set. We performed a grid search over phenotypic item synonym set sizes, calculated the co-occurrence counts for each phenotype, and then used this information to classify annotated phenotypes as clinically meaningful or not (summarized in Figure 4). Specifically, Figure 4 shows the precision, recall and F1 score for classifying the annotated phenotypes when characterized by different sizes of phenotypic item synonym sets (n-grams). Using six n-grams per phenotypic item to do the co-occurrence analysis resulted in the classification with the best balance between precision and recall (F1 score of 0.87) We note that while two n-grams scored 0.88, the lower precision delivered by this scenario was not desirable.
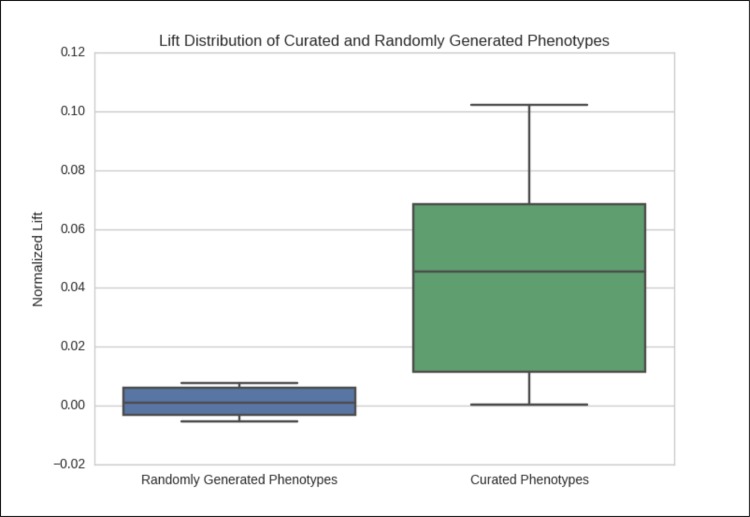
Using six synonyms or related concepts for each phenotypic item, we examine the lift averages of the randomly generated and curated phenotypes to examine if there is a difference between random and curated phenotypes. Figure 5 shows the boxplot of the average standard deviations above the median for the two groups of phenotypes. In nearly all cases lift average of the curated phenotypes is above that of the randomly generated phenotypes, which gives support to the claim that constructing lift in this manner is an effective way of determining the clinical significance of a candidate phenotype.
Figure 5.
Normalized Average Lift of Curated Phenotypes
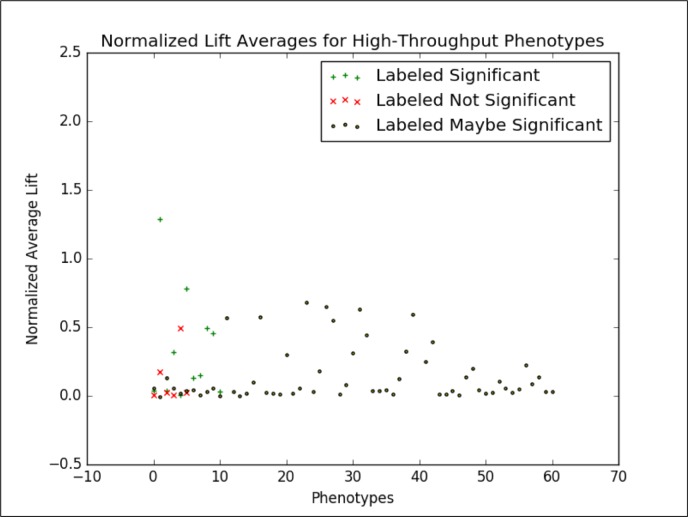
We then applied this analysis to the candidate phenotypes generated by Marble and Rubik. Figure 6 shows the normalized lift average of the phenotypes generated by Marble and Rubik 4,5,7. If we consider only the candidate phenotypes labeled “significant” and “not significant” by the annotators and draw a boundary at 0.028, we are able to classify candidate phenotypes with an F1 score of 0.87. At this point, we focus on this binary classification task because 1) we consider the annotations to be a “silver” standard ground truth and 2) this binary classification task helps us study the separation between the clinically significant and not clinically significant phenotypes.
Figure 6.
Normalized Average Lift of Marble/Rubik Phenotypes
This analysis gives support to using lift as a measure of clinical significance of a candidate phenotype.
Discussion
PheKnow–Cloud allows users to analyze the evidence behind the lift calculation and assess its validity. For example, in the phenotype depicted in Figure 3, a user can examine the evidence given by the co-occurrence tuple “(Disorders of fluid, electrolyte, and acid-base balance, hypertension, secondary hypertension)” by clicking on the associated paper. In that paper, the user would find the sentence, “If urinary K+ excretion is high, transtubular potassium gradient (TTKG), acid-base status, and the presence or absence of hypertension are helpful in differential diagnosis of hypokalemia due to renal potassium loss,” which may give support to the candidate phenotype 19. In the future, we plan to enhance PheKnow–Cloud to highlight the sentences where the terms co-occur.
However, from the PheKnow–Cloud screenshot, we see that the tuple that has the highest standard deviation from the median, is “(calcium channel blocking agents, selective immunosuppressants),” and the paper in which they occur the most is about lupus. The lift captures that they are correlated with one another but maybe not with the phenotype on the whole. This co-occurrence detracts from the body of evidence supporting this phenotype. In the future, we may introduce a semi-supervised aspect to PheKnow–Cloud where the user can weight tuples they think are the most important.
Another potential use of PheKnow–Cloud is providing evidence to analyze the phenotypes that are deemed “possibly significant.” Of the 80 phenotypes resulting from Marble and Rubik, 78% are possibly significant. Annotators could use this analysis as evidence to give labels the phenotypes. For example, if an annotator was not sure about the significance, he or she could use the evidence generated by PheKnow–Cloud in addition to professional experience while labeling the candidate phenotype. However, a more thorough analysis of the value of this and whether or not it would bias an annotator must be studied.
On the back-end side of things, we note that while lift thresholding classifies phenotypes with relative success in both high-throughput and curated phenotypes, the method does not provide a universal threshold guaranteed for all phenotypes. In addition, the majority of phenotypes are very close to the optimal threshold. This suggests that further work is needed to improve the predictive value of lift thresholding.
As noted in the Results section, the classification task is whether or not an annotated phenotype is clinically significant or not. However, this task leaves out 78% of the compiled phenotypes that were labeled as “possibly significant.” In the future, we would like to use PheKnow–Cloud to examine these possibly significant phenotypes as well as incorporate them into the classification task.
Another possible future direction is incorporating the knowledge of the lift of “gold standard”/curated phenotypes, which are phenotypes that have been manually generated by domain experts. Examples of these are the curated phenotypes we used in the experimental section of this paper and phenotypes that have been produced by PheKB7. We could combine these with the “silver standard” phenotypes, which are those generated using automatic methods and have been confirmed by panels of experts20. One way to do this would be to present the average lift of a given phenotype with respect to these standard phenotypes. This will give annotators and researchers more information when assessing candidate phenotypes. Knowledge of the lift of gold and silver standards could also be used in classification tasks of new phenotypes.
Conclusion
When rapidly generating candidate phenotypes in an unsupervised manner, it is necessary to have some measure of their clinical validity and relevance. PheKnow–Cloud is an interactive tool that generates a measure of significance for any proposed phenotype and points to supporting material in the medical literature. PheKnow–Cloud has several potential uses including improving the phenotype verification process, and facilitating knowledge discovery by tying evidence across multiple publications. Displaying the results in terms of lift makes one able to quickly analyze which tuples are contributing the most to a phenotype and the associated strength of evidence based on co-occurrence. In the future, we to further evaluate the value of PheKnow–Cloud feedback to domain experts. After all, the purpose of the tool and phenotype evaluation process is not to replace domain experts, but to act as another annotator or a smart tool that assists domain experts in evaluating phenotypes.
Footnotes
PheKnow–Cloud does not strictly need an automatically generated phenotype and could potentially be used as a discovery tool.
We primarily used NCBI MeSH terms, SNOMED-CT, and ICD-10 18.
References
- 1.Carroll Robert J, Eyler Anne E, Denny Joshua C. Naive electronic health record phenotype identification for rheumatoid arthritis. AMIA Annu Symp Proc. 2011;volume 2011:189–96. [PMC free article] [PubMed] [Google Scholar]
- 2.Chen Yukun, Carroll Robert J, Hinz Eugenia R McPeek, Shah Anushi, Eyler Anne E, Denny Joshua C, et al. Applying active learning to high-throughput phenotyping algorithms for electronic health records data. Journal of the American Medical Informatics Association. 2013;20(e2):e253–e259. doi: 10.1136/amiajnl-2013-001945. [DOI] [PMC free article] [PubMed] [Google Scholar]
- 3.Hripcsak George, Albers David J. Next-generation phenotyping of electronic health records. Journal of the American Medical Informatics Association. 2013;20(1):121. doi: 10.1136/amiajnl-2012-001145. [DOI] [PMC free article] [PubMed] [Google Scholar]
- 4.Ho Joyce C, Ghosh Joydeep, Steinhubl Steve R, Stewart Walter F, Denny Joshua C, Malin Bradley A, et al. Limestone: High-throughput candidate phenotype generation via tensor factorization. Journal of Biomedical Informatics. December 2014;52:199–211. doi: 10.1016/j.jbi.2014.07.001. [DOI] [PMC free article] [PubMed] [Google Scholar]
- 5.Ho Joyce C, Ghosh Joydeep, Sun Jimeng. Marble: High-throughput phenotyping from electronic health records via sparse nonnegative tensor factorization. Proceedings of the 20th ACM SIGKDD International Conference on Knowledge Discovery and Data Mining. 2014:115–124. [Google Scholar]
- 6.Hu Changwei, Rai Piyush, Chen Changyou, Harding Matthew, Carin Lawrence. Machine Learning and Knowledge Discovery in Databases. Springer; 2015. Scalable bayesian non-negative tensor factorization for massive count data; pp. 53–70. [Google Scholar]
- 7.Wang Yichen, Chen Robert, Ghosh Joydeep, Denny Joshua C, Kho Abel, Chen You, et al. Proceedings of the 21th ACM SIGKDD International Conference on Knowledge Discovery and Data Mining. ACM; 2015. Rubik: Knowledge guided tensor factorization and completion for health data analytics; pp. 1265–1274. [DOI] [PMC free article] [PubMed] [Google Scholar]
- 8.Yu Sheng, Liao Katherine P, Shaw Stanley Y, Gainer Vivian S, Churchill Susanne E, Szolovits Peter, et al. To ward high-throughput phenotyping: unbiased automated feature extraction and selection from knowledge sources. Journal of the American Medical Informatics Association. April 2015;22(5):993–1000. doi: 10.1093/jamia/ocv034. [DOI] [PMC free article] [PubMed] [Google Scholar]
- 9.Bridges Ryan, Henderson Jette, Ho Joyce C, Wallace Byron C, Ghosh Joydeep. ACM BCB Workshop on Methods and Applications in Healthcare Analytics. ACM; 2016. Automated verification of phenotypes using pubmed. Accepted. [Google Scholar]
- 10.Boland Mary Regina, Shahn Zachary, Madigan David, Hripcsak George, Tatonetti Nicholas P. Birth month affects lifetime disease risk: a phenome-wide method. Journal of the American Medical Informatics Association. 2015:ocv046. doi: 10.1093/jamia/ocv046. [DOI] [PMC free article] [PubMed] [Google Scholar]
- 11.Néevéeol Auréelie, Doğgan Rezarta Islamaj, Lu Zhiyong. Semi-automatic semantic annotation of pubmed queries: a study on quality, efficiency, satisfaction. Journal of Biomedical Informatics. 2011;44(2):310–318. doi: 10.1016/j.jbi.2010.11.001. [DOI] [PMC free article] [PubMed] [Google Scholar]
- 12.Jensen Lars Juhl, Saric Jasmin, Bork Peer. Literature mining for the biologist: from information retrieval to biological discovery. Nature reviews genetics. 2006;7(2):119–129. doi: 10.1038/nrg1768. [DOI] [PubMed] [Google Scholar]
- 13.Dickersin Kay. The existence of publication bias and risk factors for its occurrence. Jama. 1990;263(10):1385–1389. [PubMed] [Google Scholar]
- 14.Easterbrook Phillipa J, Gopalan Ramana, Berlin JA, Matthews David R. Publication bias in clinical research. The Lancet. 1991;337(8746):867–872. doi: 10.1016/0140-6736(91)90201-y. [DOI] [PubMed] [Google Scholar]
- 15.Stern Jerome M, Simes R John. Publication bias: evidence of delayed publication in a cohort study of clinical research projects. Bmj. 1997;315(7109):640–645. doi: 10.1136/bmj.315.7109.640. [DOI] [PMC free article] [PubMed] [Google Scholar]
- 16.Rajpal Deepak K, Qu Xiaoyan A, Freudenberg Johannes M, Kumar Vinod D. Mining emerging biomedical literature for understanding disease associations in drug discovery. Biomedical Literature Mining. 2014:171–206. doi: 10.1007/978-1-4939-0709-0_11. [DOI] [PubMed] [Google Scholar]
- 17.Pletscher-Frankild Sune, Pallejà Albert, Tsafou Kalliopi, Binder Janos X, Jensen Lars Juhl. Diseases: Text mining and data integration of disease–gene associations. Methods. 2015;74:83–89. doi: 10.1016/j.ymeth.2014.11.020. [DOI] [PubMed] [Google Scholar]
- 18.Wasserman Henry, Wang Jerome. AMIA Annual Symposium Proceedings. volume 2003. American Medical Informatics Association; 2003. An applied evaluation of snomed ct as a clinical vocabulary for the comput erized diagnosis and problem list; p. 699. [PMC free article] [PubMed] [Google Scholar]
- 19.Lee Jay Wook. Fluid and electrolyte disturbances in critically ill patients. Electrolytes & Blood Pressure. 2010;8(2):72–81. doi: 10.5049/EBP.2010.8.2.72. [DOI] [PMC free article] [PubMed] [Google Scholar]
- 20.Oellrich Anika, Collier Nigel, Smedley Damian, Groza Tudor. Generation of silver standard concept annota tions from biomedical texts with special relevance to phenotypes. PloS one. 2015;10(1):e0116040. doi: 10.1371/journal.pone.0116040. [DOI] [PMC free article] [PubMed] [Google Scholar]


