

Abstract
Secondary use1of electronic health records (EHRs) often relies on the ability to automatically identify and extract information from EHRs. Unfortunately, EHRs are known to suffer from a variety of idiosyncrasies – most prevalently, they have been shown to often omit or underspecify information. Adapting traditional machine learning methods for inferring underspecified information relies on manually specifying features characterizing the specific information to recover (e.g. particular findings, test results, or physician’s impressions). By contrast, in this paper, we present a method for jointly (1) automatically extracting word- and report-level features and (2) inferring underspecified information from EHRs. Our approach accomplishes these two tasks jointly by combining recent advances in deep neural learning with access to textual data in electroencephalogram (EEG) reports. We evaluate the performance of our model on the problem of inferring the neurologist’s over-all impression (normal or abnormal) from electroencephalogram (EEG) reports and report an accuracy of 91.4% precision of 94.4% recall of 91.2% and F1 measure of 92.8% (a 40% improvement over the performance obtained using Doc2Vec). These promising results demonstrate the power of our approach, while error analysis reveals remaining obstacles as well as areas for future improvement.
Introduction
According to an in-depth study of malpractice claims against neurologists2, the most common findings were (1) lapses in communication between the neurologists and the patient, (2) lack of follow-up by the neurologist even when not primarily responsible, and (3) diagnostic errors. Each of these findings could be improved by automatically identifying abnormal vs. normal brain activity in neurology reports. Specifically, the ability to automatically identify the neurologist’s over-all impression of a neurological test would allow electronic health record (EHR) and clinical decision support (CDS) systems to not only automatically flag patients for follow-up but to also identify diagnostic errors and inconsistencies. Unfortunately, EHRs are known to suffer from myriad idiosyncrasies3, 4, chief among them the prevalence of missing5, inconsistent, or underspecified data6, 7.
In this paper, we present a novel model for automatically recovering missing or underspecified8information from EHRs. While traditional medical informatics approaches rely on specific, pre-specified features to predict information, our model harnesses the power of textual data and deep learning to automatically extract features from EHRs while simultaneously predicting the underspecified information. We present our model for the motivating task of recovering underspecified over-all impressions (normal vs. abnormal) from electroencephalogram (EEG) reports. To train and evaluate our model, we used the largest collection of publicly available EEG reports – the Temple University Hospital EEG Corpus9. In each EEG report, we removed the impression section written by the neurologist and trained our model to infer the over-all impression from the remaining content in the report.
Inferring the over-all impression from EEG reports is a challenging problem because the over-all impression is informed by the neurologist’s subjective interpretation10of the EEG recording as well as his or her neurological expertise and accumulated experience. In fact, it has been shown that the inter-interpreter agreement between neurologists is only moderate11. Consequently, automatically inferring the over-all impression requires accounting for the role of neurological knowledge and experience. The deep learning model we present in this paper is able to automatically infer such knowledge by processing the natural language within EEG reports. Specifically, our model operates in three steps:
[Step 1] word-level features are automatically extracted based on their context by incorporating the skip-gram model11popularized by the Word2Vec framework12;
[Step 2] report-level features are automatically extracted using either (i) a deep averaging network (DAN)14, or (ii)a recurrent neural network (RNN)15, 16; and
[Step 3] the most likely over-all impression is predicted from word- and report-level features through densely- connected “deep” neural layers.
Our experimental results against a number of competitive baselines show the promise of our model. Moreover, because our model learns to extract features automatically rather than relying on hand-crafted features capturing specific aspects of EEG reports or their over-all impressions, we believe that our approach may be used or enhanced to infer other types of missing information.
Background
An electroencephalogram (EEG) is a test used to measure the electrical activity of the brain. EEGs are used for the diagnosis of epilepsy17, learning disabilities18, and other neurological disorders19. After reviewing the electrical activity recorded during an EEG, a neurologist creates an EEG report. The American Clinical Neurophysiology Society (ACNS) guidelines for writing an EEG report10states that “[t]he report of an EEG should consist of three principal parts: (1) Introduction, (2) Description of the record, and (3) Interpretation, including (a) impression regarding its normality or degree of abnormality, and (b) correlation of the EEG findings with the clinical picture.” In our experiments, we used the Temple University Hospital (TUH) EEG corpus9, and found that most EEG reports began by documenting the CLINICAL HISTORY of the patient, describing the patient’s age, gender, and relevant medical conditions at the time of the recording (e.g., “after cardiac arrest”, “female patient”) followed by a list of the medications which may influence the EEG. The INTRODUCTION section documented the setting of the EEG (e.g. “digital video EEG”, “using standard 10-20 system of electrode placement with 1 channel of EKG”), as well as the patient’s state of consciousness and whether or not they had been fasting, (e.g., “fasting”, “sleep deprivation”, or “comatose”). The DESCRIPTION section was the largest section in most EEG reports, and provided a description of any notable epileptiform activity (e.g. “sharp wave”), patterns (e.g. “burst suppression pattern”) and events (“very quick jerks of the head”). In general, the ACNS guidelines state that the EEG description should contain an objective and complete description of the background electro-cerebral activity as well as a detailed account of all waveforms in the record. In the IMPRESSION section, by contrast, the physician indicates their subjective, over-all impression of the EEG recording – normal or abnormal – as well as any contributing epileptiform phenomena (listed in order of significance). The final section in the EEG reports was the CLINICAL CORRELATION section explaining what the EEG findings mean in regards to the clinical picture of the patient (e.g. “very worrisome prognostic features”).
Related Work
A review of recent literature showed that the most common approach to handling missing or underspecified information is to either ignore it, or simply use the information provided by the most similar report20. Unfortunately, this approach (known in the machine learning community as approximate nearest neighbor21) suffers from two major problems: (1) it requires an accurate and complete metric for measuring the similarity between two patients or two EHRs, and (2) it often produces information which is not consistent with the original report. By contrast, the model we propose in this paper is able to recover underspecified information by examining the content of the report and, thus, is able to produce more consistent information.
To our knowledge, our deep learning model is the first reported architecture for automatically extracting high-level features from EEG reports. However, a number of neural architectures have been previously proposed for extracting high-level features from natural language in general. The Word2Vec (W2V) software12produced by Google provides two mechanisms for learning high-level feature representations of words: (i) the skip-gram model12and (ii) the continuous bag-of-words12(CBOW) model. Although both models have been shown to achieve high performance in a number of natural language processing applications, the CBOW model has been shown to require significantly more data than the skip-gram model in order to learn meaningful representations12, 13. Beyond W2V, the Global Vectors for Word Representation22(GloVe) software provided by Stanford also learns word-level feature representations. While W2V learns the best representation of a word for predicting its context, GloVe learns a word representation through dimensionality reduction over the co-occurrence counts obtained from a document collection. In general, both GloVe and W2V have been shown to produce useful feature-representations of words in a variety of clinical applications23, 24. In this paper, we consider the skip-gram model rather than CBOW or GloVe because it requires the least amount of training data and has the lowest computational complexity.
One of the major promises of deep learning is the ability to consider complex, sequential information, such as the order of words in an EEG report. This is typically accomplished by using recurrent neural networks (RNNs). Unfortunately, RNNs have also been shown to struggle with long documents14and to have difficulties accounting for long-distance interactions between words25. Consequently, we have also considered the Deep Averaging Network (DAN) proposed by Iyyer et al. (2105)14. While both RNNs and DANs can be used to learn the effect of semantic composition between words in an EEG report, the DAN has the advantage of reduced computational complexity and can more easily represent long-distance interactions. In this paper, we evaluated both approaches for learning report- level features from EEG reports.
Methods
When writing an EEG report, the neurologist typically documents their over-all impression of the EEG: whether it indicates normal or abnormal brain activity. However, this information is not always explicitly stated in the impression section of an EEG report and must sometimes be inferred by the reader. Figure 1 illustrates three EEG reports indicating (a) an over-all impression of NORMAL, (b) an over-all impression of ABNORMAL, and (c) an underspecified over-all impression. Note, in Figure 1, we have normalized the order and titles of the sections in each EEG report; in reality, however, we observed a total of 1,176 unique section titles in our collection. When producing an over-all impression, the neurologist interprets the EEG signal as well as the patient’s clinical history, medications, and the setting of the EEG. For example, consider report (b) from Figure 1: determining that the EEG was abnormal required identifying, among other findings, the frontal delta rhythm, while in report (c) the impression involves the drug Ativan and the patient’s prior diagnoses of dementia. These example show that automatically inferring the over-all impression requires accounting for high-level semantic information in EEG reports capturing the characteristics of the patient and the described EEG signal. Moreover, we observed that not all EEG reports included an impression section.
Figure 1:

Examples of EEG reports with (a) an over-all impression of NORMAL, (b) an over-all impression of ABNORMAL, and (c) an underspecified over-all impression which does not state whether the EEG was normal or abnormal.
Consequently, we designed an approach for automatically inferring the overall impression from an EEG report even when the impression section is omitted. To accomplish this, we combined deep neural learning with the largest collection of publicly available EEG reports – the Temple University Hospital (TUH) EEG Corpus9. The TUH EEG Corpus contains 16,495 de-identified EEG reports generated at TUH between 2002 and 2013. We found that 15,313 reports contained a clear over-all impression, while 1,029 reports had a missing or underspecified over-all impression. To train and evaluate our model, we considered only the reports with a clear over-all impression and (1) identified the over-all impression (which was used as the gold-standard) and (2) removed the impression section from the report. This allowed us to design a deep neural network to predict the over-all impression for EEG reports without relying on the impression section. We used a standard 3:1:1 split for training, development, and testing.
When designing our deep neural network, we noticed that the natural language content of each EEG report was far from uniform. The number of sections, the title of sections, the number of sentences in each section, and the lengths of each sentence all varied between individual neurologists and individual reports. Moreover, when describing an EEG recording, each neurologist wrote in a different style: while some neurologists preferred terse economical language, others provided meticulous multi-paragraph discussions. Thus, it was necessary to design the deep neural network to be independent of the length (and style) of the language used by the neurologist. Our approach for determining the over-all impression from EEG reports takes advantage of recent advances in deep learning in order to (1)automatically preform high-level feature extraction from EEG reports and (2) determine the most likely overall impression based on trends observed in a large collection of EEG reports. High-level feature extraction was performed automatically and was accomplished in two steps. In the first step, we learned word-level features for every word used in any EEG report. In the second step, we learned how to combine and compose the word-level features to produce a high-level features characterizing the report itself.
Formally, we represent each EEG report as a tensor, , where N is the number of words in the report and V is the size of the vocabulary or number of unique words across all EEG reports in the training set (in our case, V= 39,131). Each row Ri is known as a one-hot vector which indicates that the ith word in the report corresponds to the jth word in the vocabulary in by assigning a value of one to Rij and a value of zero to all elements. The overall impression of an EEG report (obtained from the removed impression section) is represented as c ∈ C where C= {NORMAL, ABNORMAL}. The goal of the deep neural network presented in this paper is to determine the optimal parameters 𝜃which are able to predict the correct assignment of c for a report R
| (1) |
where χindicates the training set of EEG reports. Unfortunately, determining the over-all impression directly from the words in each report is difficult. For example, spikes and sharp waves typically indicate abnormal brain activity but can be non-pathologic if they occur in the temporal regions of the brain during sleep: small sharp spikes in the temporal region of the brain during sleep are known as benign epileptiform transients of sleep (BETS) and do not indicate an abnormal EEG. Consequently, to correctly predict the overall impression c, it is important to consider high-level features characterizing the content each report rather than individual words. We extract these features automatically as part of our deep learning architecture. Specifically, we factorize the distribution used in Equation 1 into three factors:
| (2) |
The three factors in Equation 2 correspond to the three steps used to train our deep learning model:
-
(1)
produce a high-level feature representation W of every word in R, i.e. P(W| R);
-
(2)
create a single high-level feature representation e for the report itself by combining and composing the high- level feature representations of every word in the report, i.e. P(e| W); and
-
(3)
determine the most likely over-all impression c for the report based on its high-level feature representation e, i.e. P(c| e; θ).
Next, we will describe each of these steps in detail followed by a description of the training and application of our model to infer underspecified over-all impressions from EEG reports, as well as details on how model parameters were selected and the model parameters used in our experiments.
Learning Word-Level Features from EEG Reports
We determine a high-level feature representation for each possible word v ∈ [1, V] by examining the context around that word in each report, where V is the size of the vocabulary (described above). To do this, we adapt the skip-gram model12. The skip-gram model learns a single feature representation for every word in the vocabulary based on all of its contexts across all EEG reports in the training set.
Specifically, we learn the projection matrix U ∈ ℝV×K where each row Uv is the high-level feature representation of the vth word in the vocabulary. Figure 2 shows the architecture of the skip-gram model when considering the word EEG from the context Digital video EEG is performed ( from report (c) in Figure 1). The goal of the skip-gram model is to learn the projection matrix U which, when multiplied with the one-hot vector for EEG, is best able to predict the one-hot vectors associated with each context word, e.g., Digital, video, is, and performed. In this way, the skip-gram model is able to learn a representation for the word EEG which captures the facts that (1) an EEG can be performed and that (2) digital video is a type of EEG.
Figure 2:

The skip-gram model used to learn word-level features for each word in an EEG report, shown on report (c) from Figure 1.
We learn the optimal project matrix U by training a separate neural network in which the input is every word Ri ∈ R in every report R ∈ χ, and the goal is to predict the n previous and n following words using the projection matrix U:
| (3) |
where
| (4) |
In our experiments, we used n= 2. Learning the optimal projection matrix U allows the model to produce a high- level feature representation of every word in the report, W ∈ ℝN×K, by simply multiplying R with U:
| (5) |
where each Wi indicates the word-level feature vector associated with Ri. The word-level feature vectors (W) learned by the skip-gram model have a number of useful algebraic properties. Of particular note is their ability to capture semantic similarity, for example, closest feature vector to the word generalized is that of the word diffuse, and the closest feature vector to focal is that of the word localized. This highlights the ability of the skip-gram model to capture the fact that both generalized and diffuse refer to activity spread across a large area of the brain (e.g. both hemispheres, multiple lobes), while focal and localized describe activity concentrated in one or two regions of the brain.
Learning EEG Report-Level Features
Representing each word in a report as an independent feature vector is not sufficient to predict the overall impression. Instead, it is necessary to learn how to combine and compose the word-level feature vectors W to create a single high- level feature vector for the report, e. We considered two different neural architectures for learning e. The first model is based on a Deep Averaging Network (DAN)14, while the second uses a Recurrent Neural Network (RNN). Both architectures enable the model to learn a semantic composition but in different ways. Specifically, a DAN learns an un-ordered composition of each word in the document, while an RNN learns an ordered composition. However, the representation learned by an RNN often struggles to account for long-distance interactions and favors the latter half of each document. Consequently, we evaluated both models in order to determine the most effective architecture for learning report-level features from EEG reports.
Deep Averaging Network for Inferring Underspecified Information
The Deep Averaging Network (DAN)14 learns the report-level feature representation e of a report based on its word-level features W. To understand the need for report-level features, consider the excerpt:
Ex1: …a well-formed 9 to 10Hz posterior dominant rhythm, which is symmetrically reactive to eye opening and eye closing.
Interpreting Ex1 requires understanding (1) that the words posterior dominant rhythm describe a single EEG activity, and (2) that the posterior dominant rhythm is well-formed. Clearly, word-level features are not sufficient to capture this information. Instead we would like to extract high-level semantic features encoding information across words, sentences, and even sections of the report. The DAN used in our model accomplishes these goals using five layers, as shown in Figure 3. The first two layers learn an encoding of each word Wi associated with the report, and the third layer combines the resulting encodings to produce an encoding for the report itself. The final two layers refine this encoding to produce e. To learn an encoding for each word, we apply two densely-connected Rectified Linear Units (ReLUs)26. The rectifying activation functions used in ReLUs have several notable advantages, in particular the ability to allow for sparse activation. This enables learning which words in an EEG report have the largest impact the over- all impression. By using a ReLU for the first layer of our encoder, each word represented by feature vector Wi is projected onto an initial encoding vector ri(1). The ReLU used in the second layer of the encoder produces a more expressive14 encoding ri(2). Both encodings are generated as:
| (6) |
| (7) |
Figure 3:

Architecture of the Deep Averaging Network (DAN) used to combine and compose word- level features W1 ⋯ WNextracted from an EEG Report, shown on report (c) from Figure 1.
where S1, S2 ∈ θ are the learned weights of the connections between the neurons in layers 1 and 2, and b1, b2 ∈ θ are bias vectors. While the encoding ri(2) represents information obtained from each word vector Wi ∈ W, we are interested in producing a single representation that captures the information about the entire EEG report. This is accomplished by layers 3 through 5. In layer 3, the piece-wise average of all word vector encodings is produced:
| (8) |
Layers 4 and 5 act as additional “deep” layers which enhance the quality of the encoding14. To implement layers 4 and 5 we used two additional ReLUs:
| (9) |
| (10) |
where S3, b3, Se, be ∈ θ are the learned weights and biases used by each ReLU layer. Equations 6 through 10 enable our model to generate a fixed-length high-level vector, e, which encodes semantic information about the entire EEG report.
Recurrent Neural Network for Inferring Underspecified Information. In contrast to the DAN, the recurrent neural network (RNN) used in our model jointly learn how to (1) map a sequence of word-feature vectors (W1, ⋯ WN) to a sequence of hidden memory states (m1, ⋯ mN) as well as to (2) map the hidden memory states to a sequence of output vectors (y1, ⋯, yN), as illustrates in Figure 4. Formally, for each word i ∈ [1, N] where N is the length of the EEG report,
| (11) |
| (12) |
Figure 4:

Architecture of the Recurrent Neural Network (RNN) used to combine and compose word-level features W1 ⋯ WN extracted from an EEG Report, shown on report (c) from Figure 1.
where Sm, Sy ∈ θ are the learned weights connecting the neurons in each layer. Unfortunately, RNNs are known to have difficulties learning long-range dependencies between words27. For example, consider the excerpt:
Ex2: periodic delta with associated periodic paroxysmal fast activity identified from the left hemisphere with a generous field of spread including the centrotemporal and frontocentral region.
A standard RNN would be unlikely to infer that the periodic delta activity was observed in the centrotemporal and frontocentral regions of the brain due to the significant number of words between them (19). In order to enable our RNLM to overcome this barrier, we implement each of our RNNs as a stacked series of long short-term memory units25(LSTMs) which are able to learn long-range dependencies by accumulating an internal memory.
Inferring the Over-all Impression from EEG Reports
The learned high-level feature vector e is used to determine the most likely over-all impression associated with the EEG report. Given e, we approximated the likelihood of assigning the over-all impression c to the EEG report associated with e, i.e. P(c| e; θ), with a densely connected logistic sigmoid layer. The sigmoid layer computes a floating point number ∈ [0, 1] such that ≤ 0.5 if c= NORMAL, and > 0.5 if c= ABNORMAL:
| (13) |
where Sc, bc ∈ θ are the learned weights and bias vector for the sigmoid layer, and σ is the standard logistic sigmoid function, . Equation 19 allows us to approximate the likelihood of the over-all impression c ∈ C being assigned to the report associated with e as:
| (14) |
Training the Model with EEG Reports
We train our model by learning the parameters θ which minimize the loss when computing the over-all impression c for each report R in the training set χ. In our experiments, we used the cross-entropy loss between the predicted over- all impression c and the gold-standard value ĉ indicated by the neurologist (in the removed impression section).
Formally:
| (15) |
where P(ĉ) = 1 if c= ABNORMAL, and zero otherwise. We trained our model using adaptive moment estimation28 (ADAM).
Inferring Underspecified Information from EEG Reports
The optimal over-all impression c for a new EEG report R can be determined in three steps: (1) transform R into a word-level feature matrix, W= UR, using the projection matrix U learned from the training data; (2) transform the word-level feature matrix W into a single report-level feature vector e using either the DAN or the RNN; and (3) determine the over-all impression c from the report-level feature vector e.
Implementation Details
In our experiments, we implemented our model using Tensorflow29(version 0.8). Because ADAM tunes the learning rate as it trains, we initialized ADAM using the default parameters in Tensorflow (learning rate = 0.001, β1 = 0.9, β2 = 0.999, and 𝜖= e−8). For the purposes of our experiments, gradient clipping was not applied, and no regularization terms were added. Model parameters were determined using a grid-search as follows: skip-gram, ReLU. and LSTM dimensionality were chosen from {100, 200, 500, 1000}. When performing grid search, we constrained all ReLUs to share the same dimensionality. We found the optimal dimensionality for the skip-gram embeddings, ReLU layers, and LSTM to each be 200 dimensions/units.
Results
Our model was evaluated by measuring its ability to correctly determine the over-all impression c (i.e. normal or abnormal) for each report in the test set. To do this, we removed the impression section from each report in the test and compared the automatically produced over-all impressions against the over-all impressions given by the neurologists (obtained from the removed impression sections). Because our goal is to recover the over-all impression in reports which lack an over-all impression (normal or abnormal), we filtered out any reports which contained the word “normal” or “abnormal” after the impression section was removed. In our test set, we found that 76% of EEG impressions were abnormal and 24% were normal. We evaluated the performance of our model when incorporating either deep averaging network (DAN) or a recurrent neural network (RNN) to learn report-level features as well as the performance of five competitive baseline systems.
Support Vector Machine (SVM). We trained two support vector machines (SVMs)30 to classify each EEG report as normal or abnormal based on the content of the report. The first SVM (SVM:BOW) was trained by transforming R into a single “bag-of-words” vector. SVM parameters were learned The second SVM (SVM:LDA) was trained by transforming R into a topic vector using Latent Dirichlet Allocation (LDA). LDA was implemented using sklearn31 with symmetric priors. Parameters were determined using grid search as follows: number of topics ∈ {100, 200, 500, 1000}, kernel ∈ {linear, radial basis funcation (RBF), quadratic, cubic}, C ∈{10-4, 10-3, 10-2, 10-1, 1, 10, 102, 103, 104}. The optimal kernel for both SVMs was RBF, the optimal value of C was 103. For LDA, the optimal number of topics was 200.
Approximate Nearest Neighbor (ANN:Lev). The traditional approach for recovering missing or underspecified information is to simply use the information given in the closest document. In this baseline, the over-all impression was assigned using the over-all impression given by the closest report R′ in the training set to report R. We measured the “distance” between reports using Levenshtein distance (with equal costs for insertion, deletion, and substitution operations).
Neural Bag-of-Words (NBOW). In order to compare the importance of considering high-level feature information, we implemented a simple perceptron baseline which considers the content of the report R (represented as a bag-of- words vector) to produce the conclusion without automatically inferring any high-level features.
Doc2Vec (D2V). Finally, we considered a baseline relying on Doc2Vec (D2V), a document-level extension of Google’s Word2Vec model12. Like our model, D2V learns a high-level semantic representation of a document. However, unlike our model, the high-level features learned by D2V are agnostic of any particular task and do not capture any interaction between the content of the report and the over-all impression. We considered D2V vector dimensionality ∈ {100, 200, 500, 1000} and found the optimal number of dimensions was 200.
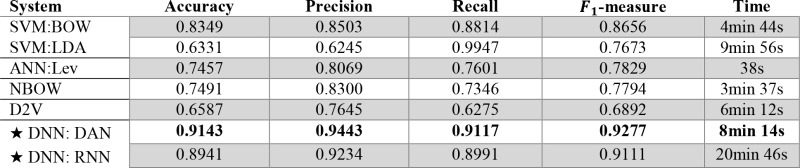
The performance of our model for generating the over-all impression of an EEG report was measured by casting it as a binary classification problem. This allowed us to compute the Accuracy, Precision, Recall, and F1-measure, as shown in Table 1. We also report the time taken to train each model. We found that our deep neural network (DNN, denoted with a ‘★’) significantly outperformed the four baseline systems. The low performance of the NBOW and SVM systems highlights the need to account for high-level contextual information in EEG reports, rather than individual words. Interestingly, the ANN approach obtained very low performance, despite being the most common technique reported in the literature. The low performance of Doc2Vec shows that capturing general report-level information is not sufficient for recovering the over-all impression. By contrast, both the RNN and DAN were able to learn meaningful high-level features from EEG reports. While the high performance of the RNN suggests that RNNs are capable of inferring sequential information from the EEG descriptions, the time taken to train the RNN was significantly longer than that taken to learn the DAN, mirroring the suspicions reported by Iyyer et al. (2015)14.
Table 1:
Performance when determining the over-all impression for EEG reports in the test set.
 |
Discussion
Our experimental results show the clear and significant promise of our model. By taking advantage of textual data through deep neural learning, our model was able to recover the over-all impression with 91% accuracy. The poor performance of all baseline systems, when compared against the performance of our model, suggests that both deep neural architectures were able to successfully extract high-level features automatically from EEG reports. However, despite outperforming all baseline systems, there were still instances in which the over-all impressions automatically recovered by our model differed from those of the neurologist. To investigate the causes of these errors, we manually inspected 100 randomly-selected misclassified EEG reports. We found that the majority of errors (51%) produced by our model occurred when the impression section referred to EEG characteristics not mentioned elsewhere in the report, or which had only negated mentions. For example, report (b) from Figure 1 indicates that the EEG was abnormal due to “excess theta” and “excess beta”, however neither of these characteristics are described in the EEG description. This suggests that the performance may be improved by jointly considering the EEG report and the associated EEG signal. However, it should be noted that processing the EEG signal directly is highly computationally expensive and is an open-problem for which there are no clear preferred methodologies32. Thus, the added value of incorporating EEG signal information largely depends on the nature of the application.
The second most-common source of errors (24%) was EEG reports in which the over-all impression relied on the patient’s age or pre-existing conditions. For example, impressions indicating “normal EEG for a patient of this age” or “normal activity given recent trauma.” We believe these errors resulted from a lack of sufficient training data for specific ages and pre-existing conditions, and that overcoming these errors could be accomplished by providing the model with additional context from the patient’s EHRs (such as notes from the referring physician). Unfortunately, the TUH EEG corpus provides no additional EHR information beyond individual EEG reports. Nevertheless, we believe that incorporating additional context could be a valuable step towards improving future performance.
The last major source of errors (9%) we observed were due to typographical mistakes and grammatical inconsistencies. For example, we observed “$een in” rather than “seen in”; “eta rhythm” rather than “beta rhythm”; and “& Hz” rather than “7 Hz”. While most of these mistakes had little impact on the performance of the model, we believe that future work may benefit from pre-processing EEG reports to remove typos and grammatical inconsistencies. There was no common source of errors for the remaining 16% of misclassified documents.
Conclusion
We have presented a deep learning approach for inferring missing or underspecified information from electronic health records (EHRs) by taking advantage of textual data. Our approach was evaluated based on its performance when recovering over-all EEG impressions from EEG reports after the impression section had been removed. While traditional machine learning approaches would require explicitly enumerating features characterizing the over-all impression, our model relies on deep neural learning to automatically identify high-level features from EEG reports while learning to predict the correct over-all impression. Our evaluation of over 3,000 EEG reports showed promising results, with an F1-measure of 93% (a 40% improvement over Doc2Vec). Moreover, because our approach does not rely on any manual feature extraction nor representation specific to EEG reports, we believe these results show the promise of our model for automatically recovering underspecified information from EHRs in general. In future work, we plan to explore the role of individual sections and words on determining the over-all impression as well as the use of neural learning to not only infer the over-all impression, but also to generate explanation(s) for the impression based on the report- and word- level features.
Acknowledgments
Research reported in this publication was supported by the National Human Genome Research Institute of the National Institutes of Health under award number 1U01HG008468. The content is solely the responsibility of the authors and does not necessarily represent the official views of the National Institutes of Health.
References
- 1.Safran C, Bloomrosen M, Hammond WE, Labkoff S, Markel-Fox S, Tang PC, et al. Toward a national framework for the secondary use of health data: an American Medical Informatics Association White Paper. J Am Med Inform Assoc. 2007;1(4):1–9. doi: 10.1197/jamia.M2273. [DOI] [PMC free article] [PubMed] [Google Scholar]
- 2.Glick TH, Cranberg LD, Hanscom RB, Sato L. Neurologic patient safety: an in-depth study of malpractice claims. Neurology. 2005;6(5):1284–1286. doi: 10.1212/01.wnl.0000180961.82198.0d. [DOI] [PubMed] [Google Scholar]
- 3.Weiner M. Evidence Generation Using Data-Centric, Prospective, Outcomes Research Methodologies; San Franc CA Present AMIA Clin Res Inform Summit; 2011. [Google Scholar]
- 4.Hersh W. From Implementation to Analytics: The Future Work of Informatics [Internet] Informatics. 2012 [cited 2016 Sep 21] [Google Scholar]
- 5.Smith PC, Araya-Guerra R, Bublitz C, Parnes B, Dickinson LM, Van Vorst R, et al. Missing clinical information during primary care visits. Jama. 2005;29(3):565–571. doi: 10.1001/jama.293.5.565. [DOI] [PubMed] [Google Scholar]
- 6.O'malley KJ, Cook KF, Price MD, Wildes KR, Hurdle JF, Ashton CM. Measuring diagnoses: ICD code accuracy. Health Serv Res. 2005;40:1620–1639. doi: 10.1111/j.1475-6773.2005.00444.x. [DOI] [PMC free article] [PubMed] [Google Scholar]
- 7.Berlin JA, Stang PE. Clinical Data Sets That Need to Be Mined. In: Learning What Works: Infrastructure Required for Comparative Effectiveness Research: Workshop Summary. 2011 [PubMed] [Google Scholar]
- 8.Schlangen D, Lascarides A, Copestake A. Resolving Underspecification using Discourse Information. Perspect Dialogue New Millenn. 2003;114:287. [Google Scholar]
- 9.Harati A, Choi S-M, Tabrizi M, Obeid I, Picone J, Jacobson MP. The Temple University Hospital EEG Corpus; In: Global Conference on Signal and Information Processing (GlobalSIP); 2013. pp. 29–32. IEEE. IEEE; [Google Scholar]
- 10.Society ACN, others. Guideline 7: Guidelines for writing EEG reports. J Clin Neurophysiol Off Publ Am Electroencephalogr Soc. 2006:23–118. doi: 10.1097/00004691-200604000-00008. [DOI] [PubMed] [Google Scholar]
- 11.Gerber PA, Chapman KE, Chung SS, Drees C, Maganti RK, Ng Y, et al. Interobserver agreement in the interpretation of EEG patterns in critically ill adults. J Clin Neurophysiol. 2008;2(5):241–249. doi: 10.1097/WNP.0b013e318182ed67. [DOI] [PubMed] [Google Scholar]
- 12.Mikolov T, Dean J. Distributed representations of words and phrases and their compositionality. Adv Neural Inf Process Syst. 2013 [Google Scholar]
- 13.Guthrie D, Allison B, Liu W, Guthrie L, Wilks Y. A closer look at skip-gram modelling [Internet].; In: Proceedings of the 5th international Conference on Language Resources and Evaluation (LREC-2006); 2006. pp. 1–4. [cited 2016 Sep 21]. page. [Google Scholar]
- 14.Iyyer M, Manjunatha V, Boyd-Graber J, Daumé III H. Deep Unordered Composition Rivals Syntactic Methods for Text Classification [Internet].; In: Proceedings of the 53rd Annual Meeting of the Association for Computational Linguistics and the 7th International Joint Conference on Natural Language Processing (Volume 1: Long Papers); Beijing, China. 2015. Association for Computational Linguistics. [Google Scholar]
- 15.Ba J, Mnih V, Kavukcuoglu K. Multiple Object Recognition with Visual Attention. ArXiv14127755 Cs. 2014 [Google Scholar]
- 16.The Unreasonable Effectiveness of Recurrent Neural Networks [Internet]. [cited 2016 Mar 10]; Available from: http://karpathy.github.io/2015/05/21/rnn-effectiveness/
- 17.Smith SJM. EEG in the diagnosis, classification, and management of patients with epilepsy. J Neurol Neurosurg Psychiatry. 2005;76(Suppl 2):ii2–7. doi: 10.1136/jnnp.2005.069245. [DOI] [PMC free article] [PubMed] [Google Scholar]
- 18.Linden M, Habib T, Radojevic V. A controlled study of the effects of EEG biofeedback on cognition and behavior of children with attention deficit disorder and learning disabilities. Biofeedback Self-Regul. 1996;2(1):35–49. doi: 10.1007/BF02214148. [DOI] [PubMed] [Google Scholar]
- 19.Yamada T, Meng E. Practical Guide for Clinical Neurophysiologic Testing: EP, LTM, IOM, PSG, and NCS. Lippincott Williams & Wilkins;; 2012. [Google Scholar]
- 20.Sarkar M, Leong T-Y. Fuzzy K-means clustering with missing values. [Internet]; In: Proceedings of the AMIA Symposium. American Medical Informatics Association; 2001. p. 588. [cited 2016 Sep 21] [PMC free article] [PubMed] [Google Scholar]
- 21.Arya S, Mount DM, Netanyahu NS, Silverman R, Wu AY. An optimal algorithm for approximate nearest neighbor searching fixed dimensions. J ACM JACM. 1998;4(5):891–923. [Google Scholar]
- 22.Pennington J, Socher R, Manning CD. Glove: Global Vectors for Word Representation. In: EMNLP. 2014:1532–43. [Google Scholar]
- 23.Learning Low-Dimensional Representations of Medical Concepts. [PMC free article] [PubMed]
- 24.An Ensemble Method for Spelling Correction in Consumer Health Questions. [PMC free article] [PubMed]
- 25.Hochreiter S, Schmidhuber J. Long short-term memory. Neural Comput. 1997;9:1735–1780. doi: 10.1162/neco.1997.9.8.1735. [DOI] [PubMed] [Google Scholar]
- 26.Glorot X, Bordes A, Bengio Y. Deep Sparse Rectifier Neural Networks. In: Aistats. 2011:275. [Google Scholar]
- 27.Hochreiter S, Bengio Y, Frasconi P, Schmidhuber J. A field guide to dynamical recurrent neural networks. IEEE Press; 2001. Gradient flow in recurrent nets: the difficulty of learning long-term dependencies [Internet] [cited 2016 Sep 21] [Google Scholar]
- 28.Kingma D, Ba J. Adam: A Method for Stochastic Optimization. ArXiv14126980 Cs [Internet] 2014 [cited 2016 Sep 21] [Google Scholar]
- 29.Abadi M, Agarwal A, Barham P, Brevdo E, Chen Z, Citro C, et al. TensorFlow: Large-scale machine learning on heterogeneous systems, 2015. Softw Available Tensorflow Org. 2015;1 [Google Scholar]
- 30.Cortes C, Vapnik V. Support vector machine. Mach Learn. 1995;2(0):273–297. [Google Scholar]
- 31.Pedregosa F, Varoquaux G, Gramfort A, Michel V, Thirion B, Grisel O, et al. Scikit-learn: Machine learning in Python. J Mach Learn Res. 2011;1(2):2825–2830. [Google Scholar]
- 32.Lotte F. In: Guide to Brain-Computer Music Interfacing. Springer; 2014. A tutorial on EEG signal-processing techniques for mental-state recognition in brain–computer interfaces [Internet] pp. 133–161. [Google Scholar]