Abstract
Cancer is a complex multifactorial disease state and the ability to anticipate and steer treatment results will require information synthesis across multiple scales from the host to the molecular level. Radiomics and Pathomics, where image features are extracted from routine diagnostic Radiology and Pathology studies, are also evolving as valuable diagnostic and prognostic indicators in cancer. This information explosion provides new opportunities for integrated, multi-scale investigation of cancer, but also mandates a need to build systematic and integrated approaches to manage, query and mine combined Radiomics and Pathomics data. In this paper, we describe a suite of tools and web-based applications towards building a comprehensive framework to support the generation, management and interrogation of large volumes of Radiomics and Pathomics feature sets and the investigation of correlations between image features, molecular data, and clinical outcome.
1. Introduction
The ability to precisely determine the sub-type of a cancer and consequently predict outcome and response to treatment are the two pillars of precision medicine for cancer diagnostics and therapeutics. This requires integration and interpretation of information obtained from multiple types of data. Image features play a crucial role in creating powerful, predictive cancer characterizations and are a key component of the increasingly complex landscape of information relevant to cancer diagnosis and treatment. Molecular cancer characterizations often inform prognosis and options for targeted therapy, but few treatment decisions hinge on this information alone. In virtually all cases, Pathology and Radiology information is a crucial component in decision-making. Furthermore, features derived from Pathology and Radiology images combined with molecular and clinical information, has the promise of leading to machine learning driven in-silico test beds to compare treatment options.
Many researchers have developed methods to extract image features from Radiology or digital Pathology studies and to link these features to outcome predictions and molecular characterizations [1-29]. The field of biomedical imaging is evolving towards an “omics” approach with the goal of quantification and characterization of large collections of imaging features. The emerging field of Radiomics aims to provide a comprehensive quantification of tumor properties at macro-scales through high-throughput generation and interrogation of large numbers of medical imaging features [23-29]. We call its histopathology counterpart Pathomics, the process of generating, interrogating, and characterizing large volumes of quantitative features from high-resolution tissue images.
Radiomics and Pathomics characterize tumor properties at different biological scales and drive a need to understand correlations between extracted image features, genomics, and clinical outcomes. Moreover, rapid advancement in the field of Pathomics [16, 30] brings the need for researchers and clinicians to be able to meaningfully interrogate Pathomics data with Radiomics data along with clinical phenotypes, which are shaped by patient demographics, genomics and outcomes.
In this paper, we describe a suite of tools and web-based applications to support integrated management and exploration of Radiomics and Pathomics data. This software suite is designed to provide user-facing interactive visual analytics and related data management support for the development of large multi-scale feature sets. Large volumes of robust imaging feature sets are crucial in both Radiomics and Pathomics to create powerful, highly predictive disease characterizations, especially cancer characterization. Scalable and flexible databases are needed to index and manage image feature sets, as both Radiomics and Pathomics feature sets can contain hundreds to thousands of feature types and Pathomics datasets contain large volumes of segmented objects. The software suite integrates flexible data models supported by an agile data management system with visual analytics and query capabilities.
The contributions of our work can be summarized as follows: (1) We demonstrate the feasibility of coordinated and combined management and exploration of Radiomics and Pathomics datasets in a common software framework and set of software components; (2) We employ emerging and state-of-the- art Web and database technologies (such as JSON and NoSQL databases, JavaScript for client-side web apps) that enable efficient management and exploration of large volumes of image features; (3) Our work presents a step towards building capabilities for integrated analysis of Radiology and Pathology image data; and (4) We demonstrate the application of the software suite in the context of Non Small Cell Lung Cancer (NSCLC) and Glioblastoma Multiforme (GBM) but the techniques can be used for linking Radiology, Pathology feature sets from any organ site.
2. Methods
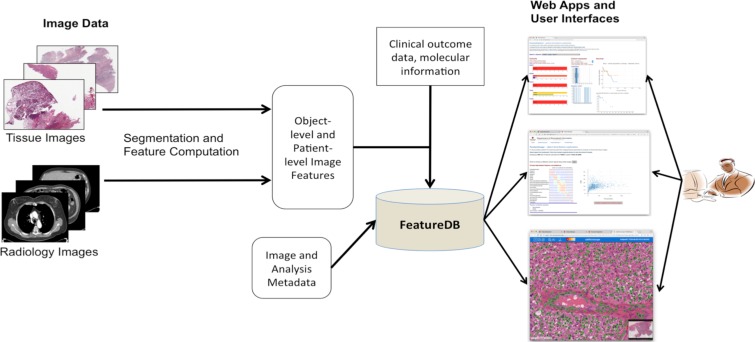
Figure 1 shows the main components of the software suite. Images are analyzed through manual or computerized analysis pipelines to segment objects (e.g., nuclei, nodules) and compute image features for the segmented objects. The object-level features are aggregated to produce patient-level image features. The analysis results as well as related image and analysis metadata are stored and managed in a data management system (FeatureDB). Relevant patient, clinical and molecular data are also stored and linked to the analysis results in the data management system. A set of web-based applications (FeatureVis and caMicroscope) allows a researcher to (1) query feature sets stored in the data management system, (2) interactively visualize and explore correlations between multiple imaging features as well as between imaging features and molecular and clinical data, and (3) visualize segmentation results and image data.
Figure 1:
Software suite to manage and explore combined Radiomics and Pathomics data along with patient molecular and outcome information. Pathology and Radiology images are processed through respective segmentation and feature computation pipelines. The analysis results (Radiomics and Pathomics data) are loaded to the database. The user interacts with the analysis results via a set of Web- based applications and interfaces. These applications are shown in higher resolution in Figures 3-6.
2.1. FeatureDB: Database of Imaging Features
Pathomics and Radiomics image analysis pipelines can generate large volumes of shape, intensity, texture and size features. For example, an analysis pipeline on a whole slide tissue image will, on average, segment 400K to over 1 Million (M) nuclei and compute tens to hundreds of size, shape, texture and intensity features for each segmented nucleus. While some features are commonly computed in imaging studies, the specific set of features often depends on the scientific aims of a study and may change over time. This means flexible data models are needed to represent and index imaging features, and these models should be backed by scalable database systems. NoSQL database technologies have emerged to address the challenges of managing Big Data in a variety of application domains. An increasing number of NoSQL database systems support the storage, management and exchange of data as JavaScript Object Notation (JSON) documents -- JSON is a lightweight, human-readable data representation and interchange format, which supports flexible and modular data representation. JSON and NoSQL systems together provide an agile data management environment by allowing for flexibility in document structures. To take advantage of these technologies, we have developed two data models to represent segmentation and feature data generated from analyses of 2-dimensional (2D) images. The first data model represents object-level features. It borrows data elements from AIM [31] and our prior work with PAIS [32] and organizes them in a model that is compliant with the GeoJSON specification [33]. It expresses segmentation results as polygons and features for each segmented object as key-value pairs. The second data model represents patient- level aggregated features -- features computed per segmented object are aggregated across all the images belonging to a given patient to calculate medians, standard deviations, etc. These two models are used to represent shape, intensity, texture and size features computed from both Radiology and Pathology 2D images. We have implemented a MongoDB1 database, referred to here as FeatureDB, to manage and query documents based on the two data models. This database provides a set of helper programs to load datasets and a RESTFUL service API to query and retrieve data.
2.2. Feature Vis: Visual Query and Analytics for Ad hoc Exploration of Feature Sets
The software suite includes web-based applications for coordinated spatial and feature based visual analytics. These applications support the visualization of inter-related imaging features and allow users to interactively inter-relate collections of features with images and non-imaging data such as demographics, gene alteration, prognosis and survival. For univariate feature visualization we use standard visualizations such as bar/pie charts and histograms. For multivariate feature exploration, we use visualization strategies such as Scatter Plot of Matrices. FeatureVis provides an interface going from the feature level to the population and back to individual patients or features.
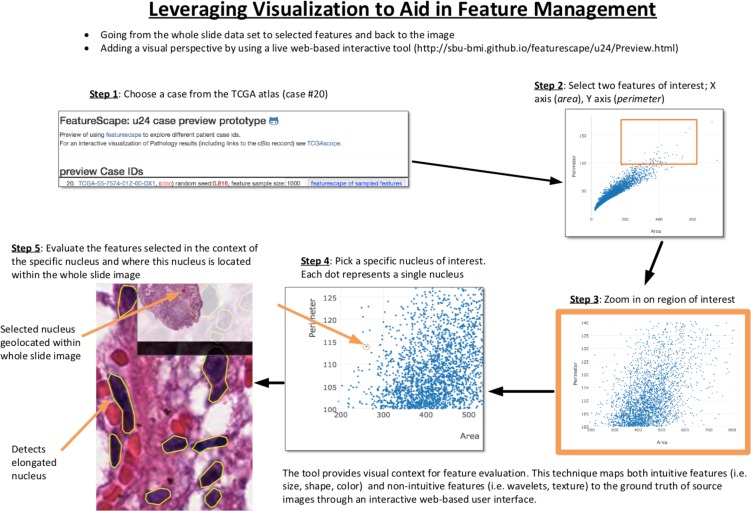
Figure 2 illustrates an example of the visual analytics process. In this example, the user selects one or more images (Step 1). She visualizes the correlation of a pair of features (e.g., Area vs Perimeter) at different levels of resolution (Steps 2-4). The user then visualizes the tissue region of interest (based on selection of particular area and perimeter values) along with the segmentation results as overlaid on the image (Step 5). Radiomics and Pathomics are both characterized by a very large parametric space in terms of both number of objects (e.g., nuclei, nodules) as well as number of features associated with each object. In order to speed up visual analytics queries, the data is maintained and indexed in FeatureDB. In addition, a uniformly distributed random value is assigned to a sampling hook variable (“randval”) with each of the objects when data is loaded to FeatureDB. This is done in order to enable random extraction of data sets with arbitrary sizes, while satisfying constraints about the values of each of the features. The rationale for this configuration is to enable efficient traversal of a very large feature space defined by the feature values and achieve real-time interactivity. Furthermore, this fast sampling approach enables the exploration of multivariate statistics methods that might identify meaningful associations between morphology parameters, as defined by alternative similarity metrics and amalgamating schemes for the cluster analysis. A key design decision in our implementation is the decoupling between the data layer (server-side, FeatureDB), from the analytical engine which runs entirely within the web browser (client- side, JavaScript). The client interacts with the database server through a RESTFUL API.
Figure 2:
Visual analytics and exploration of feature sets.
2.3. caMicroscope: Platform for exploring and visualizing whole slide images and segmentation results and features
The third component that facilitates the interactive exploration of feature sets is caMicroscope2 — a free and open source platform for visualizing digital pathology images with segmentation results and features that are overlaid on the images [34]. The segmentation results and features are retrieved from FeatureDB, as a user is exploring the image. caMicroscope also provides APIs that allow the programmatic creation of a presentation state. This is particularly useful when interfacing with FeatureVis, as it allows a user to use FeatureVis to create a cohort, using a combination of clinical and image feature attributes, and then inspect zoomed-in areas, where those features are evident. Such interactive back-and-forth between caMicroscope and FeatureVis allows for deeper understanding of the feature sets that a researcher or clinician may be studying.
3. Results
The feasibility of managing and interactively traversing a large collection of Radiomics and Pathomics feature sets was assessed by data generated from non-small cell lung cancer (NSCLC) and from Glioblastoma Multiforme (GBM) cases.
The NSCLC dataset consists of 31 patients. CT images for these patients were retrieved from The Cancer Imaging Archive (TCIA). The whole slide tissue images (WSIs) stained with Hematoxylin and Eosin (H&E), molecular and epidemiological data for the same patients were downloaded from The Cancer Genome Atlas repository. Using Slicer [4], a board-certified Radiologist segmented tumor margins in the CT studies. Four features quantifying tumor intensity, shape, texture and wavelet texture were extracted for each patient. A level set based segmentation algorithm is employed to process the WSIs and extract nuclei[35]. To segment nuclei in a H&E stained histopathology image, the color of the image was normalized to a well stained template image in the L*a*b color space. Then, the Hematoxylin (stained on nuclei mainly) channel was extracted through a color decomposition process. After that, the optimal threshold in the hematoxylin channel was computed, and a localized region based level set method was used to determine the contour of each nucleus. In cases where several nuclei were clumped together, a hierarchical mean shift algorithm was used to separate the clump into individual nuclei. Seventeen intensity, size and shape features were computed for each segmented nucleus. The segmentation and feature computation steps were executed on a compute cluster by partitioning each WSI into tiles and processing tiles concurrently on multiple cluster nodes, as these steps are computationally expensive and can generate millions of nuclei.
Nucleus-level features were aggregated for each patient to compute 25% quartile, median, and 75% quartile values of each feature. These patient-level features were also stored in the database.
The GBM dataset is composed of 46 patients with MRI data available in the Cancer Imaging Archive. These patients were a subset of the Brain Tumor Segmentation Challenge (BraTS) challenge. Each patient had T1 pre and post-contrast images as well as T2 and FLAIR. Images were first run through the pre-processing pipeline that consisted of image normalization, registration and skull-stripping. The images were then segmented into 4 regions:
enhancing tumor, core, edema and non-enhancing tumor. Features were extracted from each region included those based on shape, size, texture and margins. The WSIs and related genomic and outcome data were downloaded from the TCGA repository. The WSIs were analyzed using the same segmentation algorithm that was used for the NSCLC WSIs. The same set of seventeen features was computed for each segmented nucleus. Like the NSCLC analysis, the nucleus-level features were aggregated to compute 25% quartile, median, and 75% quartile values of each feature for each patient. The patient-level features were also stored in the database.
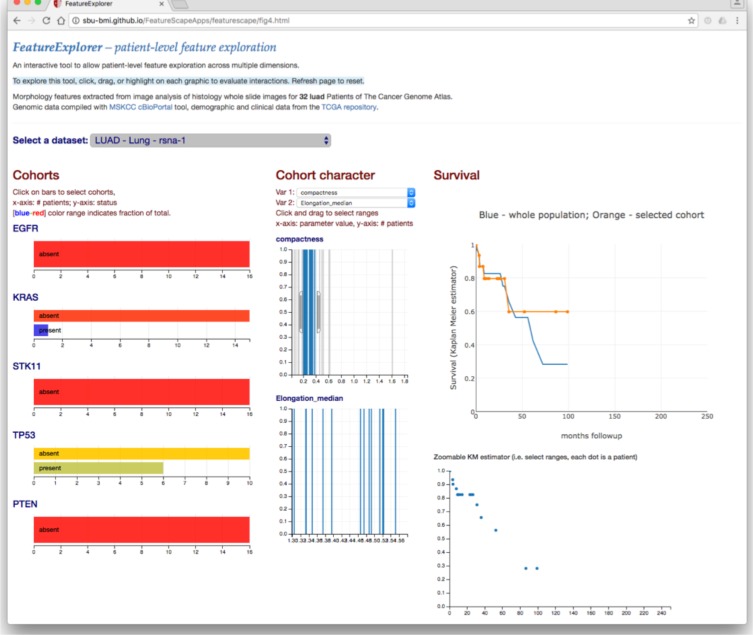
FeatureVis and caMicroscope are interfaced to the database to provide web-based graphical user interfaces for interactive exploration and visualization of the imaging features and to support grouping and selection of patient subsets for correlation with the genomic and outcomes data. The database for this study and the web applications are accessible at the following URL: http://quip1.bmi.stonybrook.edu. The NSCLC and GBM databases for this study have 38M and 47M segmented nuclei, and 646M and 799M nucleus-level features, respectively, as well as all the patient-level features. FeatureVis provides multiple web-based interfaces for a user to interact with and explore a dataset. The user can start exploring patient- level feature values and linked genomic and survival data, as shown in Figure 3 for the NSCLC dataset. In this interface, the user can select and visualize relationships between multiple patient-level imaging features (in the figure, the Radiomics feature compactness and the Pathomics feature Elongation_median feature are selected) and genomic and survival data. Selecting a range of feature values, via sliders in the graphs in the middle, will select a subset of patients that have feature values in that range. The client program will update and visualize the genomic and survival data accordingly.
Figure 3:
Web-based interfaces for visual analytics with patient-level features.
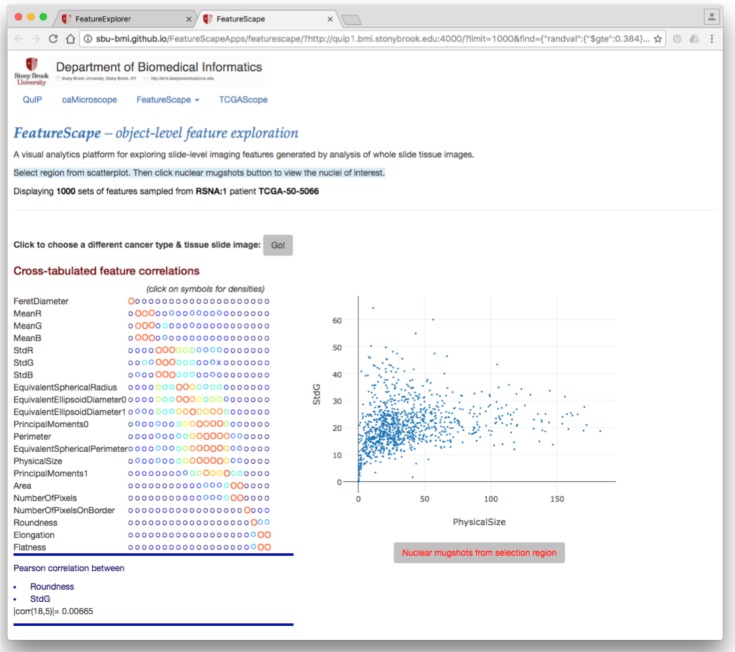
After a cohort of patients is selected, the user can drill down to the nucleus-level features for a patient. Figure 4 shows the interface for exploring the nucleus-level features generated from the whole slide tissue image(s) for a patient selected in the previous interface. In this example, patient TCGA-50-5066 was selected. The interface shows a cross-tabulated view of feature correlations. Clicking on a circle in the view on the left of the figure will display a scatter-plot of values for the selected two features. In this example, the scatter-plot displays the distribution of standard deviation in intensity of the Green channel within a nucleus and the size of the nucleus.
Figure 4:
Web interfaces for exploring nucleus-level features.
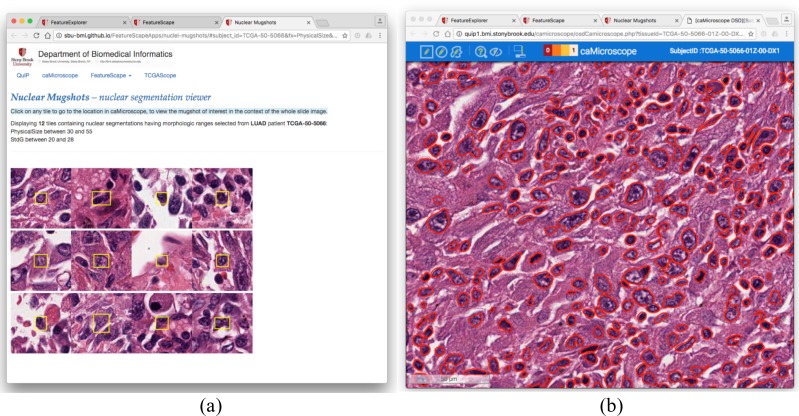
The user can select a sub-region in the scatter plot to generate a list of image patches. The middle of each image patch contains a segmented nucleus, the feature values of which are within the bounds of the sub- region selected in the scatter plot. Note that there may be thousands of nuclei that satisfy this condition. Displaying all the nuclei would create a huge and cluttered view. Instead, a subset of the nuclei and the corresponding image patches are randomly selected. To do this, the selected sub-region of the scatter plot is divided into 4x3 rectangular tiles. A nucleus is randomly selected in each tile. The resulting set of 12 image patches is displayed in the next interface as illustrated in Figure 5(a). Each image patch is linked to the source whole slide tissue image. If the user clicks on an image patch, the web application opens the caMicroscope interface with the source whole slide tissue image, centers the view such that the nucleus in the image patch is in the middle of the window. In this view, the user can select the algorithm, by which the image was analyzed, in order to visualize the segmentation results as polygons overlaid on the image. This interface is shown in Figure 5(b).
Figure 5:
(a) Display of image patches for nuclei subsampled from the scatter plot in Figure 4. The yellow rectangle in each image patch indicates the location of the selected nucleus. (b) The viewing of the segmentation results. Each red polygon indicates the boundary of a segmented nucleus. This view is linked from the image patch view in (a). When the user clicks on an image patch, the caMicroscope interface is invoked such that the segmented nucleus in the image patch is placed in the middle of the viewing window.
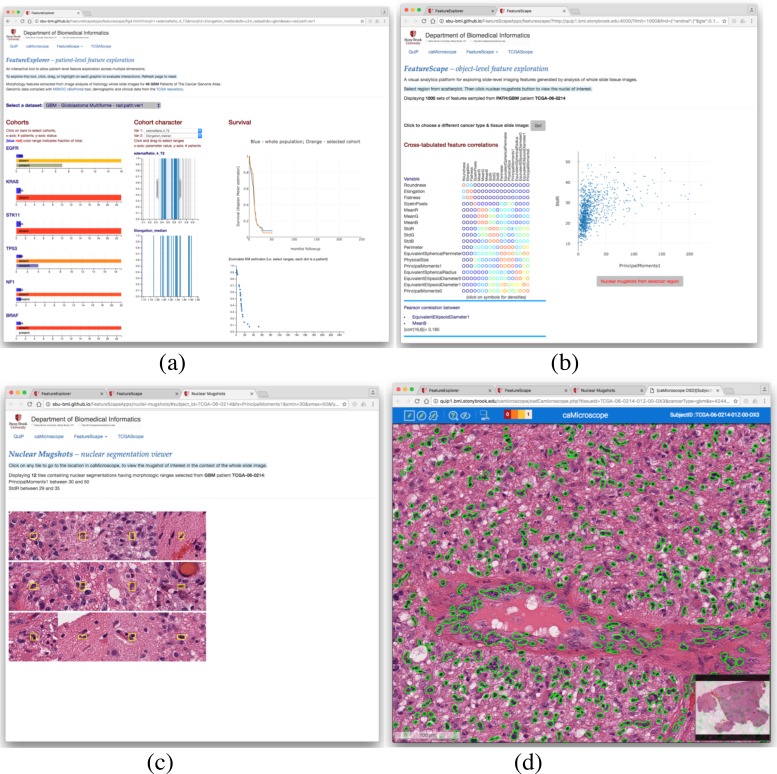
Figure 6 shows the same interfaces with the GBM dataset. The interfaces are driven by the data in the backend FeatureDB database; hence, the pull-down menus and selection options are updated based on data associated with a particular study. The user can view, query, and visualize relationships between multiple imaging features (from Radiology and Pathology data), relationships between imaging features and omics and patient survival data. The user can drill down to the images and segmentation results for each patient, explore nucleus-level features and view the results on images as in the NSCLC dataset.
Figure 6:
Feature visual analytics and exploration interfaces: (a) Patient-level features with molecular and outcome data. (b) Nucleus-level features. Visualization of image and segmentation results based on selections in the feature exploration interfaces: (c) Image patches containing segmented nucleus selected from the nucleus-level feature exploration interface. (d) Visualization of the whole slide tissue image and the segmentation results.
4. Discussion
As the two example studies show Pathomics and Radiomics data can be very large. Even for a moderate size cohort, the number of segmented objects in whole slide tissue images was about 85M, and the total number of object-level features was close to 1.5 billion. Our data models and their implementations as JSON documents allowed us to capture this information, and manage and index it in a NoSQL database. Interactive exploration of features and visualization of image data and whole slide tissue segmentation results were possible through a combination of server-side and client-side optimizations.
We plan to carry out a systematic component-level and end-to-end performance analysis of the system. Our current optimizations, nevertheless, provide interactive exploration rates. We have carefully created several compound indices on segmented objects based on common types of queries for data visualization and exploration. These indices allow for very rapid (in a fraction of a second in most cases) retrieval of objects within a view window for visualization of segmentation results. By adding a uniformly distributed random variable in each JSON document during the data load process, we were able to randomly select a subset of features for an image or a group of images efficiently. The application of modern web- technologies enabled us to push some of the computations to the web client, thus releasing the database server to rapidly respond to data selection queries. These optimizations enable search and retrieval of relevant data subsets within a few seconds. Our data loader programs are multi-threaded, in which multiple threads concurrently read, process, and load input analysis results files, and can achieve data loading rates of thousands of segmented objects and their features per second.
We have chosen JSON and NoSQL technologies for data management because of their flexibility in data modeling as well as their scalability and efficiency. We expect that additional data elements such as lab results data can be incorporated as new patient-level attributes for data exploration. We plan to look at extensions and additional data exploration capabilities that integrate such types of data in a future work.
Our work is a step towards more effective use of combined Radiomics and Pathomics data. FeatureVis and caMicroscope facilitate a multi-scale exploration of the feature data, from a cohort of patients and patient-level features to single images to features associated with segmented objects. They allow a user to create patient sub-groups as well as subsets of imaging features from Radiomics and Pathomics data. These data subsets could be queried and retrieved for use in downstream analyses. We believe the ability to rapidly explore image analysis results at multiple scales will be critical to more effectively studying and interpreting imaging features and linking them with molecular and clinical data. This would provide rich information that could be analyzed for disease diagnosis.
5. Conclusions
The ability to gain an intuitive understanding of how Radiology and Pathology derived features jointly relate to outcome and “omics” is of increasing interest to the cancer research community. The integration of Radiomics features with Pathomics features is critical to developing a 360 degree multiscale view of tumors. While a large variety and number of imaging features are produced and evaluated in imaging studies, at this time there is no integrated framework of methods and tools to enable coordinated curation, management, analysis and assessment of Radiology (Radiomics) and Pathology (Pathomics) imaging feature sets nor to support integrative analysis that combines these feature sets with molecular data to predict outcome and steer treatment. We present open source tools that allow researchers to explore these relationships. In this work, we have described a suite of tools for data management and interactive visual analytics. These tools provide a flexible data model and management system through the use of NoSQL technologies and web-based applications that take advantage of modern web-technologies (such as Java Script) and implement client and server side optimizations to support interactive exploration of datasets with hundreds of millions of segmented objects and features. We present these tools in the context of two collections of linked TCGA Radiology/Pathology/”omics” data. These tools are being used in a variety of other contexts including development of a pilot virtual tissue repository for the NCI SEER Cancer Registry program, in collaboration with the NCI Center for Biomedical Informatics and Information Technology.
Acknowledgement
This work was supported in part by 1U24CA180924-01A1 from the NCI, and R01LM011119-01 and R01LM009239 from the NLM.
Footnotes
References
- 1.Buckler A. J., Bresolin L., Dunnick N. R., Sullivan D. C., Group F. t. “Quantitative Imaging Test Approval and Biomarker Qualification: Interrelated but Distinct Activities”. Radiology. 2011;259:875–884. doi: 10.1148/radiol.10100800. [DOI] [PMC free article] [PubMed] [Google Scholar]
- 2.Clarke L. P., Croft B. S., Nordstrom R., Zhang H., Kelloff G., Tatum J. “Quantitative imaging for evaluation of response to cancer therapy”. Translational Oncology. 2009;2:195. doi: 10.1593/tlo.09217. [DOI] [PMC free article] [PubMed] [Google Scholar]
- 3.Eliceiri K. W., Berthold M. R., Goldberg I. G., Ibanez L., Manjunath B. S., Martone M. E., et al. “Biological imaging software tools,”. Nat Meth. 2012;9:697–710. doi: 10.1038/nmeth.2084. [DOI] [PMC free article] [PubMed] [Google Scholar]
- 4.Fedorov A., Beichel R., Kalpathy-Cramer J., Finet J., Fillion-Robin J.-C., Pujol S., et al. “3D Slicer as an image computing platform for the Quantitative Imaging Network”. Magnetic Resonance Imaging. 2012;30:1323–1341. doi: 10.1016/j.mri.2012.05.001. [DOI] [PMC free article] [PubMed] [Google Scholar]
- 5.Grove O., Berglund A. E., Schabath M. B., Aerts H. J., Dekker A., Wang H., et al. “Quantitative computed tomographic descriptors associate tumor shape complexity and intratumor heterogeneity with prognosis in lung adenocarcinoma,”. PLoS One. 2015;10:e0118261. doi: 10.1371/journal.pone.0118261. [DOI] [PMC free article] [PubMed] [Google Scholar]
- 6.Kalpathy-Cramer J., Freymann J. B., Kirby J. S., Kinahan P. E., Prior F. W. “Quantitative Imaging Network: Data Sharing and Competitive Algorithm Validation Leveraging The Cancer Imaging Archive”. Translational oncology. 2014;7:147–152. doi: 10.1593/tlo.13862. [DOI] [PMC free article] [PubMed] [Google Scholar]
- 7.Kuo M. D., Gollub J., Sirlin C. B., Ooi C., Chen X. “Radiogenomic Analysis to Identify Imaging Phenotypes Associated with Drug Response Gene Expression Programs in Hepatocellular Carcinoma”. Journal of vascular and interventional radiology: JVIR. 2007;18:821–830. doi: 10.1016/j.jvir.2007.04.031. [DOI] [PubMed] [Google Scholar]
- 8.Sivakumar S., Chandrasekar C. “Lung Nodule Detection Using Fuzzy Clustering and Support Vector Machines”. International Journal of Engineering and Technology. 2013;5 [Google Scholar]
- 9.Veiga C., McClelland J., Moinuddin S., Laurenco A., Ricketts K., Modat M., et al. “Adaptive radiotherapy for head and neck patients: evaluation of a deformable registration-based “dose of the day” calculation”. International Journal of Radiation: Oncology-Biology-Physics. 2013 [Google Scholar]
- 10.Waterton J. C., Pylkkanen L. “Qualification of imaging biomarkers for oncology drug development”. European Journal of Cancer. 2012;48:409–415. doi: 10.1016/j.ejca.2011.11.037. [DOI] [PubMed] [Google Scholar]
- 11.Gurcan M. N., Pan T., Shimada H., Saltz J. “Image analysis for neuroblastoma classification: segmentation of cell nuclei”; Conf Proc IEEE Eng Med Biol Soc; 2006. pp. 4844–7. [DOI] [PubMed] [Google Scholar]
- 12.Gutman D. A., Cooper L. A., Hwang S. N., Holder C. A., Gao J., Aurora T. D., et al. “MR imaging predictors of molecular profile and survival: multi-institutional study of the TCGA glioblastoma data set”. Radiology. 2013 May;267:560–9. doi: 10.1148/radiol.13120118. [DOI] [PMC free article] [PubMed] [Google Scholar]
- 13.Basavanhally A. N., Ganesan S., Agner S., Monaco J. P., Feldman M. D., Tomaszewski J. E., et al. “Computerized image-based detection and grading of lymphocytic infiltration in HER2+ breast cancer histopathology”. IEEE Transactions on Biomedical Engineering. 2010;57:642–653. doi: 10.1109/TBME.2009.2035305. [DOI] [PubMed] [Google Scholar]
- 14.Cooper L., Kong J., Gutman D., Wang F., Cholleti S., Pan T., et al. “An Integrative Approach for In Silico Glioma Research”. IEEE Transactions on Biomedical Engineering Letters. 2010;57:2617–2621. doi: 10.1109/TBME.2010.2060338. [DOI] [PMC free article] [PubMed] [Google Scholar]
- 15.Cooper L., Kong J., Gutman D., Wang F., Cholleti S., Pan T., et al. “Integrative Analysis of Image and Molecular Data for Study of Brain Tumors,”; in The NCI-NCRI Informatics Initiative Joint Conference: Biomedical Informatics without Borders: Implementing Interoperability; Bethesda, MD. 2010. [Google Scholar]
- 16.Cooper L. A., Kong J., Gutman D. A., Wang F., Gao J., Appin C., et al. “Integrated morphologic analysis for the identification and characterization of disease subtypes”. J Am Med Inform Assoc. 2012 Mar-Apr;19:317–23. doi: 10.1136/amiajnl-2011-000700. [DOI] [PMC free article] [PubMed] [Google Scholar]
- 17.Foran D. J., Yang L., Chen W., Hu J., Goodell L. A., Reiss M., et al. “ImageMiner: a software system for comparative analysis of tissue microarrays using content-based image retrieval, high- performance computing, and grid technology”. J Am Med Inform Assoc. 2011 Jul-Aug;18:403–15. doi: 10.1136/amiajnl-2011-000170. [DOI] [PMC free article] [PubMed] [Google Scholar]
- 18.Fuchs T. J., Buhmann J. M. “Computational pathology: Challenges and promises for tissue analysis”. Computerized Medical Imaging and Graphics. 2011;35:515–530. doi: 10.1016/j.compmedimag.2011.02.006. [DOI] [PubMed] [Google Scholar]
- 19.Gao Y., Tannenbaum A. “Combining Atlas and Active Contour for Automatic 3d Medical Image Segmentation,”; in Proc IEEE Int Symp Biomed Imaging; 2011. pp. 1401–1404. [DOI] [PMC free article] [PubMed] [Google Scholar]
- 20.Huang P. W., Lee C. H. “Automatic classification for pathological prostate images based on fractal analysis”. IEEE Transactions on Medical Imaging. 2009;28:1037–1050. doi: 10.1109/TMI.2009.2012704. [DOI] [PubMed] [Google Scholar]
- 21.Lu C., Mandal M. “Automated Segmentation and Analysis of the Epidermis Area in Skin Histopathological Images”; In 2012 Annual International Conference of the IEEE Engineering in Medicine and Biology Society (EMBC); 2012. pp. 5355–5359. [DOI] [PubMed] [Google Scholar]
- 22.Kong J., Cooper L. A., Wang F., Gao J., Teodoro G., Scarpace L., et al. “Machine-based morphologic analysis of glioblastoma using whole-slide pathology images uncovers clinically relevant molecular correlates”. PLoS One. 2013;8:e81049. doi: 10.1371/journal.pone.0081049. [DOI] [PMC free article] [PubMed] [Google Scholar]
- 23.Gillies R. “Radiomics: informing cancer heterogeneity,”. in J. Nucl Med. 2013:31. [Google Scholar]
- 24.Hunter L. “Radiomics of NSCLC: Quantitative CT Image Feature Characterization and Tumor Shrinkage Prediction,”. MS, University of Texas Graduate School of Biomedical Sciences at Houston. 2013 [Google Scholar]
- 25.Kumar V., Gu Y., Basu S., Berglund A., Eschrich S. A., Schabath M. B., et al. “Radiomics: the process and the challenges”. Magn Reson Imaging. 2012 Nov;30:1234–48. doi: 10.1016/j.mri.2012.06.010. [DOI] [PMC free article] [PubMed] [Google Scholar]
- 26.Lambin P., Rios-Velazquez E., Leijenaar R., Carvalho S., van Stiphout R. G., Granton P., et al. “Radiomics: extracting more information from medical images using advanced feature analysis”. Eur J Cancer. 2012 Mar;48:441–6. doi: 10.1016/j.ejca.2011.11.036. [DOI] [PMC free article] [PubMed] [Google Scholar]
- 27.Parmar C., Rios Velazquez E., Leijenaar R., Jermoumi M., Carvalho S., Mak R. H., et al. “Robust Radiomics feature quantification using semiautomatic volumetric segmentation”. PLoS One. 2014;9:e102107. doi: 10.1371/journal.pone.0102107. [DOI] [PMC free article] [PubMed] [Google Scholar]
- 28.Aerts H. J., Velazquez E. R., Leijenaar R. T., Parmar C., Grossmann P., Carvalho S., et al. “Decoding tumour phenotype by noninvasive imaging using a quantitative radiomics approach”. Nat Commun. 2014;5:4006. doi: 10.1038/ncomms5006. [DOI] [PMC free article] [PubMed] [Google Scholar]
- 29.Gillies R. J., Kinahan P. E., Hricak H. “Radiomics: Images Are More than Pictures, They Are Data,”. Radiology. 2016 Feb;278:563–77. doi: 10.1148/radiol.2015151169. [DOI] [PMC free article] [PubMed] [Google Scholar]
- 30.Yu, Kun-Hsing, Zhang Ce, Berry Gerald J., Altman Russ B., Christopher Ré, Rubin Daniel L., Snyder Michael. “Predicting non-small cell lung cancer prognosis by fully automated microscopic pathology image features.”. Nature Communications. 2016;7 doi: 10.1038/ncomms12474. [DOI] [PMC free article] [PubMed] [Google Scholar]
- 31.Channin D. S., Mongkolwat P., Kleper V., Sepukar K., Rubin D. L. “The cabig annotation and image markup project”. Journal of Digital Imaging. 2010;23:217–225. doi: 10.1007/s10278-009-9193-9. [DOI] [PMC free article] [PubMed] [Google Scholar]
- 32.Wang F., Kong J., Cooper L., Pan T., Kurc T., Chen W., et al. “A data model and database for high-resolution pathology analytical image informatics”. Journal of pathology informatics. 2011;2:32. doi: 10.4103/2153-3539.83192. [DOI] [PMC free article] [PubMed] [Google Scholar]
- 33.Butler H., Daly M., Doyle A., Gillies S., Schaub T., Schmidt C. “The GeoJSON format specification”. Rapport technique. 2008:67. [Google Scholar]
- 34.Sharma A, Kazerouni A, Saghar N, Commean P, Tarbox L, Prior F. Framework for Data Management and Visualization of The National Lung Screening Trial Pathology Images; Pathology Informatics Summit 2014; Pittsburgh, PA. 2014. May 13-16, [Google Scholar]
- 35.Yi Gao, Ratner Vadim, Zhu Liangjia, Diprima Tammy, Kurc Tahsin, Tannenbaum Allen, Saltz Joel. “Hierarchical nucleus segmentation in digital pathology images.”. In SPIE Medical Imaging. 2016:979117–979117. doi: 10.1117/12.2217029. International Society for Optics and Photonics. [DOI] [PMC free article] [PubMed] [Google Scholar]


