Abstract
A primary goal of precision medicine is to identify patient subgroups based on their characteristics (e.g., comorbidities or genes) with the goal of designing more targeted interventions. While network visualization methods such as Fruchterman-Reingold have been used to successfully identify such patient subgroups in small to medium sized data sets, they often fail to reveal comprehensible visual patterns in large and dense networks despite having significant clustering. We therefore developed an algorithm called ExplodeLayout, which exploits the existence of significant clusters in bipartite networks to automatically “explode” a traditional network layout with the goal of separating overlapping clusters, while at the same time preserving key network topological properties that are critical for the comprehension of patient subgroups. We demonstrate the utility of ExplodeLayout by visualizing a large dataset extracted from Medicare consisting of readmitted hip-fracture patients and their comorbidities, demonstrate its statistically significant improvement over a traditional layout algorithm, and discuss how the resulting network visualization enabled clinicians to infer mechanisms precipitating hospital readmission in specific patient subgroups.
Introduction
A wide range of studies1,2,3,4-5 on topics ranging from molecular to environmental determinants of health have shown that most humans tend to share key characteristics (e.g., comorbidities or genes) forming distinct patient subgroups. A primary goal of precision medicine is to identify such patient subgroups and infer their underlying disease processes in order to design interventions that are targeted to those processes.2,4
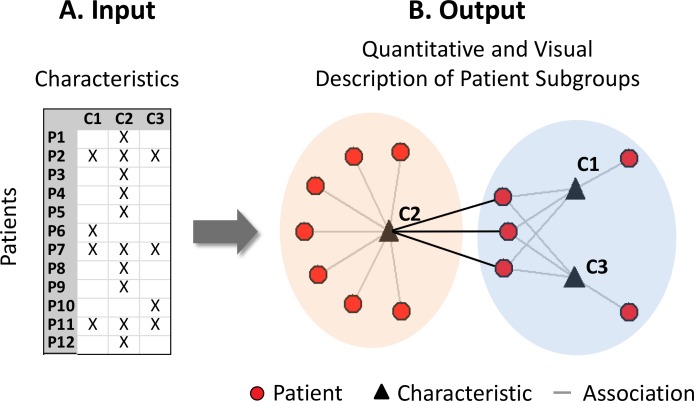
One approach for quantitatively identifying such patient subgroups and their characteristics and enabling their comprehension has been through patient-characteristic bipartite networks.6 This approach takes as input any dataset consisting of patients and characteristics (Figure 1A), and automatically outputs a quantitative and visual description of patient subgroups (Figure 1B). The quantitative output provides the number, size, and statistical significance of patient subgroups and their most highly co-occurring characteristics (referred to here as a cluster). The visual output displays the quantitative information of the clusters through a network diagram. As shown in Figure 1B, a network7 consists of nodes (circles and triangles) and edges (lines connecting the circles to triangles), which represent the association between patients and their characteristics (e.g., a patient has diabetes).
Figure 1.
Bipartite networks of patients and characteristics are designed to automatically generate the number, size and significance of patient subgroups, and a visualization showing relationships within and across patient subgroups.
A key advantage of a bipartite network visualization is that besides showing the number and size of the patient subgroups, it also reveals the relationships within and across patient subgroups. For example, the network visualization in Figure 1B reveals that patients in the left subgroup have a more uniform profile compared to patients in the right subgroup. Furthermore, three patients in the right subgroup share a characteristic that occurs most frequently in the left subgroup (shown by the darker edges between the subgroups), whereas none of the patients in the left subgroup share a characteristic frequently occurring in the right subgroup. Such relationships could enable clinicians to infer for example that the disease processes and interventions in the right subgroup involve complex interactions, and which could overlap with the left subgroup.
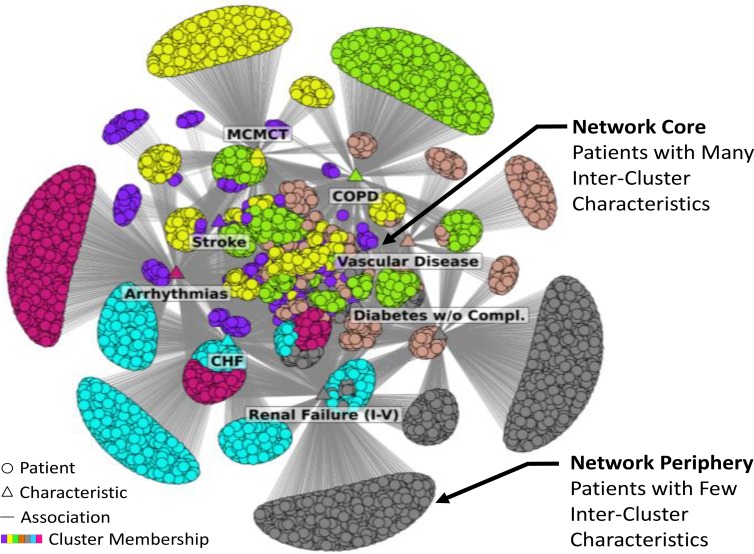
However, while patient-characteristic network layouts have been successful in identifying patient subgroups in a wide range of clinical and molecular datasets, they often fail to reveal such subgroups despite the networks having significant clustering. For example, Figure 2 shows a bipartite network consisting of all 30-day readmitted hip fracture (HFx) patients (n=6150) extracted from the 2010 Medicare database that had at least one of the 8 significant comorbidities shown. Unfortunately, the network layout generated by Fruchterman-Rheingold8 (FR), a well-known force-directed algorithm, is difficult to comprehend despite the network having strong clusteredness (Barber co-clustering modularity9=0.440 determined by using an efficient algorithm that combines cluster tuning with agglomeration10,>11) that is significant (p<.001), when compared to a distribution of the same quantity generated from 1000 random permutations14 of the network, while preserving the network size (number of nodes) and the network density (number of edges). Furthermore, the use of distinct colors to denote each co-cluster of patients and comorbidities does not improve comprehension of the network. Such networks are colloquially referred to as a “giant hairball.”
Figure 2.
Bipartite network of 6150 readmitted hip fracture patients extracted from the 2010 Medicare database that had at least one of 8 significant comorbidities. Despite strong and significant clustering, the network had highly overlapped clusters in the center of the network, resulting in a core- periphery network topology
A key topological property that exists across many such large patient-characteristic networks is that although they exhibit strong clustering, there are many patients that share characteristics outside their clusters. As shown in Figure 2, this overlap of clusters results in a core-periphery topology7 where there are many patient nodes in the central core of the network that have inter-cluster characteristics, and many patient nodes in the periphery that have few inter-cluster characteristics. This effect is especially accentuated by the FR force-directed algorithm which uses attractive forces between connected nodes (pulling together highly-connected nodes to the center), and repulsive forces between disconnected nodes (pushing apart sparsely-connected nodes to the periphery). Unfortunately, while the overlap of clusters is comprehensible in small datasets (e.g., Figure 1A), the overlap in the core tends to be too dense for comprehension in large datasets despite having significant clustering (e.g., Figure 2).
Because comprehending how patients share characteristics within and across clusters is critical for inferring their mechanisms, we were motivated to develop an approach that preserved the topology of each cluster (which separates patients with inter- versus intra-cluster characteristics), while also preserving the adjacency relationships among clusters (which reveals patient subgroups that share more characteristics with each other compared to others).
Existing Methods to Enhance the Comprehension of Clusters in Network Layouts
Given the high search complexity involved in generating layouts for large networks, there is growing consensus that there is no best way to lay out a network, but rather the selection or design of an approach should be guided by the need to highlight specific features of the network that are relevant for the task.12 Consequently, there have been several attempts to enhance the comprehension of clusters in giant hairball networks to perform different tasks, each with important conceptual and pragmatic trade-offs.12 These attempts tend to fall under three broad categories:
Multi-level aggregation approaches which attempt to abstract networks at different levels of granularity to reveal patterns such as clusters. For example, nodes are aggregated based on network or other properties, and the edges across the aggregated nodes are summed to form a single weighted edge connecting the aggregated nodes.13 The output is a series of networks at different levels of granularity. While such approaches are useful to get a quick overview of the overall structure of the network, it requires navigating between the different levels of granularity. Such navigation can be challenging when trying to infer mechanisms in subgroups requiring an understanding of both detail and global structure simultaneously.
Force modification approaches which attempt to introduce externally-determined cluster membership information into the calculation of forces in a specific force-directed algorithm. For example, these methods increase the attractive forces between nodes in the same cluster, or add a virtual node to each cluster with additional edges to each member of that cluster.14 Such modifications of forces result in nodes belonging to a cluster to be closer to each other compared to what a traditional layout (with no knowledge of externally- determined clusters) produces. While such approaches produce a single layout, they can substantially alter the topology of specific clusters in addition to the overall network, and therefore could affect the inferential process. Furthermore, as each dataset has different densities of clusters, the modifications of forces required to achieve the desired affect could vary across datasets, requiring considerable knowledge of the underlying algorithm for effective use.12
Cluster repositioning approaches which attempt to move clusters such that there is greater separation between them. For example, the Group-in-a-Box15 algorithm isolates each cluster by removing inter-cluster edges and re- laying out nodes in each cluster using a force-directed algorithm. Each cluster is then placed in a minimal bounding box, and the collection of bounding boxes are rearranged using a tree-map16 algorithm to fit in a compact rectangle. This approach is most useful when the primary task is to comprehend local cluster topologies, independent of the global topology. However, the approach neither preserves the local topology of each cluster with respect to the full network (as the inter-cluster edges are ignored when the cluster is re-laid out), nor preserves the global topology (as the cluster locations are organized by a tree-map algorithm which does not preserve the adjacency relationship between the clusters).
While each of the above methods are effective for different types of tasks, our analyses of patient-characteristic networks suggest that an effective network layout requires two critical features: (1) preservation of local cluster topology with respect to the global network, which enables comprehension of which and how many patients share characteristics within and outside their clusters; (2) preservation of the inter-cluster adjacencies, which enables comprehension of which combinations of clusters share more characteristics compared to other clusters. As none of the existing methods satisfy both these constraints, we were motivated to develop ExplodeLayout, an approach which attempts to satisfy the above properties critical for the comprehension of patient subgroups in precision medicine.
Method
Intuition Underlying the ExplodeLayout Algorithm
Our method was inspired by exploded view17 drawings commonly used to explain complex mechanical or architectural assemblies (e.g., an engine or desk). The goal of such drawings is to illustrate how the components of an assembled object are related to each other to facilitate tasks such as assembling parts during manufacturing, or disassembling them during repairs. Because a fully-assembled object often occludes the whole or parts of its components, the exploded view considers each component as a solid object which is moved a small distance away from the components immediately adjacent to it. This separation reveals important details about the shape of each component, and its relationship to the other components.
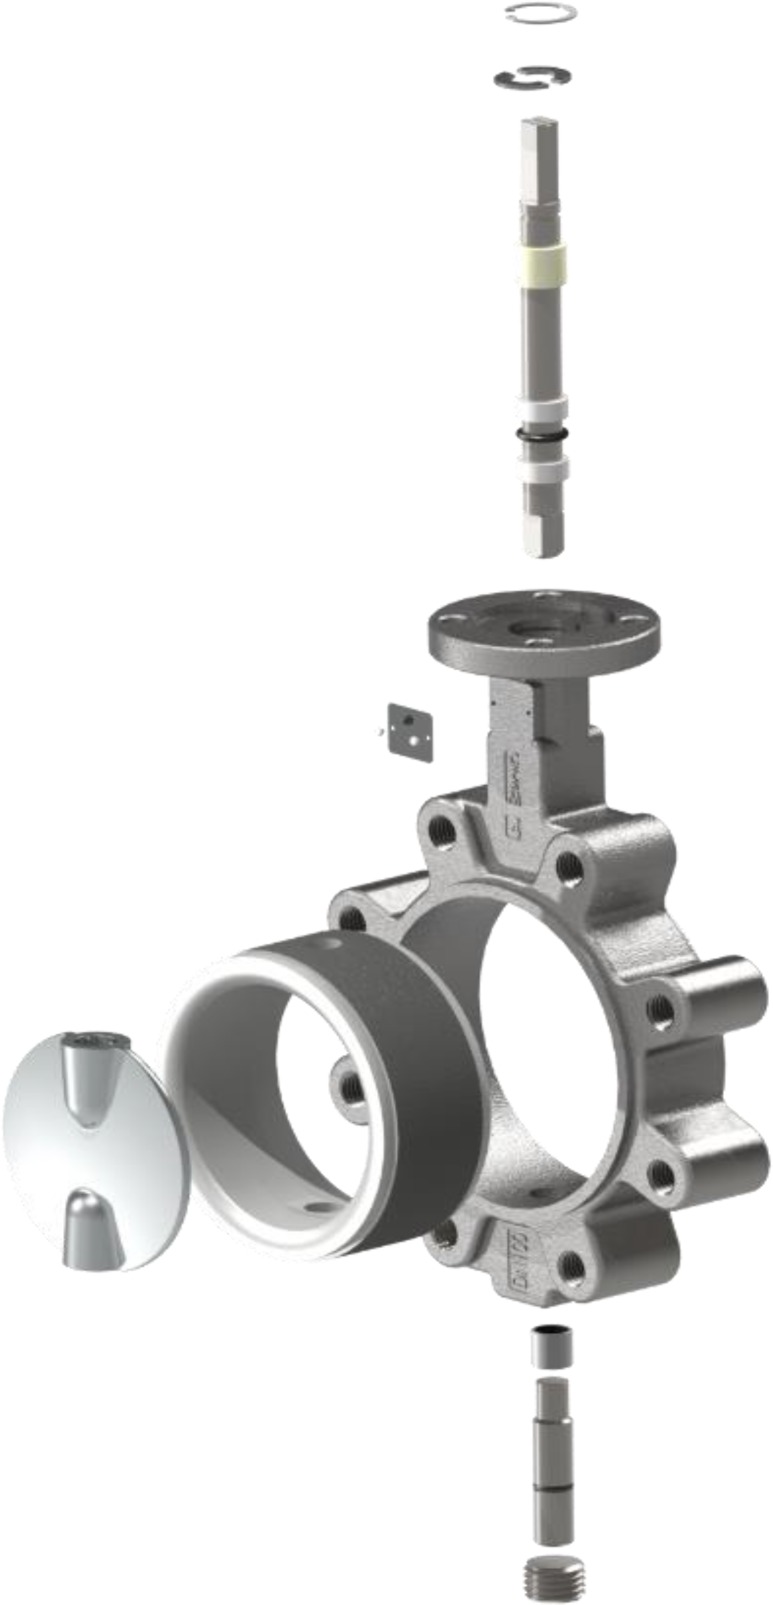
The separation of components can be along one or more axes depending on the topology of the object. For example, Figure 3 shows an assembly18 that has been exploded in the horizontal and vertical axes. When assemblies have a circular topology, the explosion can occur across multiple intersecting axes resulting in a radial exploded view.
Figure 3.
Exploded view of an assembled mechanical part where the components have been exploded in the horizontal and vertical axes to reveal details of their shape, while preserving their adjacency relationships to the other components in the assembly.
While exploded views preserve the topology of the components in addition to their relative adjacencies to other components in the assembly, they distort the actual distance between the components, and increase the overall size of the drawing. Because exploded views are intuitive and commonly used to describe furniture and other assemblies, we used it to guide the design of the ExplodeLayout method for networks. Therefore, we regarded clusters in the network as analogous to solid components of an assembly, and the separation of those clusters as analogous to the separation of components in an exploded view.
Design and Implementation of the ExplodeLayout Algorithm
Below we describe the geometry, search, visualization, and implementation of the ExplodeLayout algorithm:
-
Geometry. As shown in Figure 4A, the algorithm requires as input the coordinates of network nodes generated by any force-directed algorithm such as FR, including the number and members of clusters generated by a modularity algorithm1 (standard in most network applications). As shown in Figure 4B, this information is used to generate the centroid of each cluster (using median x and y coordinates of all nodes in the cluster), and the centroid of the entire network (using median x and y coordinates of all nodes in the network). Next, as shown in Figure 4C, the algorithm constructs an imaginary explode circle whose center is the centroid of the network, which has n equidistant points on its circumference where n=number of the clusters, and whose radius is determined by a search (see below). The nodes within each cluster are then moved by the same distance and angle, such that the centroid of that cluster coincides with the closest point on the circle.
However, when clusters are merely shifted to the equidistant points on the circle, this translation can change the orientation of the cluster with respect to its orientation in the original FR network. As shown in Figure 2, the FR algorithm places patients with few characteristics in the periphery of the network pointing radially outwards from the network centroid. Therefore, as shown in Figure 4D, after a cluster is moved to a point on the exploded circle, our algorithm rotates the cluster around its centroid to match its original orientation in the FR network. The angle and the direction of this corrective rotation is determined by calculating the difference in angle between two lines: (1)a line joining the centroid of the network and the centroid of the cluster, and (2) a line joining the centroid of the network and the destination point on the explode circle for that cluster. We refer to this explosion method as the equidistant explosion plus rotation method. Finally, as shown in Figure 4E, once the nodes of the network are moved to the exploded circle, the nodes are connected by edges based on the original network, and displayed.
-
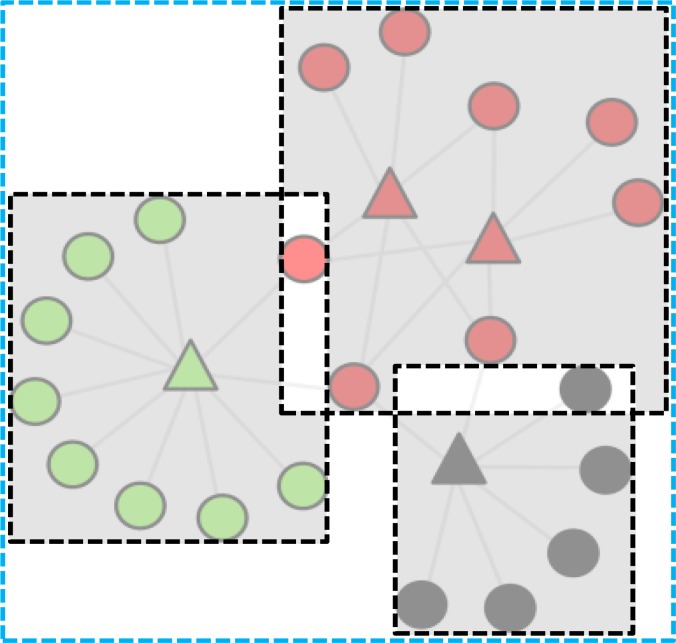
Search. While the separation of the clusters was the main goal of the algorithm, we needed to determine the optimal level of that separation to ensure that the layout was compact. Very large visualizations result in the “focus vs. context”19 dilemma requiring users to zoom in to comprehending details of specific node associations, and zoom out to comprehend the topology of the entire network. As information from each view has to be kept in working memory, it can reduce the ability of a user to comprehend complex local patterns in the context of global patterns. We therefore developed a measure called the compact cluster separation (CCS) score, defined as the ratio of total non-overlapped area across clusters to the total layout area of the entire network. As shown in Figure 5, the total non-overlapped area across clusters was measured by calculating the total non-overlapping area across the minimum bounding boxes for nodes in each cluster; the total layout area was measured by calculating the area of the minimum bounding box of all nodes in the network. Higher values of CCS therefore represent larger non-overlapping areas (or smaller overlap) among clusters within a smaller overall area, resulting in a compact display for the exploded network.
We used the hill-climbing search heuristic to find the maximum CCS for increasing values of the explode radius. The starting point of the search was the explode circle radius that was the closest to the CCS score for the given network layout such as the FR layout shown in Figure 2. The explode radius corresponding to the optimal CCS was used to construct the exploded network layout.
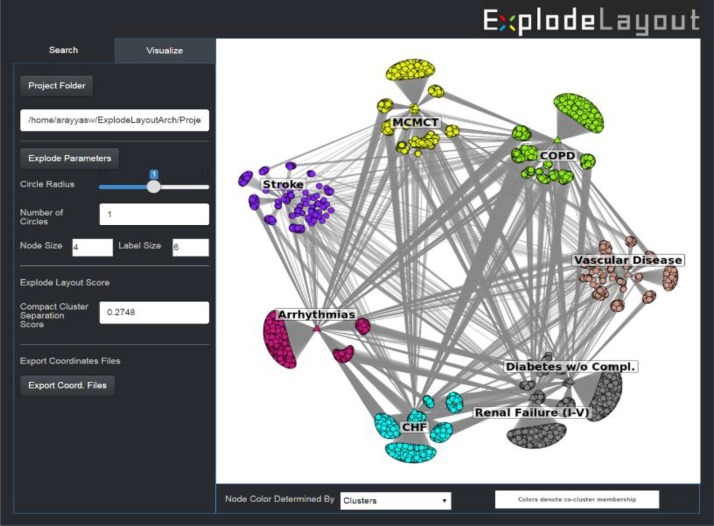
Visualization and Interactive Refinement. Because the bounding boxes around the clusters are approximations of the actual cluster shapes (e.g., overlapping areas of the bounding boxes might not contain any nodes or conversely contain a disproportionately large number of nodes), the optimal explode radius might not be the best from a human visual perspective. We therefore developed an interface which displayed the optimal layout generated from the above search, but which also enabled the modification of the explode circle radius through a scroll bar. This feature was designed to enable a user to explore other explode circle radii in the neighborhood of the optimal explode circle radius suggested by the algorithm.
Implementation. The ExplodeLayout was implemented in R (version 3.3.2) using the iGraph package (version 0.7.1) for the network layouts, the ggplot package (version 2.2.0) to display the visualizations, and the Shiny package (version 0.13.2) for the interface.
Figure 4.
The ExplodeLayout algorithm takes as input node coordinates generated from any force-directed layout algorithm, and cluster membership of each node generated from any clustering algorithm (A), calculates the centroid of each cluster (B), places n equidistant points around a circle (whose center is at the centroid of the entire network, and whose radius is determined by a search) such that n=number of clusters, and moves all nodes in each cluster such that its centroid is on the closest point on the circle (C), rotates each cluster around its centroid to match its original orientation (D), and reconnects the nodes resulting in the exploded network (E).
Figure 5.
The compact cluster separation (CCS) score is the ratio of the total non-overlapped areas of the minimum bounding boxes for each cluster (sum of the gray shaded areas), to the total area of the entire network (area enclosed by the blue dashed rectangle).
Evaluation of the ExplodeLayout Algorithm
We tested the significance, interpretability, and scalability of the ExplodeLayout algorithm as described below:
Significance. To test whether the optimal CCS generated by ExplodeLayout was significantly different from the same measure using FR, we first generated 1000 FR layouts of the readmission network with random seeds. Each random seed generates a different variation of the FR layout, and therefore the resulting distribution represents the range of layout variations FR produces. Next, for each of the 1000 FR layouts, we maximized its CCS score using the ExplodeLayout search algorithm described earlier. This produced a paired distribution of CCS scores generated from ExplodeLayout. As the two distributions were not normal, we used the Wilcoxon Signed-ranks two-tailed test (paired non-parametric significance test) to test whether the CCS scores from FR was significantly different from the CCS scores generated from ExplodeLayout.
Interpretability. To test whether the exploded layout was comprehensible and useful for inferring mechanisms relevant to precision medicine, we presented the readmission network layout with the optimal CCS score to two clinicians with experience in caring for the elderly. We explained that the patient nodes in each cluster represented patient subgroups that had a similar profile of present and absent comorbidities, and the comorbidities in each cluster represented the most frequently co-occurring comorbidities in the respective patient subgroup. We then asked the clinicians to (1) visually analyze each cluster and infer mechanisms that might precipitate the readmission for the respective patient subgroup, and provide corroborative evidence from the literature for their inferred mechanisms, and (2) provide feedback on the scroll bar to explore other degrees of cluster separation.
Scalability. To test the scalability of ExplodeLayout, we used it to analyze two subsets of an Alzheimer’s dataset consisting of patients and their single nucleotide polymorphisms (SNPs) using the recessive genetic model. The first subset consisted of 1179 patients with the top 20 univariately-significant SNPs (Alzheimer’s-20), and the second subset consisted of 1411 patients with the top 1000 univariately-significant SNPs (Alzheimer’s-1000). The latter subset was selected as it represents the upper limit of the number of variables that current co-cluster modularity algorithms can analyze for calculating modularity and its significance (requiring comparison to 1000 random variations of the network) in a reasonable amount of time.
Results
Network Layout Generated from ExplodeLayout
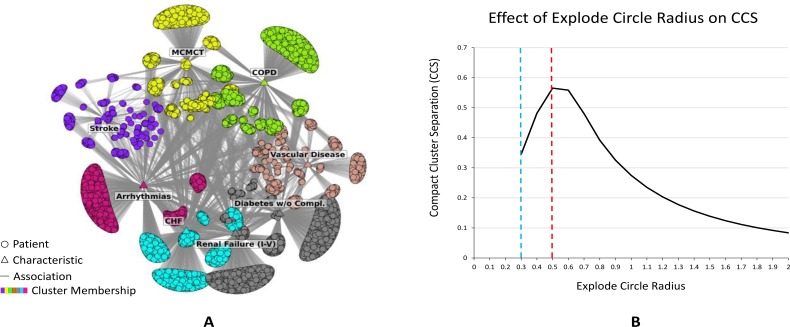
Figure 6A shows how ExplodeLayout modified the FR layout shown in Figure 2 to find new locations of the clusters on the explode circle. As shown, similar to the exploded view of mechanical and architectural drawings, the clusters have been separated while preserving (1) the topology of each cluster, (2) the adjacency relationship among the clusters, (3) each cluster’s orientation such that patients with few characteristics are in the periphery pointing radially outwards.
Figure 6.
(A) Network layout after application of the ExplodeLayout algorithm to the original layout of the readmission network shown in Fig. 2. (B) The effect of changing the explode radius on the CCS score for the readmission network. The dashed blue line shows the explode circle radius for the FR layout shown in Figure 2, and the dashed red line shows the explode circle radius corresponding to the maximum CCS score.
As shown in Figure Figure 6B, the CSS score maximized at 0.57 with an explode radius of 0.5, after which the CSS score steadily decreased as the explode radius increased. This decrease represents a declining improvement in the cluster separation accompanied by an increase in the overall space needed to display the network.
Significance
Using the Wilcoxon Ranked-test, we compared the distribution of CCS scores generated from 1000 FR layouts of the readmission network to the corresponding layouts generated from ExplodeLayout. The results revealed that the CCS scores for ExplodeLayout (Mdn = 0.577) were significantly higher compared to FR (Mdn = 0.358), Z = 27.39, p <. 001, r = 1.
Interpretability
The two clinicians together analyzed the exploded layout in Figure 6A, and were told to infer the mechanisms that could precipitate readmission in each patient subgroup. They observed that the network revealed two sets of comorbidities. The first set consisting of diabetes and renal failure (RF) had metabolic effects resulting in potential damage to multiple organs such as the liver, heart, lungs, and arteries, and therefore often referred to as systemic or metabolic diseases. In contrast, the second set consisting of congestive heart failure (CHF), arrhythmia, stroke, major complications of medical care and trauma (MCMCT), chronic obstructive pulmonary disease (COPD), and vascular disease had mainly organ-specific effects and consequences. Furthermore, they observed that as diabetes and RF together co-occurred frequently (forming the gray cluster), the processes precipitating readmission underlying that cluster was most probably related to the exacerbation of long-standing diabetes with RF causing microvascular complications. The cluster separation therefore helped to identify two categories of comorbidities, and a key co-occurrence in the network.
Next, they observed that although there were distinct patient subgroups representing global heterogeneity in readmission across the entire dataset, there appeared to be a second level of heterogeneity within each cluster shown by the different number of nodes on the inner part of the network (forming the network core). To explore this further, they increased the explode radius from the optimal radius of 0.5 (shown in Figure 6A) to 1.0. As shown in Figure 7, this additional cluster separation revealed that each cluster had many edges connecting to diabetes and RF. A quantitative test revealed that while all comorbidities in the network had high odds ratio for readmission, the odds ratios were significantly higher when a comorbidity co- occurred with diabetes and RF. Therefore the scroll bar prompted a deeper understanding of the inter-cluster patterns, and motivated the quantitative analysis to verify the observation.
Figure 7.
ExplodeLayout interface provides the ability to change the radius of the explosion through a scroll bar, which enabled users to explore other explosion radii in the vicinity of the optimal explosion suggested by the algorithm.
Next, the clinicians integrated the visual and quantitative information to hypothesize that when a patient is discharged from the hospital after hip fracture surgery, the onus of care is treatment and rehabilitation of the index condition which in the case of hip fracture includes focus on wound healing and physical therapy. However, it is common knowledge that elderly patients tend to decrease their oral intake at early stages of most acute medical conditions including hip fracture. This decreased intake contributes to dehydration, poor nutrition, and worsening renal function (which are common conditions in hospitalized elders regardless of index condition), or to poor glycemic control in diabetics. Worsening metabolic profile of the patient could trigger deterioration of the organ-specific comorbidities such as CHF and COPD. By the time the symptoms of exacerbation of the high-risk comorbidity pairs are recognized, the patients may be at such severity that it precipitates readmission requiring more acute care. This overall mechanism that precipitated readmission was corroborated with references from the literature.20,21 Therefore, the node separation, combined with the edge separation using the scroll bar, enabled the domain experts to comprehend heterogeneity at the global and the local cluster levels, resulting in a novel inference that was corroborated with references from the literature.
Scalability
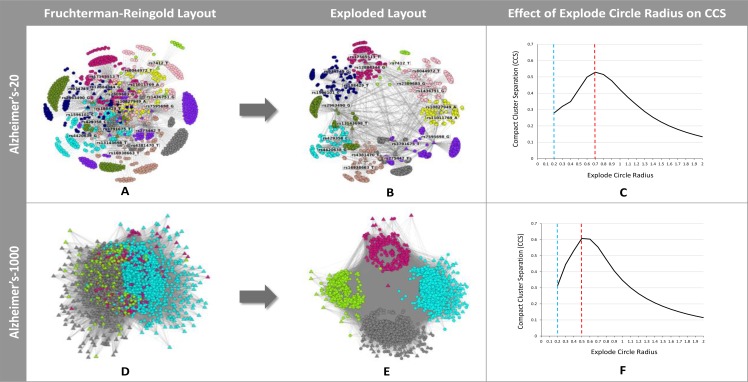
Figure 8 shows the results of using the ExplodeLayout algorithm to analyze two high-dimensional datasets. The first had 1179 patients and 20 SNPs, and the second had 1411 Alzheimer’s patients and 1000 SNPs. As shown, both datasets displayed strong separation of clusters based on the maximum CSS score generated from ExplodeLayout. In both cases, the CCS scores were significantly higher than those generated by FR (Alzheirmer’s-20: ExplodeLayout Mdn = 0.503, FR Mdn = 0.216, Z = 27.39, p <. 001, r = 1; Alzheirmer’s-1000: ExplodeLayout Mdn = 0.581, FR Mdn = 0.228, Z = 27.39, p <. 001, r = 1). Furthermore, both datasets were exploded in a reasonable amount of time (Alzheirmer’s-20 = 10 seconds, Alzheimer’s-1000 = 61 seconds).
Figure 8.
Network layouts before and after application of the ExplodeLayout algorithm for the Alzheimer’s-20 and Alzheimer’s-1000 networks, and the respective CCS scores (the dashed blue line shows the explode circle radius for the corresponding FR layout, and the dashed red line shows the explode circle radius corresponding to the maximum CCS score).
However, as shown in Fig. 8D and Figure 8E, the Alzheimer’s-1000 network has a large number of characteristics in each cluster, and the separation of patients within the clusters are not salient resulting in a recursive hairball problem. Discussion with the clinicians revealed that, at least for the problem of comprehending patient subgroups in precision medicine, datasets with such high dimensionality are typically not useful, and need to be filtered through feature selection methods before they are ready for interpretation. Therefore, while we have demonstrated that our algorithm does scale up to high dimensional data (upto the current limit of the supporting modularity and force-directed algorithms as discussed earlier), the typical datatsets analyzed for precision medicine using ExplodeLayout will probably be similar to the readmission dataset, or the Alzheimer’s-20 dataset.
Discussion
The results suggest that our attempt to design an algorithm to explode a given force-directed layout using cluster information was effective in enabling domain experts to infer novel mechanisms in readmission data. This we believe is because the algorithm preserved important features of the topology within each cluster with respect to the global topology, in addition to the adjacencies between clusters. Furthermore, the scroll bar designed to help explore other explosion circle radii in the neighborhood of the radius suggested by the algorithm, appears to be useful when inter- cluster associations through the separation of edges is important for the interpretation of patient subgroups.
Although the notion of exploding a layout based on a well-known drawing approach was conceptually a simple idea, its application to networks led us to three important insights. First, we have come to realize that repulsive forces (which push apart nodes that are not connected) in force-directed algorithms are as important as attractive forces (which pull together nodes that are connected). This explained why FR produced far better layouts with respect to separating core patient nodes (which had many inter-cluster characteristics) from periphery patient nodes (which had many intra-cluster characteristics), compared to the Kamada-Kawai22 (KK) layout algorithm which does not have repulsive forces. In this paper we therefore focused on modifying FR layouts. However, future research should explore the advantages of applying the ExplodeLayout algorithm on KK generated layouts.
We also experimented with alternate methods for determining the exploded locations of the cluster centroids. For example, to preserve the angle between clusters, we calculated cluster centroids by generating a line that connected the centroid of the entire network to the centroid of the cluster, and extending it to where it intersected the explode circle. In another approach we attempted to preserve the relative distance of the cluster centroid from the center of the network by moving each cluster by a fixed distance on a line connecting the network centroid to the cluster centroid to generate the destination location of the centroid. Additionally, in an effort to improve the accuracy of the cluster overlap calculation, we explored the use of bounding polygons instead of bounding boxes. While these methods might be useful in some cases, none of them had the general usefulness of the equidistant plus rotation approach presented.
Limitations
As discussed above, very high dimensional datasets such as Alzheimer’s-1000 lead to the recursive hairball problem, where individual clusters have no discernable structure. However, as noted by the clinicians, the patient characteristics in such high-dimensional datasets need to be reduced before they are useful for interpretation of underlying mechanisms. Therefore future systems should tightly integrate feature selection methods with layout methods such as ExplodeLayout.
Conclusions and Future Research
Although patient-characteristic bipartite networks have been used successfully to identify and interpret patient subgroups based on their characteristics in small datasets, they often fail to reveal comprehensible visual patterns in large and dense networks despite having significant clustering. We therefore developed ExplodeLayout that was specifically designed to enable the comprehension of patient subgroups with applications to precision medicine. Inspired by the well-known exploded view drawings of mechanical and architectural assemblies, we designed an algorithm that accepted as input a layout of nodes generated from a force-directed layout algorithm, and node cluster membership generated from a clustering algorithm. The ExplodeLayout algorithm used the cluster information to modify the force-directed layout while preserving the local cluster topology with respect to the global network, in addition to the inter-cluster adjacencies. This enabled clinicians to comprehend the patient subgroups and infer the respective mechanisms, a critical step in the design of targeted interventions for precision medicine.
Furthermore, we developed a new measure called compact cluster separation (CCS) which was used to maximize cluster separation while minimizing the space needed to display the network. This measure was also used to search for an optimal exploded layout, and to test whether the resulting compact cluster separation was significantly better compared to that produced by a traditional force-directed algorithm. Finally, we developed a simple interface which displayed the optimal layout determined by the search, but which also enabled users to explore other degrees of cluster separation using the scroll bar, resulting in deeper insights related to heterogeneity. Future evaluations with end users who wish to use this method will determine whether ExplodeLayout is useful and usable for a wide range of networks.
While we have developed ExplodeLayout to explode networks with a core-periphery topology resulting from overlapping clusters common in patient-characteristic networks, there can be other network topologies also resulting in incomprehensible hairballs. For example, networks could have more than one core resulting from more complex cluster overlaps requiring other explosion methods.
A critical aspect of our evaluation was to test the algorithm with real data, realistic tasks, and with clinicians vested in understanding complex clinical phenomena. Future research needs to more systematically evaluate ExplodeLayout for interpretability compared to other approaches that have been designed to enhance clustering in large and complex networks. Such investigations should enable researchers to more quickly identify and interpret patient subgroups in large and complex datasets such as electronic medical records, with the goal of designing targeted interventions that improve health outcomes, a critical goal of precision medicine.
Acknowledgements
This research was supported in part by a Clinical and Translational Science Award (UL1 TR000071) from the National Center for Advancing Translational Sciences, National Institutes of Health (SKB), and grants (DMR-1507371 and IOS-1546858) from the National Science Foundation (KEB and TC). Additionally, this research was supported by pilot grants from the Agency for Healthcare Research and Quality (R24HS022134) (SKB), the Health Innovations Program at UTMB (SKB), and the Office of Technology Transfer at UTMB (SKB). We thank J. Mathew, & G. Vallabha for their valuable contributions.
References
- 1.McClellan J, King MC. Genetic heterogeneity in human disease. Cell. 2010;141(2):210–217. doi: 10.1016/j.cell.2010.03.032. [DOI] [PubMed] [Google Scholar]
- 2.Waldman SA, Terzic A. Therapeutic targeting: a crucible for individualized medicine. Clinical Pharmacology & Therapeutics. 2008;83(5):651–654. doi: 10.1038/clpt.2008.65. [DOI] [PubMed] [Google Scholar]
- 3.Fitzpatrick AM, Teague WG, Meyers DA, et al. Heterogeneity of severe asthma in childhood: confirmation by cluster analysis of children in the National Institutes of Health/National Heart, Lung, and Blood Institute Severe Asthma Research Program. The Journal of allergy and clinical immunology. 2011;127(2):382–389. e381–313. doi: 10.1016/j.jaci.2010.11.015. [DOI] [PMC free article] [PubMed] [Google Scholar]
- 4.Collins FS, Varmus H. A new initiative on precision medicine. The New England journal of medicine. 2015;372(9):793–795. doi: 10.1056/NEJMp1500523. [DOI] [PMC free article] [PubMed] [Google Scholar]
- 5.Sorlie T, Perou CM, Tibshirani R, et al. Gene expression patterns of breast carcinomas distinguish tumor subclasses with clinical implications. Proceedings of the National Academy of Sciences of the United States of America. 2001;98(19):10869–10874. doi: 10.1073/pnas.191367098. [DOI] [PMC free article] [PubMed] [Google Scholar]
- 6.Bhavnani SK, Dang B, Bellala G, et al. Unlocking proteomic heterogeneity in complex diseases through visual analytics. Proteomics. 2015. [DOI] [PMC free article] [PubMed]
- 7.Newman MEJ Networks: An Introduction. Oxford, United Kingdom: Oxford University Press; 2010. [Google Scholar]
- 8.Fruchterman T, Reingold E. Graph Drawing by Force-Directed Placement. Software– Practice & Experience. 1991;21(11):1129–1164.. [Google Scholar]
- 9.Barber MJ. Modularity and community detection in bipartite networks. Physical Review E. 2007;76(6):066102.. doi: 10.1103/PhysRevE.76.066102. [DOI] [PubMed] [Google Scholar]
- 10.Santiago T, III, Amy N, Charo IDG, Kevin EB. Fast and accurate determination of modularity and its effect size. Journal of Statistical Mechanics: Theory and Experiment. 2015;2015(2) [Google Scholar]
- 11.Chauhan R, Ravi J, Datta P, et al. Reconstruction and topological characterization of the sigma factor regulatory network of Mycobacterium tuberculosis. Nature communications. 2016;7:11062. doi: 10.1038/ncomms11062. [DOI] [PMC free article] [PubMed] [Google Scholar]
- 12.Gibson H, Faith J, Vickers P. A survey of two-dimensional graph layout techniques for information visualisation. Information Visualization. 2012;12(3-4):324–357.. [Google Scholar]
- 13.Cohen J. Drawing graphs to convey proxmity: an incremental arrangement method. ACM Transactions of Human-Computer Interaction. 1997;4:197–229.. [Google Scholar]
- 14.Garcia O, Saveanu C, Cline M. GOlorize: a cytoscape plug-in for network visualization with gene ontology- based layout and colouring. Bioinformatics. 2007;2(3):394–396. doi: 10.1093/bioinformatics/btl605. [DOI] [PubMed] [Google Scholar]
- 15.Rodrigues E, Milic-Frayling N, Smith M, Shneiderman B, Hansen D. Group-in-a-Box Layout for Multi-faceted Analysis of Communities. Paper presented at: IEEE Explore. 2011..
- 16.Bederson BB, Shneiderman B, Wattenberg M. Ordered and quantum treemaps: Making effective use of 2D space to display hierarchies. ACM Trans. Graph. 2002;21(4):833–854.. [Google Scholar]
- 17.Li W, Agrawala M, Curless B, Salesin D. Automated generation of interactive 3D exploded view diagrams. ACM Trans. Graph. 2008;27(3):1–7. [Google Scholar]
- 18.Valves DT. Exploded View of Valve 651. http://www.deltatvalves.com/650651-series-stainless-steel-body/. Accessed January 5, 2017 (under fair use)
- 19.Baudisch P, Good N, Bellotti V, Schraedley P. Keeping things in context: a comparative evaluation of focus plus context screens, overviews, and zooming.; Proceedings of the SIGCHI Conference on Human Factors in Computing Systems;; Minneapolis, Minnesota, USA: 2002. [Google Scholar]
- 20.Mak JC, Cameron ID, March LM. Evidence-based guidelines for the management of hip fractures in older persons: an update. The Medical journal of Australia. 2010;192(1):37–41. doi: 10.5694/j.1326-5377.2010.tb03400.x. [DOI] [PubMed] [Google Scholar]
- 21.Mentes JC, Chang BL, Morris J. Keeping nursing home residents hydrated. Western journal of nursing research. 2006;28(4):392–406. doi: 10.1177/0193945906286607. discussion 407-318. [DOI] [PubMed] [Google Scholar]
- 22.Kamada T, Kawai S. An algorithm for drawing general undirected graphs. Information Processing Letters. 1989;31:7–15. [Google Scholar]


