Abstract
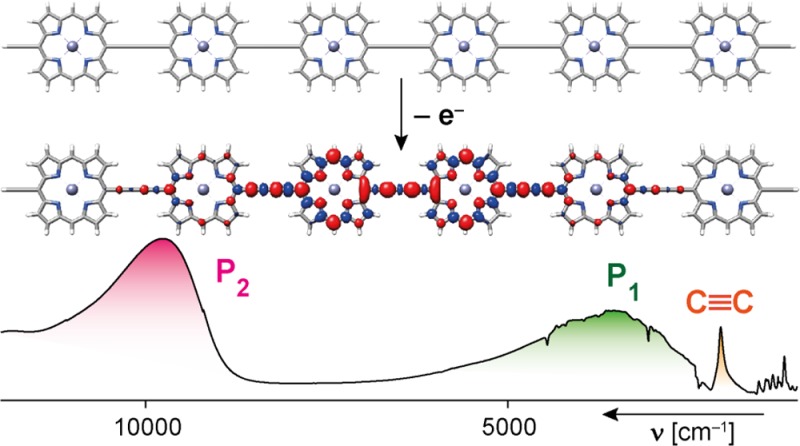
The radical cations of a family of π-conjugated porphyrin arrays have been investigated: linear chains of N = 1–6 porphyrins, a 6-porphyrin nanoring and a 12-porphyrin nanotube. The radical cations were generated in solution by chemical and electrochemical oxidation, and probed by vis–NIR–IR and EPR spectroscopies. The cations exhibit strong NIR bands at ∼1000 nm and 2000–5000 nm, which shift to longer wavelength with increasing oligomer length. Analysis of the NIR and IR spectra indicates that the polaron is delocalized over 2–3 porphyrin units in the linear oligomers. Some of the IR vibrational bands are strongly intensified on oxidation, and Fano-type antiresonances are observed when activated vibrations overlap with electronic transitions. The solution-phase EPR spectra of the radical cations have Gaussian lineshapes with linewidths proportional to N–0.5, demonstrating that at room temperature the spin hops rapidly over the whole chain on the time scale of the hyperfine coupling (ca. 100 ns). Direct measurement of the hyperfine couplings through electron–nuclear double resonance (ENDOR) in frozen solution (80 K) indicates distribution of the spin over 2–3 porphyrin units for all the oligomers, except the 12-porphyrin nanotube, in which the spin is spread over about 4–6 porphyrins. These experimental studies of linear and cyclic cations give a consistent picture, which is supported by DFT calculations and multiparabolic modeling with a reorganization energy of 1400–2000 cm–1 and coupling of 2000 cm–1 for charge transfer between neighboring sites, placing the system in the Robin–Day class III.
Introduction
The radical cation formed by the removal of an electron from a π-conjugated polymer chain is often called a “hole” or a “polaron”.1 The term “polaron” indicates that the molecular framework undergoes a geometrical relaxation, or polarization, in response to the change in oxidation state. Is the polaron distributed over the whole molecular chain, or is it localized on just a few atoms? This question is fundamental to understanding charge transport in organic semiconductors. If the presence of the charge causes major reorganization of molecular structure, and the surrounding medium, then the polaron will be tightly localized and have low mobility, whereas large spatially delocalized polarons are associated with small reorganization energies and high charge mobilities.2 Controlling polaron delocalization is essential in the design of organic semiconductors for devices such as field-effect transistors and solar cells, which require materials with high charge mobilities.3 Delocalization and charge mobility are maximized by strong electronic coupling between sites along the chain, small reorganization energies and minimal disorder, so that the sites have a narrow distribution of oxidation potentials.2
Understanding the molecular structure–property relationships that govern polaron delocalization is also important in the field of single-molecule electronics.4 When a molecule is placed between two electrodes, charge transport can be described by two limiting mechanisms: either the whole electrode/molecule/electrode junction behaves as a single tunneling barrier, or charges hop on and off the molecule, leading to transient polaron states.5 In longer molecular wires, transport may involve a multistep hopping process, in which charges jump between discrete subunits of the chain. The spatial size of the polaron determines the activation energy for hopping and the distance moved per hop.
Porphyrin-based molecular wires, in which the porphyrins are linked by meso–meso ethynylene bridges, have been reported to exhibit the longest polarons found for any π-conjugated material in solution, with delocalization lengths of about 7.5 nm.6 This is twice the length of cationic polarons in common conjugated polymers such as regioregular poly(3-alkylthiophene)s7,8 (∼3.5 nm) and oligo(para-phenylene)s9 (∼3 nm). The long polaron delocalization lengths of π-conjugated porphyrin oligomers may explain the shallow distance dependences of their single-molecule conductances,10,11 which makes it interesting to scrutinize their charge delocalization. Here we analyze the radical cations of a family of butadiyne-linked porphyrin arrays: linear chains of 1–6 porphyrins (l-PN, where N = 1–6),12 a 6-porphyrin nanoring13 (with and without bound template, c-P6·T6 and c-P6), and a 12-porphyrin nanotube14 with two bound template units, t-P12·(T6)2 (Figure 1). We apply several different methods to probe the polaron delocalization lengths of these radical cations, including analysis of vis–NIR, IR and EPR spectroscopic data, and low-temperature ENDOR experiments. All our data for the linear oligomers are consistent with a polaron delocalization length of about 2–3 porphyrin units (3–4 nm). The c-P6 ring has the same polaron length as a linear chain, but the delocalization is slightly greater in the template-bound ring c-P6·T6. The polaron of the 12-porphyrin nanotube t-P12·(T6)2+• is substantially more delocalized and appears to be spread over 4–6 porphyrin units.
Figure 1.
Structures of the linear porphyrin oligomers l-P1 to l-P6, cyclic hexamer with template c-P6·T6 and 12-porphyrin nanotube t-P12. (Note that t-P12 was investigated as its template complex, t-P12·(T6)2, but it is shown here without the template for clarity.)
The simplest model for polaron delocalization is the Marcus–Hush theory for a mixed valence system consisting of two identical sites, one of which is oxidized.15,16 If the coupling between the sites is weak (H ≈ 0; Robin–Day class I; Figure 2a), the charge is localized on one site and the system is represented by two intersecting parabolic free energy surfaces. The vertical distance from each minimum to the other surface is the reorganization energy for charge transfer λ. If there is significant coupling (0 < 2H < λ; Robin–Day class II; Figure 2b) the parabolas mix and an energy gap of 2H opens at the crossing point. As the ratio H/λ increases, the two surfaces merge until there is a single minimum and charge is equally distributed over both sites (2H > λ; Robin–Day class III; Figure 2c). The multiparabolic model (MPM)9,17 extends this theory to a system with many sites by combining multiple parabolas (Figure 2d, five sites). As for two sites, if H/λ > 0.5 the parabolas merge to give a ground-state energy surface with almost no barrier between the sites, however in contrast to the two-site situation, this does not correspond to uniform delocalization of charge over all the sites, and the polaron has a width which increases with increasing H/λ. This model describes polaron delocalization in terms of a single parameter, the ratio H/λ. The extent of polaron delocalization found in this study of linear and cyclic porphyrin oligomers matches predictions from simulations using Marcus–Hush theory and the MPM with a reorganization energy (λ) of about 1700 cm−1 and coupling energy (H) of about 2000 cm−1 for charge transfer between two neighboring sites. Thus, the system is in the Robin–Day class III regime.
Figure 2.
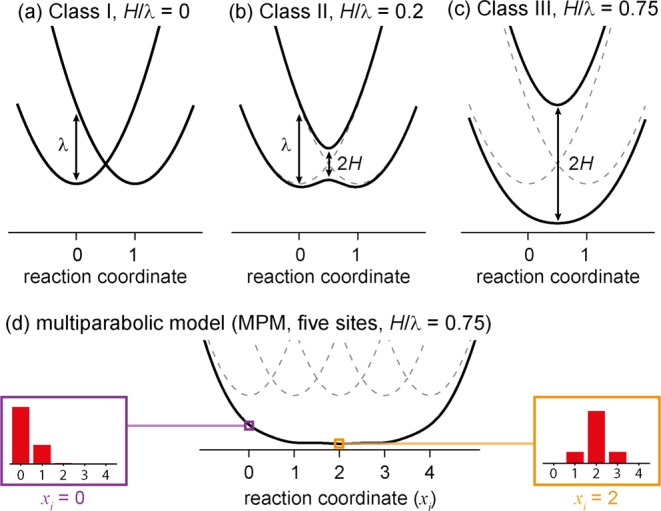
Potential energy surfaces for electron transfer. (a–c) For two sites from Marcus–Hush theory,15,16 Robin–Day classes I–III and (d) the multiparabolic model (MPM) for five sites.9,17 The boxed insets in (d) show the coefficients of the polaron on each oligomer subunit, for a polaron centered on the first parabola (xi = 0) and in the middle of the oligomer (xi = 2).
Materials and Methods
Synthesis
The oligomers l-P1 to l-P6, c-P6, c-P6·T6 and t-P12·(T6)2 (Figure 1) were prepared as reported previously.12−14,18,19 Zinc porphyrin oligomers are often studied in solution in the presence of pyridine to suppress aggregation and improve solubility. However, pyridine reacts with porphyrin radical cations,20 so the studies presented here were carried out in the absence of pyridine; instead, meso-3,5-bis(trihexylsilyl)phenyl substituents were used to improve solubility and inhibit aggregation.18,19
Vis–NIR–IR Spectroelectrochemistry
Measurements were performed in an optically transparent thin-layer electrochemical cell (OTTLE);21 path length: ca. 0.2 mm; solvent: CH2Cl2 containing 0.1 M tetra-n-butylammonium hexafluorophosphate (Bu4NPF6) as supporting electrolyte. Spectroelectrochemical data were collected during slow (5 mV/s) cyclic voltammograms, and confirmed that the oxidation is reversible. Sample concentrations were adjusted to a maximum optical density of 0.4–0.8. Vis–NIR–IR spectra were acquired using a Bruker Vertex 80 spectrometer with a nitrogen purge. Spectroelectrochemical data were collected during oxidation of oligomers from their neutral to N+ oxidation states (for oligomers containing N porphyrin units), and the spectra for individual oxidation states were resolved by multivariate curve resolution using the MCR-ALS toolbox in MATLAB.22,23 For further details, see SI.
Chemical Generation of Radical Cations
Solutions of the radical cations were prepared by adding up to one equivalent of an oxidant to a solution of the porphyrin oligomer. Two oxidants were used: tris(4-bromophenyl)aminium hexachloroantimonate (BAHA) and thianthrenium hexachloroantimonate (THA). Comparison of the reduction potentials of these oxidants (BAHA: E01 = 0.70 V vs Fc/Fc+; THA: E01 = 0.86 V vs Fc/Fc+)24 with the oxidation potentials of the porphyrins (l-P1: E01 ≈ 0.44 V vs Fc/Fc+;25 others at lower potentials;13 see SI, Figure S6) shows that both oxidants are strong enough to achieve stoichiometric oxidation. These oxidants have been used previously to generate porphyrin radical cations.6,26,27 NIR and EPR spectroscopy experiments were carried out using radical cations generated by both oxidants, giving very similar spectra and leading to the same conclusions. The solutions of porphyrin radical cations can be cleanly reduced back to the neutral porphyrin oligomers by addition of excess ferrocene (see SI, Figure S8), demonstrating the absence of irreversible covalent chemistry. EPR spectra were recorded in a solvent mixture of toluene-d8:THF-d8:CD2Cl2 (1:1:1 by volume) because this mixture gives a stable glass at low temperatures. The vis–NIR spectra of chemically generated radical monocation solutions prepared in this solvent mixture do not exhibit significant thermochromism on cooling to 80 K. The radical monocations are stable in dilute solution (<100 μM) in all of these solvent mixtures, even in the presence of trace moisture. We found that rubber septa cannot be used because they react rapidly with the radical cations.
UV–Vis–NIR Spectroscopy
Absorption spectra were recorded on a PerkinElmer 1050 spectrophotometer, using Infrasil cuvettes (2 mm or 1 mm path length).
EPR Spectroscopy
Continuous wave (cw) EPR spectra were collected at room temperature and 100 K at X-band (Bruker EMX). 1H Mims ENDOR experiments were performed at W-band (Bruker Elexsys 680) at temperatures of 6–120 K. No temperature-dependent changes in the shape of the ENDOR spectra were observed in this range. Simulations of the EPR data were performed using EasySpin.28 For further details on EPR methods, see SI.
Density Functional Theory
Gaussian09/D.01 was used for quantum chemical calculations employing DFT and TD-DFT.29 The LC-ωPBE functional was used (ω = 0.2 a0–1),30 after testing other functionals (see computational section and SI), along with the 6-31G* basis set.31 Further details can be found in the SI.
Results and Discussion
Vis–NIR–IR Spectroelectrochemistry
The spectra of each porphyrin oligomer were recorded as a function of electrochemical potential in CH2Cl2 containing 0.1 M Bu4NPF6 as supporting electrolyte. Deconvolution of the raw data afforded the vis–NIR–IR spectra of several distinct cationic states for each oligomer (shown for l-P2, l-P4 and c-P6·T6 in Figure 3, and for all other oligomers in SI, Figure S4). In the cases of l-P5, l-P6 and t-P12·(T6)2, it was not possible to resolve every expected oxidation state, due to linear dependency between the spectra of adjacent states. For the linear oligomers l-P2 to l-P6, square-wave voltammetry reveals a progressive decrease in the first oxidation potential with increasing oligomer length, until the tetramer, with no significant change in oxidation potential from l-P4 to l-P6 (SI Figures S6, S21b).
Figure 3.
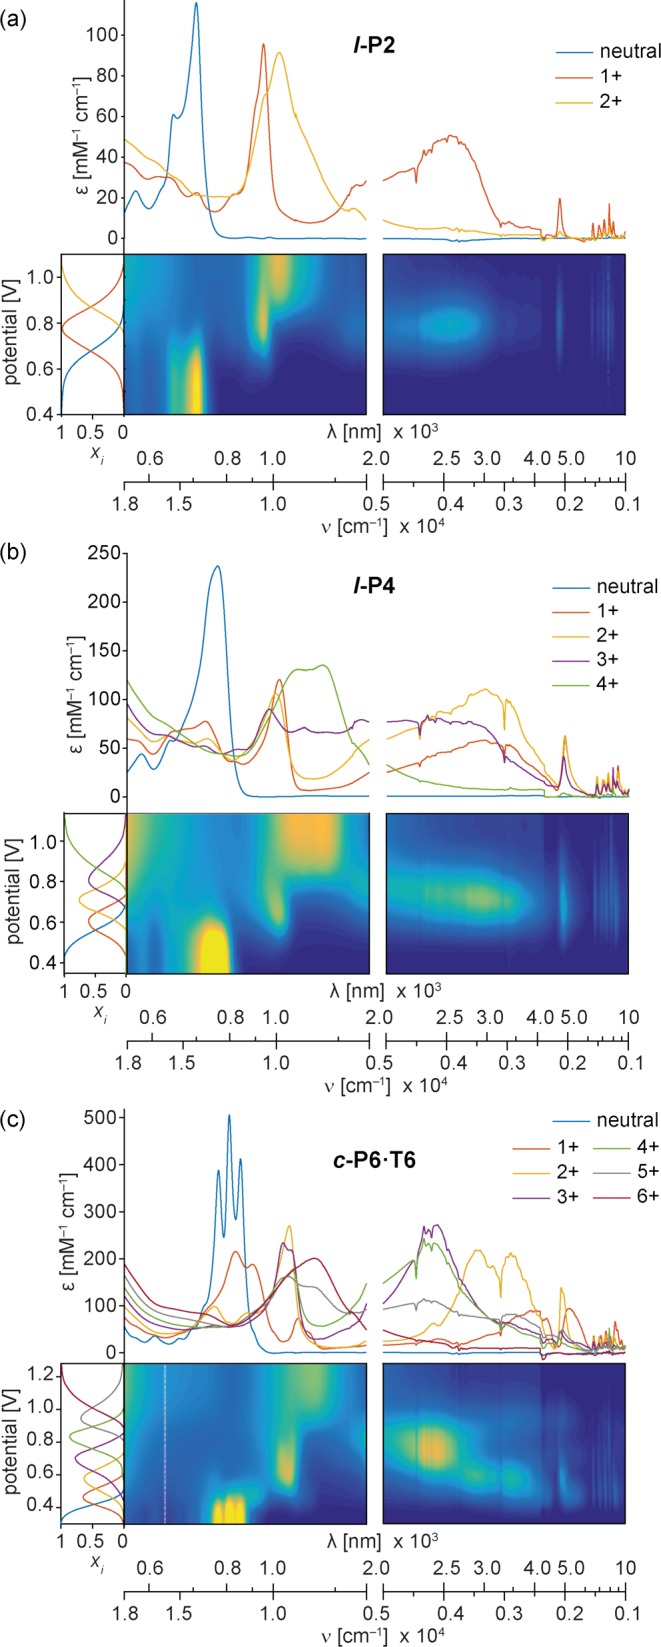
Deconvoluted spectroelectrochemical data for oxidation of (a) l-P2, (b) l-P4 and (c) c-P6·T6 in CH2Cl2/Bu4NPF6. The contour plots show normalized absorbance (color axis) as a function of electrochemical potential. The resolved spectra for individual oxidation states are shown above each contour plot, with the corresponding speciation curves in the left subplots.
All the cations exhibit intense NIR absorptions. The final N+ oxidation states of the l-PN oligomers have similar spectra, with a broad peak at around 1000 nm and no bands at longer wavelengths. In this oxidation state, each porphyrin unit bears a 1+ charge; the charge is uniformly distributed, so no charge-transfer bands are expected. No intensified IR vibrations are observed for the N+ oxidation states. In contrast, the other oxidation states from 1+ to (N – 1)+ show intensified IR vibrations and broad electronic bands at 1000–5000 nm. Here we focus on the radical monocations (1+) because these species are more stable than the higher oxidation states, which makes them easier to study. These singly charged polarons are also most relevant to understanding charge transport.
Analysis of Polaron Vis–NIR–IR Spectra
The NIR absorption spectra of all the radical monocations exhibit two characteristic electronic transitions at around 2000–5000 and 1000 nm (Figure 4 and Table 1). Similar bands have been reported for the polarons of conjugated polymers where they are labeled P1 and P2 respectively (where “P” denotes “polaron”).32−34 Arnold and co-workers observed these bands in the spectra of butadiyne-linked porphyrin dimer cations and anions, calling them ν1 and ν2, respectively.35 We use the notation P1/P2, in common with Therien and co-workers in their studies on porphyrin oligomer anions.6c The P1 and P2 bands are assigned to HOMO → SOMO and SOMO → LUMO transitions, respectively (Figure 5),33,35 and this assignment is supported by our TD-DFT calculations.
Figure 4.
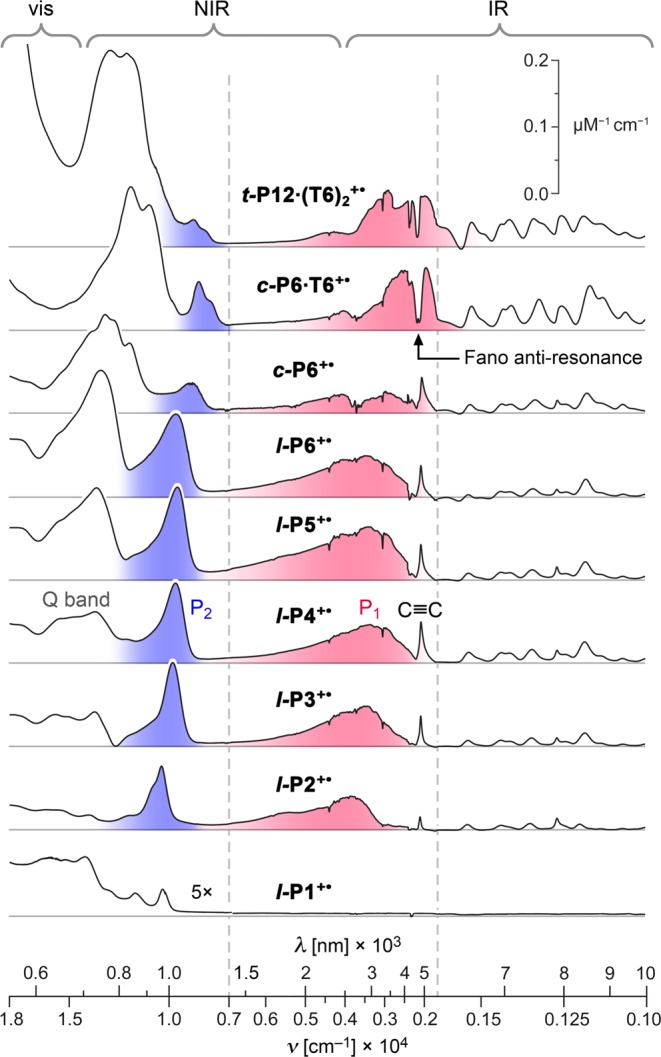
Visible–NIR–IR absorption spectra of 1+ oxidation states (P1 band red and the P2 band blue) from spectroelectrochemistry in CH2Cl2/Bu4NPF6. The vertical dashed lines indicate regions with different energy scales. The intensity of the monomer spectrum (l-P1+•) is multiplied by a factor of 5 to aid visual comparison.
Table 1. Summary of Main NIR and IR Absorption Bands of Radical Cationsa.
| Q-band |
P1 band |
P2 band |
C≡C stretch |
||||||||
|---|---|---|---|---|---|---|---|---|---|---|---|
| compound | εmax [M–1 cm–1] | f | νmax [cm–1] | εmax [M–1 cm–1] | f | νmax [cm–1] | εmax [M–1 cm–1] | f | νmax [cm–1] | εmax [M–1 cm–1] | f |
| l-P2+• | 2.2 × 10⁴ | 0.05 | 3907 | 5.1 × 10⁴ | 0.53 | 10511 | 9.3 × 10⁴ | 0.37 | 2079 | 1.9 × 10⁴ | 0.0041 |
| l-P3+• | 5.2 × 10⁴ | 0.19 | 3599 | 5.9 × 10⁴ | 0.54 | 9961 | 1.3 × 10⁵ | 0.61 | 2061 | 4.6 × 10⁴ | 0.0072 |
| l-P4+• | 7.7 × 10⁴ | 0.39 | 3332 | 5.7 × 10⁴ | 0.61 | 9813 | 1.2 × 10⁵ | 0.50 | 2055 | 6.3 × 10⁴ | 0.0132 |
| l-P5+• | 1.4 × 10⁵ | 0.85 | 3387 | 7.7 × 10⁴ | 1.01 | 9733 | 1.4 × 10⁵ | 0.68 | 2057 | 5.3 × 10⁴ | 0.0114 |
| l-P6+• | 1.9 × 10⁵ | 1.33 | 3506 | 5.9 × 10⁴ | 0.77 | 9749 | 1.2 × 10⁵ | 0.69 | 2057 | 4.6 × 10⁴ | 0.0099 |
| c-P6+• | – | – | 3330 | 3.6 × 10⁴ | 0.32 | 9071 | 4.6 × 10⁴ | 0.26 | 2032 | 5.5 × 10⁴ | 0.0220 |
| c-P6·T6+• | – | – | 2197 | 1.2 × 10⁵ | 0.54 | 8669 | 7.3 × 10⁴ | 0.35 | 2180 | – | – |
| t-P12·(T6)2+• | – | – | 2165 | 7.6 × 10⁴ | 0.62 | 8944 | 4.1 × 10⁴ | 0.17 | 2150 | – | – |
Experimental conditions: spectroelectrochemistry in CH2Cl2/Bu4NPF6 at room temperature. νmax is the energy of the absorption maximum; εmax is the peak molar absorption coefficient and f is the oscillator strength from the area of the absorption band: f = 4.319 × 10⁻⁹ ∫ ε dν. Experimental errors are difficult to quantify due to the complexity of the curve-resolution process, but we estimate that values of νmax are accurate to ±100 cm–1; values of εmax and f have uncertainties of about 20%; “–” means not determined.
Figure 5.
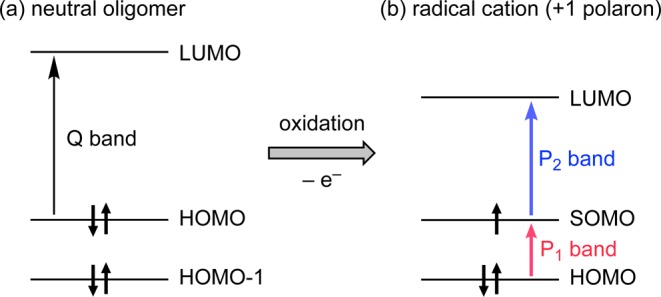
(a) Schematic illustration of the Q-band transition in neutral porphyrin oligomers. (b) Following removal of an electron, two polaron transitions arise: P1 and P2.
Four aspects of the spectra in Figure 4 provide information on the extent of polaron delocalization: (a) the shift in the P1 and P2 bands, and the C≡C stretch, with increasing chain length; (b) the intensities of the P2 bands, compared with absorption from unoxidized regions of the molecules; (c) the frequency and lineshape of the P1 band, and (d) the intensities of the vibrational IR bands. Here we analyze these aspects in turn.
a. Band Shifts with Chain Length
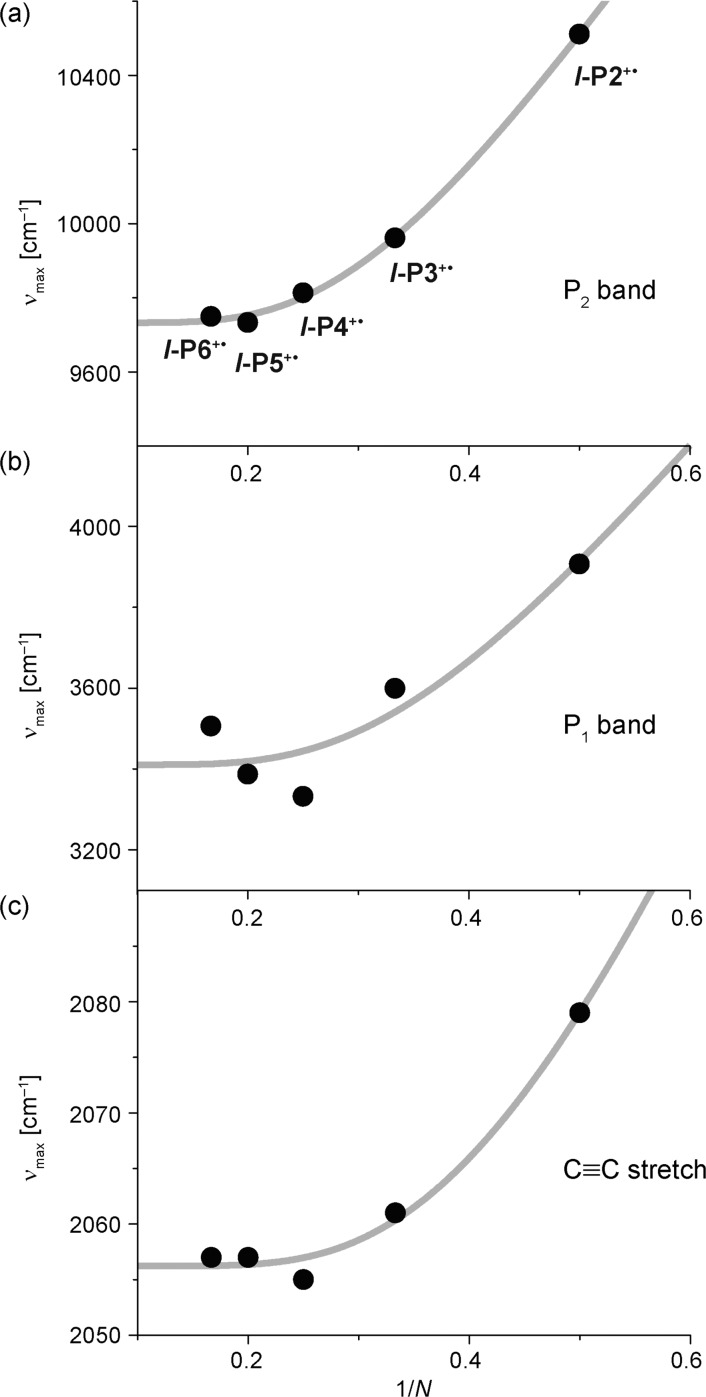
The absorption bands of most π-conjugated oligomers shift to lower energy with increasing chain length, until saturation occurs at the “effective conjugation length” Necl.36−38 Plots of νmax(N) against 1/N for the P1 and P2 bands, and the C≡C stretch vibration, for l-P2+• to l-P6+•, are shown in Figure 6. All three bands show a clear shift to lower energy for l-P2+• to l-P4+•; the C≡C stretch band follows the same trend as the electronic transitions, P1 and P2. The reduction in frequency of this C≡C vibration indicates increasing cumulenicity. The redshift of all three bands saturates at l-P4+•, with no significant shift of absorption maxima for l-P4+• to l-P6+•, indicating Necl ≈ 4 repeat units. The effective conjugation length in these radical cations is much shorter than in the corresponding neutral l-PN oligomers (Necl ≈ 15–20 porphyrin units).39 The cyclic oligomers c-P6, c-P6·T6 and t-P12·(T6)2 are excluded from Figure 6 because their electronic structures are different from those of linear oligomers; however, the P1 and P2 bands for c-P6·T6 and t-P12·(T6)2 occur at lower energies than those for l-P6+• (Figure 4 and Table 1), which could imply greater charge delocalization.
Figure 6.
Plots of νmax vs 1/N for (a) the P2 band, (b) the P1 band, and (c) the C≡C stretch of l-P2+• to l-P6+• (data from Table 1). The gray lines are fits to the Meier equation as guides to the eye.38
b. The Intensity Ratio P2-Band:Q-Band, as a Function of Chain Length
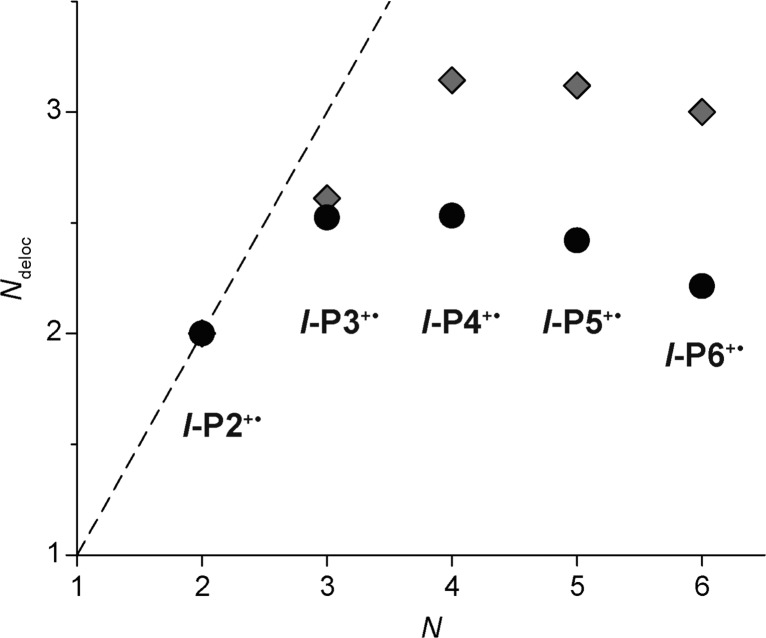
If a polaron is localized over part of a molecule, it is often possible to assign components of the absorption to neutral and oxidized regions of the chain, respectively. The ratio of these components provides information on the extent of delocalization.40 The spectra in Figure 4 show that the absorption at 600–800 nm becomes more intense in the longer oligomers. This is the wavelength range of the Q bands of neutral oligomers, which suggests that it can be attributed to unoxidized regions of the chain. This interpretation is supported by the full spectroelectrochemical results (Figure S4), which show that the spectra of oligomers in an oxidation state corresponding to at least one charge per dimer unit (i.e., (N/2)+ for an oligomer l-PN) exhibit no significant Q-band intensity at 600–800 nm. We applied Miller’s method40 to evaluate the polaron delocalization length (Ndeloc) from the ratio of the intensities of the neutral-like (Q-band) and cation-like (P2 band) absorptions, using both extinction coefficients and oscillator strengths (data in Table 1), according to eq 1,
| 1 |
where IP2 and IQ are the intensities of the P2 band and Q-band, respectively (taken from the molar absorption coefficients or oscillator strengths, Table 1); N is the oligomer length and IQ(l-P2+•) is the Q-band intensity of l-P2+•. The final term in the denominator subtracts background absorption in the Q-band region, and assumes that there is no neutral-like Q-band absorption for l-P2+•. The results from this analysis (Figure 7) reveal a value of Ndeloc ≈ 2.5–3.0 repeat units for l-P2+• to l-P6+•.
Figure 7.
Ndeloc calculated from eq 1 using either molar absorption coefficients (gray squares) or oscillator strengths (black circles) of the P2 and Q bands. The dashed line is a guide for the eye showing the limit of complete delocalization, Ndeloc = N.
c. The Energy and Lineshape of the P1 Band
Marcus–Hush theory allows the reorganization energy λ and the coupling energy H to be estimated from analysis of an intravalence charge-transfer (IV-CT) band.15,16 The energy of the absorption maximum of the IV-CT band is the reorganization energy (νmax = λ) if the system is class I or II (2H < λ), or twice the coupling energy (νmax = 2H) if the system is class III (2H > λ; Figure 2b,c). The P1 band of the dimer l-P2+• (νmax = 3907 cm–1) can be treated as an IV-CT band for a two-site mixed-valence system. The evidence presented in this study shows that l-P2+• is strongly delocalized (class III), which indicates that H = 1954 ± 50 cm–1. In theory, it should be possible to estimate H from the intensity of the P1 band, but this approach involves too many approximations to be useful.41 The P1 band is highly asymmetric, with an abrupt cutoff at its low energy edge and a broad tail extending toward higher energies (Figure 4); this lineshape is a hallmark of the Robin–Day class III or II/III borderline behavior.15,42 Later, we show that data for l-P2+•–l-P6+• are consistent with H/λ = 1.2 ± 0.2, indicating that λ ≈ 1400–2000 cm–1.
d. Amplified Vibrations and Fano Antiresonances
Some vibrational bands become amazingly intense in the radical cations, as seen in the IR region of Figures 3 and 4. For example, the C≡C stretch of l-P2+• is ∼40 times stronger (by molar absorption coefficient) than that of the neutral l-P2 dimer or the l-P22+ dication (Figure 8). This intensification corresponds to a huge increase in the transition dipole moment from about 0.2 D in the neutral molecule to 2.0 D in the radical cation. The intensification of the IR bands is even more dramatic in the longer radical cations and these are among the strongest vibrational resonances reported for molecular species.43
Figure 8.
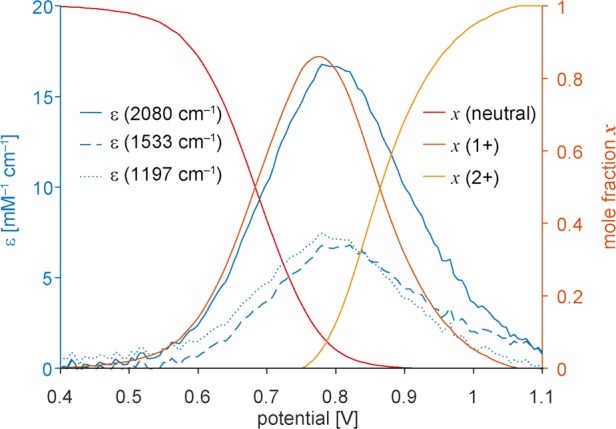
Variation in the intensity of selected IR bands for l-P2 as a function of electrochemical potential (spectro-electrochemistry in CH2Cl2/Bu4NPF6; Figure 3a), compared with the mole fractions of the neutral, 1+ and 2+ oxidation states.
Intensified IR bands have previously been reported for conjugated polymer polarons33,43−47 and mixed-valence compounds,48,49 and they are often described as “infra-red active vibrations” (IRAVs). They can arise from both charge localization, signifying Robin–Day class II/III borderline character,49 and from vibronic coupling to low-energy electronic transitions, even in fully delocalized (class III) systems.48,49 Charge localization reduces the symmetry of a molecule, making Raman modes become IR-active and amplifying IR bands.45,47 In the radical cations studied here, both symmetry breaking and vibronic coupling could account for the observed IRAVs. The N+ cations of the oligomers do not exhibit IRAVs, consistent with a symmetry-breaking origin (SI Figure S4). However, the lower oxidation states all have IV-CT bands in the mid-IR region, which may have stronger vibronic coupling to, and activation of, IR modes. In any case, the similarity of the IR spectra of l-P3+• to l-P6+• implies that the nature of the polaron is similar across this series. For the rigid cyclic systems: c-P6·T6+• and t-P12·(T6)2+•, the IR spectra are much more intense than for the linear systems or for the template-free nanoring c-P6+•.
In c-P6·T6+• and t-P12·(T6)2+•, the C≡C stretch vibration appears as a Fano antiresonance, indented into the P1 band.50 The Raman spectrum of a solution of c-P6·T6+• reveals that the antiresonance at 2180 cm–1 corresponds directly to the symmetric Raman-allowed C≡C stretch at the same frequency (Figure S9). Fano antiresonances of this type are caused by quantum mechanical interference between vibrational and electronic transitions;51 they are observed in doped conjugated polymers33,46,47 and mixed-valence systems52 when the energy of an IRAV falls within the P1 or IV-CT band.
Conclusions from Optical Spectroscopy
The analysis of vis–NIR–IR absorption spectra presented above indicates that the polaron in the linear oligomers l-P2+•–l-P6+• is mainly localized over 2–3 porphyrins. The wave function defining the charge distribution is not expected to have abrupt edges. A completely delocalized polaron on a linear chain of identical subunits should have a probability distribution resembling that of a zero-node particle-in-a-box wave function. The red-shift in the P1, P2 and C≡C bands (Figure 6) and the saturation in Ndeloc (Figure 7) indicate that the polaron is sensitive to the increase in chain length from l-P3+• to l-P4+•, but there is no significant change in the spectra from l-P4+• to l-P6+•, implying that the edges of the polaron wave function extend over four porphyrin units. This picture becomes clearer when compared with the results from DFT calculations and MPM simulations, as discussed below. The P1 and P2 bands of the cyclic oligomers c-P6, c-P6·T6 and t-P12·(T6)2 are more red-shifted than those of the linear oligomers, implying that their polarons are more delocalized, but it is impossible to estimate the size of the polaron from these data because the oligomers are not directly comparable. The EPR and ENDOR results provide further insight into these systems.
EPR Spectroscopy
EPR spectroscopy is useful for probing delocalization in radical cations because the electron–nuclear hyperfine couplings provide a direct measure of the spin density distribution.6,53−55 As the spin density distribution spreads over more atoms, the hyperfine couplings decrease, reflecting the lower spin density at each nucleus. In this study, we estimated the extent of polaron delocalization from changes in the linewidth of continuous wave (cw) EPR spectra and from proton hyperfine couplings measured by ENDOR spectroscopy. A key difference between EPR and optical spectroscopy is that EPR has a longer time scale and reports on the polaron delocalization averaged over a period of about 100 ns, whereas NIR-IR absorption probes the instantaneous electronic structure (interaction time <300 fs). Additional information on the nature of the delocalization can be obtained by recording EPR spectra at low temperatures when thermally activated hopping may become slow on the EPR time scale.
Continuous Wave EPR
If unresolved hyperfine couplings are the main contribution to the EPR linewidth, then changes in these linewidths as a function of the number of monomeric units can be used to measure the delocalization length in a series of oligomer radical cations.6,54,55 Norris et al.53 derived an approximate theoretical relationship between the peak-to-peak linewidth ΔBpp and the number of equivalent units N over which the electron spin is delocalized/hopping, based on the peak-to-peak linewidth of the monomer radical cation (ΔBpp,N=1):
| 2 |
The room temperature X-band cw-EPR spectra of the radical cations l-P1+• to l-P6+•, c-P6+•, c-P6·T6+• and t-P12·(T6)2+• are shown in Figure 9a. The spectrum of l-P1+• shows nine hyperfine lines due to coupling to the four 14N nuclei, which exhibit further partially resolved hyperfine structure due to coupling to protons. The spectrum can be simulated by assuming four equivalent 14N nuclei with an isotropic hyperfine coupling constant of 4.05 MHz and four equivalent protons with a hyperfine coupling of 0.90 MHz (SI Figure S10). Similar hyperfine couplings have been assigned to protons on the phenyl rings in the radical cation of zinc tetraphenylporphyrin,56 and DFT calculations on l-P1+• predict that the largest proton hyperfine couplings are due to the ortho-protons on the aryl rings for the 2B1 radical state (see SI). The spectrum of l-P2+• also shows partially resolved hyperfine structure and can be simulated assuming eight equivalent 14N nuclei with an isotropic hyperfine coupling constant of 2.02 MHz (i.e., half that in l-P1+•). For the larger oligomers, the hyperfine couplings are no longer resolved and lead to inhomogeneous broadening of the EPR line (Figure 9a). The lineshapes of all the EPR spectra are Gaussian (SI Figure S11), indicating that the main contribution to line broadening arises from unresolved hyperfine couplings. A theoretical study by Tang et al. on inhomogeneously broadened EPR lineshapes for different hopping regimes57 has shown that a Gaussian lineshape is expected in systems with fast or slow hole/electron hopping, while intermediate hopping rates lead to significant deviations from a Gaussian. In previous studies on multiporphyrin systems, increasing Lorentzian contributions to the EPR lineshape were observed for larger oligomers (6–12 porphyrin units),6,54,58 and were attributed to slower hopping rates. The Gaussian lineshapes and the N–0.5 scaling of the peak-to-peak linewidths observed here indicate that hopping is fast on the EPR time scale for all the systems investigated in this study.
Figure 9.
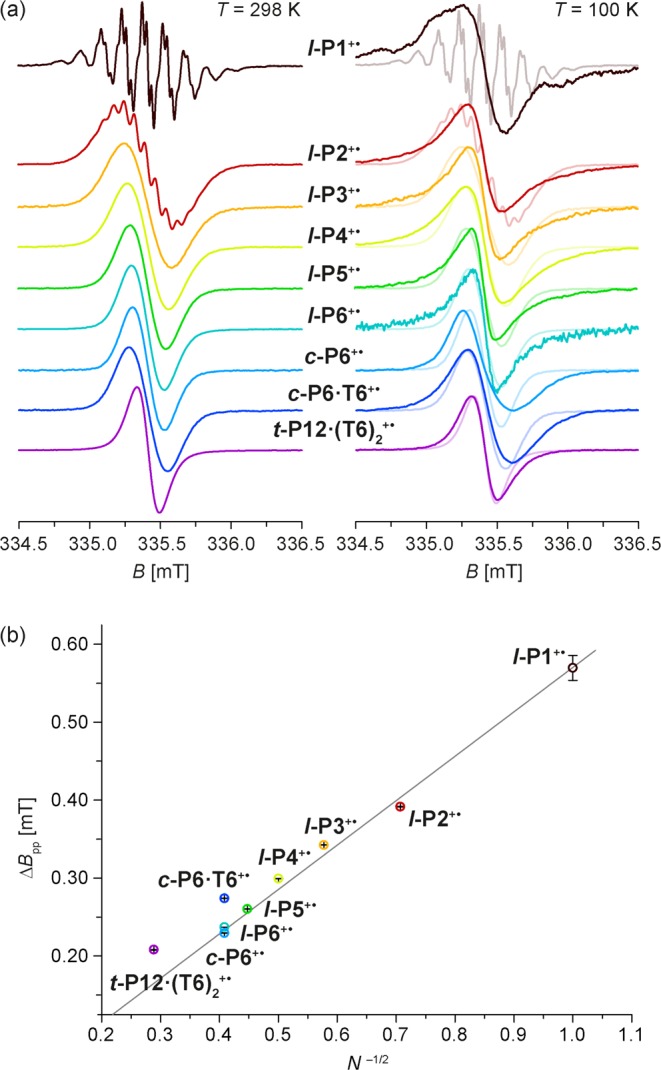
(a) X-band cw-EPR spectra of the radical cations of l-P1 to l-P6, c-P6, c-P6·T6 and t-P12·(T6)2 recorded at 298 and 100 K in toluene-d8/THF-d8/CD2Cl2 with oxidation by thianthrenium hexachloroantimonate. The spectra at 100 K are compared to the corresponding room temperature spectra shown in the background. (b) Peak-to-peak linewidths of the room temperature EPR spectra plotted as a function of the reciprocal square root of the number of porphyrin units. The gray line is the curve for eq 2.
The peak-to-peak linewidths ΔBpp, determined through derivative-Gaussian fitting of the spectra, are compared to eq 2 in Figure 9b. The experimental linewidths approximately follow the theoretical prediction for all the linear oligomers. The linewidths of c-P6·T6+• and t-P12·(T6)2+• are larger than expected from eq 2, probably due to the additional nitrogen hyperfine couplings to the template. If the linewidth of c-P6·T6+• is taken as a reference and delocalization over six units is assumed, then delocalization over 12 units is determined for t-P12·(T6)2+•. This consistency suggests that at room temperature the unpaired electron is either delocalized over the whole π-system or hopping between the porphyrin units on a faster time scale than that associated with the 14N hyperfine interactions (<100 ns).
In the case of fast thermally activated hopping, a decrease in delocalization length is expected at lower temperatures, when kBT becomes smaller than the barrier to hopping. The spin delocalization at low temperatures was initially investigated by performing frozen-solution cw-EPR measurements. At 100 K, all of the low-temperature spectra are characterized by Lorentzian lineshapes due to the contribution of g- and hyperfine anisotropies to the EPR signal (see Figure 9a and SI Figure S11b). No hyperfine structure was resolved even for l-P1+•. The low-temperature spectrum of l-P2+• is much narrower than that of l-P1+•. The peak-to-peak linewidth for the linear oligomers at 100 K appears to be smaller than at room temperature, which might be taken to indicate complete delocalization. However, the theory used for interpretation of the room temperature linewidths does not apply here and therefore we chose to investigate the delocalization in more detail by performing low-temperature pulse EPR experiments.
1H ENDOR
Proton Mims ENDOR spectra were measured at different temperatures from 6 to 100 K at W-band in the same deuterated solvent mixture as for the cw-EPR spectra. The ENDOR spectra do not show any temperature dependence, indicating that spin delocalization does not change over this temperature range. The ENDOR spectra recorded at 80 K, at the maximum of the echo-detected EPR spectra, are shown in Figure 10a, together with the standard deviations of the spectra, σ, as a measure of the peak width (Figure 10b; σ is calculated from the square root of the second moment).
Figure 10.
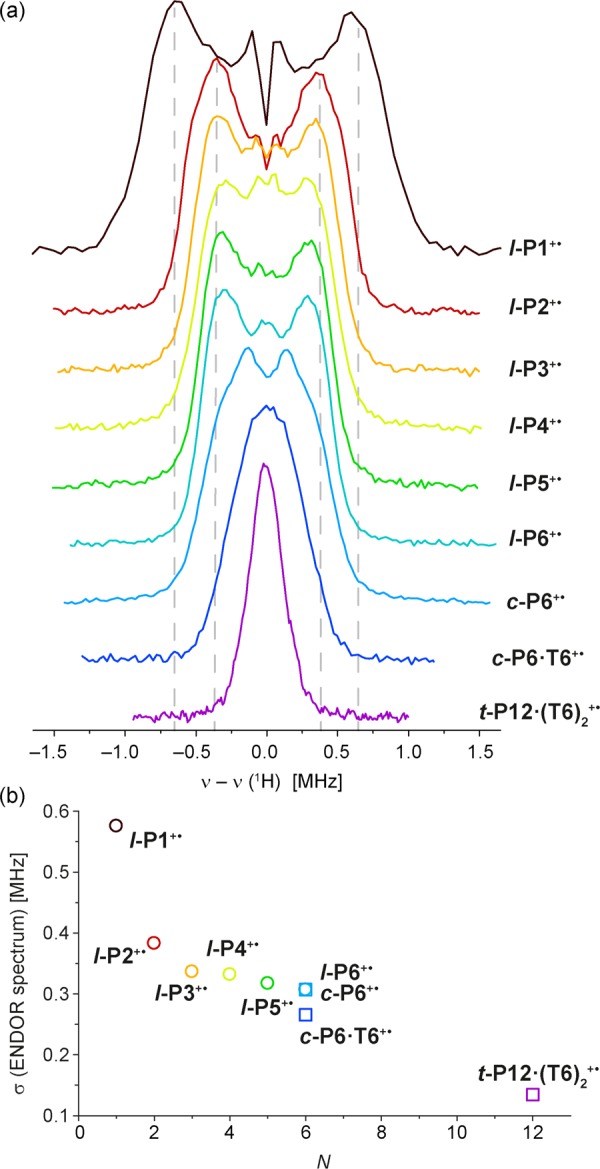
(a) W-band 1H Mims ENDOR spectra of the radical cations of l-P1 to l-P6, c-P6, c-P6·T6 and t-P12·(T6)2 in toluene-d8:THF-d8:CD2Cl2 1:1:1, generated by oxidation with thianthrenium hexachloroantimonate, recorded at 80 K at the field position of the signal maximum. (b) Standard deviations (σ) of the ENDOR spectra, versus the number of porphyrin units (N).
Contributions from different types of protons cannot easily be distinguished in the ENDOR spectra due to the large number of protons with similar weak hyperfine couplings. However, the width of the ENDOR signal is determined by the largest proton coupling, and the hyperfine coupling (assuming the anisotropic component is small) is proportional to the spin density. If the spin density decreases as N–1 with increasing oligomer size, as assumed by Norris et al.,53 the width of the ENDOR spectrum should exhibit the same dependence on N–1, assuming identical spin density on each porphyrin unit. The experimental results show a 2-fold decrease in hyperfine couplings from l-P1+• to l-P2+•, but for the longer linear oligomers (l-P3+• to l-P6+•) there is almost no reduction in the width of the ENDOR peak (Figure 10b) and no significant change in the shape of the ENDOR spectrum for linear oligomers with more than two porphyrin units, implying that most of the spin density is located on 2–3 porphyrin units. The 14N HYSCORE spectra of l-P1+•, l-P2+•, l-P3+• and l-P6+• (SI Figure S13) give a very similar picture: there is a significant difference between the spectra of l-P1+• and l-P2+•, but no significant changes are observed for the linear oligomers l-P2+•–l-P6+•. The ENDOR spectra of the ring systems, c-P6+• and c-P6·T6+•, show a further narrowing and a change in shape compared to l-P6+•, which probably reflects changes in spin density distribution due to the difference in geometry. The narrower ENDOR peak of c-P6·T6+• compared to c-P6+• indicates greater delocalization in the polaron of the template-bound nanoring, as expected from its more rigid geometry and reduced disorder. Further narrowing of the ENDOR spectrum of t-P12·(T6)2+• reflects increased delocalization; comparison of the linewidths for l-P6+• and t-P12·(T6)2+• indicates that the spin density is spread over about 4–6 porphyrin units in the nanotube.
The low temperature EPR data point toward localization of the radical cations with most of the spin density on just two porphyrin units in l-P2+•–l-P6+• and c-P6+•, while the room-temperature cw-EPR data show complete delocalization or fast hopping on the EPR time scale. Localization of the radical cation in frozen solution has previously been reported for other multiporphyrin systems,54,55,58,59 although in those cases the electron spin was localized on a single porphyrin unit. Insights into the origins of this spin localization are provided by the theoretical studies presented in the next section.
Theoretical Modeling of Polaron Delocalization
Quantum Mechanical Calculations
We explored whether density functional theory (DFT) could reproduce the experimental results discussed above. Widely used DFT functionals, such as B3LYP, overestimate charge delocalization owing to the self-interaction error.60 We tested B3LYP61 and a selection of long-range corrected functionals (ωB97X-D62 and LC-ωPBE29 (with the range separation parameter, ω set to 0.1 and 0.2 a0–1, where a0 is the Bohr radius) against the experimental vis–NIR spectra of l-P2+•, l-P4+• and l-P6+• using TD-DFT (CH2Cl2 PCM solvent model, Figure S14). Both ωB97X-D (for which the default ω = 0.2 a0–1) and LC-ωPBE (ω = 0.2 a0–1) reproduce the experimental redshift of the P2 band absorption maximum, whereas B3LYP and LC-ωPBE (ω = 0.1 a0–1) greatly overestimate the red-shift, consistent with overdelocalization. Having selected LC-ωPBE (ω = 0.2 a0–1) as the optimal functional, we were able to reproduce the experimental vis–NIR spectra for l-P2+•, l-P4+• and l-P6+• using TD-DFT (Figure S16).
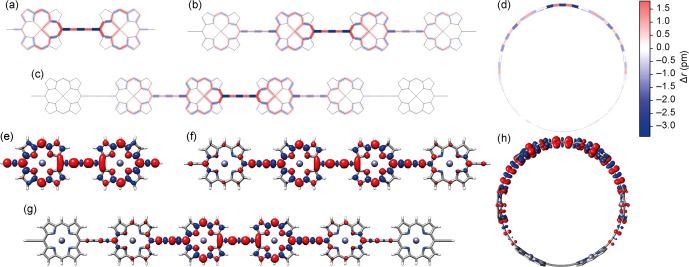
The calculated spin density in DFT-optimized geometries of l-P2+•–l-P6+• and c-P6+• (Figure 11) is mainly localized over two porphyrin units, with tails extending over a further 2 porphyrin units, which is consistent with our conclusions from the optical data and low-temperature ENDOR spectra. The difference in bond lengths between neutral and radical cation geometries (Δr = rcation – rneutral, for each C–C and C–N bond) shows a clear decrease in bond-length alternation in the region of highest spin density, which is a manifestation of localization by increased electron–phonon coupling.1,63
Figure 11.
(a–d) The change in bond lengths between porphyrin oligomer radical cations and their neutral precursors Δr = rcation – rneutral. (e–h) Gas phase spin density isosurfaces at isovalue 0.001 a.u. Calculations performed at the LC-ωPBE/6-31G* level of theory, ω = 0.2 a0–1. The colors in the spin density plots do not relate to those in parts a–d.
Application of the Multistate Parabolic Model (MPM)
Here we use the MPM developed by Rathore and co-workers9,17 to estimate the coupling energy H and reorganization energy λ, which describe the charge delocalization in these oligomers. The MPM extends Marcus–Hush theory to arbitrary oligomer lengths, as introduced above (Figure 2) and discussed in more detail in the SI. The parabolic form of the diabatic site potential assumed in this model is nonphysical but tends to serve as an adequate approximation: for long-range delocalization and the description of higher excited states, the multistate model (MSM) has been introduced, in which the quadratic function is augmented by a reciprocal function.17b The MPM and MSM provide good descriptions for the radical cations of oligo-p-phenylenes and oligo-fluorenes.9,17,64,65
We used the MPM with a single parameter, H/λ, assuming that all the porphyrin units in an oligomer have the same oxidation potential. We systematically varied H/λ to reproduce the trend in experimental absorption energies for the P1 band. The saturation of the absorption maxima at ca. 4 oligomer units is reproduced with H/λ = 1.0–1.4 (SI Figure S18). The MPM can also be used to predict the first oxidation potential of each oligomer, taken as the energy of the ground state minimum. We found close agreement between the simulated and experimental trend in oxidation potentials (SI Figure S21b). The dimer l-P2+• is evidently in Robin–Day class III, which implies that νmax for the P1 band is equal to 2H. Thus, H = 1954 ± 50 cm–1 and λ = 1400–2000 cm–1. The optimized MPM parameters (choosing H/λ = 1.2 for all subsequent discussion) gave charge density distributions that are very similar to those from natural population analysis of the DFT densities, as illustrated by the comparison in Figure 12. In contrast, the fully delocalized picture from a linear combination of atomic orbitals (LCAO) approach shows a continual increase of polaron spatial extent with oligomer length.
Figure 12.
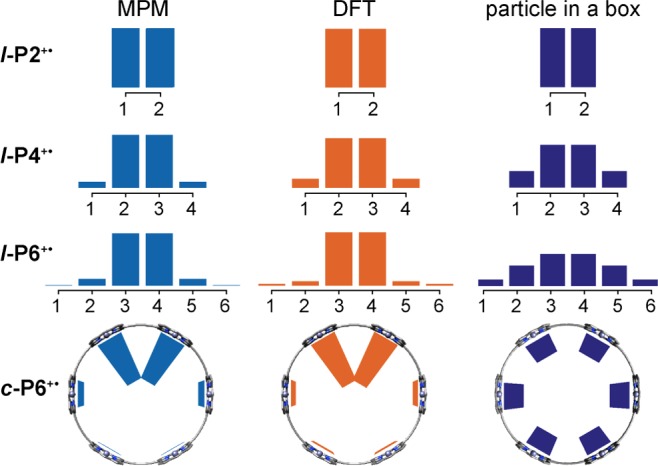
Comparison of charge density distributions from MPM (H/λ = 1.2), DFT (LC-ωPBE/6-31G*; ω = 0.2 a0–1) calculations, and the fully delocalized LCAO model for porphyrin oligomer radical cations.
Conclusions
We have used a variety of experimental and computational approaches to determine the extent of delocalization in the radical cations of a family of porphyrin oligomers. For the linear oligomers, l-P1+•–l-P6+•, the results can be summarized as follows:
-
(i)
In the NIR–IR spectra, the electronic P1 and P2 bands, and the C≡C stretch band, all shift to lower energy with increasing oligomer length, until they reach saturation at an effective conjugation length of Necl ≈ 4 repeat units.
-
(ii)
Comparison of the intensities of the Q-band and the P2 band implies an extent of delocalization of Ndeloc ≈ 2.5–3.0 repeat units; this parameter saturates at a length of 3–4 units.
-
(iii)
The asymmetric lineshape of the P1 band and the observation of intensified IR bands (IRAVs) imply that the systems are in the Robin–Day class II/III borderline or class III regime.
-
(iv)
The EPR spectra at room temperature show linewidths which are proportional to the reciprocal square root of the number of porphyrin units, implying complete delocalization or fast hopping on the EPR time scale at 298 K.
-
(v)
The ENDOR spectra in frozen solution show a 2-fold reduction in the maximum hyperfine coupling from monomer to dimer, but do not change substantially on further elongation of the chain, implying that most of the spin is localized over two porphyrin units.
-
(vi)
DFT calculations using the LC-ωPBE (ω = 0.2 a0–1) functional reproduce the experimental vis–NIR spectra and give spin distributions which are broadly consistent with the ENDOR spectra.
-
(vii)
MPM simulations reproduce the observed saturation in the energy of the P1 band and the trend in the ENDOR spin distributions, using a ratio of coupling energy to reorganization energy of H/λ = 1.2. The MPM suggests that the polaron is delocalized over 2−3 porphyrin units in these linear oligomers.
The polaron length in the c-P6+• ring appears to be almost the same as that in the linear hexamer. Binding the template to give c-P6·T6+• slightly increases the delocalization by reducing the conformational disorder (as manifested by a redshift in the P1 and P2 bands, Figure 4, and a slight reduction in the ENDOR linewidth, Figure 10). There is a much greater increase in delocalization in t-P12·(T6)2+• and in this case the charge is spread over about 4–6 porphyrin units.
It is interesting that the radical cations of l-P3–l-P6, c-P6 and c-P6·T6 are substantially less delocalized than their neutral singlet excited states.39 The neutral triplet excited states of c-P6 and c-P6·T6 are also fully delocalized, in contrast to the radical cations.19 The incomplete delocalization in c-P6·T6+• also contrasts with the complete coherent delocalization in c-P6·T64+ and c-P6·T66+, which results in antiaromaticity and aromaticity, respectively.66 The conclusion that the polaron is delocalized over 2–3 porphyrin units in l-P2+•–l-P6+• suggests that the mechanism of charge transport through these molecular wires will shift from tunneling to hopping in oligomers longer than the trimer.11 As in other conjugated oligomers, the charge localization in these radical cations is probably a consequence of electron–phonon coupling through the structural reorganization caused by the presence of the charge.54,55,67 The electrostatic effects of counterions may also be significant, although we have not been able to detect any change in delocalization as a result of changing the counterion or adding electrolyte. The greater electronic delocalization in the neutral excited states, and in the highly charged nanorings, probably reflects lower reorganization energy.
Acknowledgments
We thank the ERC (grant 320969), the EPSRC, the European Commission (Marie Curie Individual Fellowship to G.M.F. under the contract PIEF-GA-2009-255164 and to P.N. under the contract PIEF-GA-2011-301336). M.D.P. acknowledges additional support from Exeter College, Oxford. P.N. acknowledges a Feodor Lynen research fellowship from the Alexander von Humboldt Foundation and thanks Keble College Oxford for support. Computational facilities from Advanced Research Computing (ARC, http://dx.doi.org/10.5281/zenodo.22558), Oxford, are gratefully acknowledged. We thank Prof. A. W. Parker at the Central Laser Facility, Harwell, U.K., for providing access to Raman spectroscopy.
Supporting Information Available
The Supporting Information is available free of charge on the ACS Publications website at DOI: 10.1021/jacs.7b05386.
Author Contributions
§ M.D.P. and C.E.T. contributed equally.
The authors declare no competing financial interest.
Supplementary Material
References
- a Brédas J. L.; Street G. B. Acc. Chem. Res. 1985, 18, 309–315. 10.1021/ar00118a005. [DOI] [Google Scholar]; b Coropceanu V.; Cornil J.; da Silva Filho D. A.; Olivier Y.; Silbey R.; Brédas J.-L. Chem. Rev. 2007, 107, 926–952. 10.1021/cr050140x. [DOI] [PubMed] [Google Scholar]
- Bässler H.; Köhler A. Top. Curr. Chem. 2011, 312, 1–66. 10.1007/128_2011_218. [DOI] [PubMed] [Google Scholar]
- Sakanoue T.; Sirringhaus H. Nat. Mater. 2010, 9, 736–740. 10.1038/nmat2825. [DOI] [PubMed] [Google Scholar]
- a Perrin M. L.; Burzurí E.; van der Zant H. S. J. Chem. Soc. Rev. 2015, 44, 902–919. 10.1039/C4CS00231H. [DOI] [PubMed] [Google Scholar]; b Lambert C. J. Chem. Soc. Rev. 2015, 44, 875–888. 10.1039/C4CS00203B. [DOI] [PubMed] [Google Scholar]; c Aradhya S. V.; Venkataraman L. Nat. Nanotechnol. 2013, 8, 399–410. 10.1038/nnano.2013.91. [DOI] [PubMed] [Google Scholar]; d Nichols R. J.; Haiss W.; Higgins S. J.; Leary E.; Martinac S.; Bethella D. Phys. Chem. Chem. Phys. 2010, 12, 2801–2815. 10.1039/b922000c. [DOI] [PubMed] [Google Scholar]
- a Hines T.; Diez-Perez I.; Hihath J.; Liu H.; Wang Z.-S.; Zhao J.; Zhou G.; Müllen K.; Tao N. J. Am. Chem. Soc. 2010, 132, 11658–11664. 10.1021/ja1040946. [DOI] [PubMed] [Google Scholar]; b Lu Q.; Liu K.; Zhang H.; Du Z.; Wang X.; Wang F. ACS Nano 2009, 3, 3861–3868. 10.1021/nn9012687. [DOI] [PubMed] [Google Scholar]
- a Susumu K.; Frail P. R.; Angiolillo P. J.; Therien M. J. J. Am. Chem. Soc. 2006, 128, 8380–8381. 10.1021/ja0614823. [DOI] [PubMed] [Google Scholar]; b Rawson J.; Angiolillo P. J.; Frail P. R.; Goodenough I.; Therien M. J. J. Phys. Chem. B 2015, 119, 7681–7689. 10.1021/jp5122728. [DOI] [PubMed] [Google Scholar]; c Therien M. J.; Angiolillo P. J.; Rawson J. Proc. Natl. Acad. Sci. U. S. A. 2015, 112, 13779–13783. 10.1073/pnas.1512318112. [DOI] [PMC free article] [PubMed] [Google Scholar]
- Takeda N.; Miller J. R. J. Phys. Chem. B 2012, 116, 14715–14723. 10.1021/jp3096242. [DOI] [PubMed] [Google Scholar]
- Ghosh R.; Pochas C. M.; Spano F. C. J. Phys. Chem. C 2016, 120, 11394–11406. 10.1021/acs.jpcc.6b02917. [DOI] [Google Scholar]
- Talipov M. R.; Boddeda A.; Timerghazin Q. K.; Rathore R. J. Phys. Chem. C 2014, 118, 21400–21408. 10.1021/jp5082752. [DOI] [PMC free article] [PubMed] [Google Scholar]
- Li Z.; Park T. H.; Rawson J.; Therien M. J.; Borguet E. Nano Lett. 2012, 12, 2722–2727. 10.1021/nl2043216. [DOI] [PubMed] [Google Scholar]
- a Sedghi G.; Sawada K.; Esdaile L. J.; Hoffmann M.; Anderson H. L.; Bethell D.; Haiss W.; Higgins S. J.; Nichols R. J. J. Am. Chem. Soc. 2008, 130, 8582–8583. 10.1021/ja802281c. [DOI] [PubMed] [Google Scholar]; b Sedghi G.; Garcia-Suarez V. M.; Esdaile L. J.; Anderson H. L.; Lambert C. J.; Martin S.; Bethell D.; Higgins S. J.; Elliott M.; Bennett N.; Macdonald J. E.; Nichols R. J. Nat. Nanotechnol. 2011, 6, 517–523. 10.1038/nnano.2011.111. [DOI] [PubMed] [Google Scholar]; c Sedghi G.; Esdaile L. J.; Anderson H. L.; Martin S.; Bethell D.; Higgins S. J.; Nichols R. J. Adv. Mater. 2012, 24, 653–657. 10.1002/adma.201103109. [DOI] [PubMed] [Google Scholar]
- Taylor P. N.; Huuskonen J.; Rumbles G.; Aplin R. T.; Williams E.; Anderson H. L. Chem. Commun. 1998, 909–910. 10.1039/a801031e. [DOI] [Google Scholar]
- Sprafke J. K.; Kondratuk D. V.; Wykes M.; Thompson A. L.; Hoffmann M.; Drevinskas R.; Chen W.-H.; Yong C. K.; Kärnbratt J.; Bullock J. E.; Malfois M.; Wasielewski M. R.; Albinsson B.; Herz L. M.; Zigmantas D.; Beljonne D.; Anderson H. L. J. Am. Chem. Soc. 2011, 133, 17262–17273. 10.1021/ja2045919. [DOI] [PubMed] [Google Scholar]
- Neuhaus P.; Cnossen A.; Gong J. Q.; Herz L. M.; Anderson H. L. Angew. Chem., Int. Ed. 2015, 54, 7344–7348. 10.1002/anie.201502735. [DOI] [PMC free article] [PubMed] [Google Scholar]
- Heckmann A.; Lambert C. Angew. Chem., Int. Ed. 2012, 51, 326–392. 10.1002/anie.201100944. [DOI] [PubMed] [Google Scholar]
- Brunschwig B. S.; Creutz C.; Sutin N. Chem. Soc. Rev. 2002, 31, 168–184. 10.1039/b008034i. [DOI] [PubMed] [Google Scholar]
- a Talipov M. R.; Jasti R.; Rathore R. J. Am. Chem. Soc. 2015, 137, 14999–15006. 10.1021/jacs.5b09596. [DOI] [PubMed] [Google Scholar]; b Talipov M. R.; Ivanov M. V.; Rathore R. J. Phys. Chem. C 2016, 120, 6402–6408. 10.1021/acs.jpcc.6b00514. [DOI] [Google Scholar]
- Grozema F. C.; Houarner-Rassin C.; Prins P.; Siebbeles L. D. A.; Anderson H. L. J. Am. Chem. Soc. 2007, 129, 13370–13371. 10.1021/ja0751274. [DOI] [PubMed] [Google Scholar]
- Tait C. E.; Neuhaus P.; Peeks M. D.; Anderson H. L.; Timmel C. R. J. Am. Chem. Soc. 2015, 137, 8284–8293. 10.1021/jacs.5b04511. [DOI] [PMC free article] [PubMed] [Google Scholar]
- a Shine H. J.; Padilla A. G.; Wu S.-M. J. Org. Chem. 1979, 44, 4069–4075. 10.1021/jo01337a010. [DOI] [Google Scholar]; b Fuhrhop J.-H.; Krüger W.; Meding U. Liebigs Ann. Chem. 1981, 1981, 1367–1377. 10.1002/jlac.198119810805. [DOI] [Google Scholar]
- Krejčik M.; Daněk M.; Hartl F. J. Electroanal. Chem. Interfacial Electrochem. 1991, 317, 179–187. 10.1016/0022-0728(91)85012-E. [DOI] [Google Scholar]
- Jaumot J.; de Juan A.; Tauler R. Chemom. Intell. Lab. Syst. 2015, 140, 1–12. 10.1016/j.chemolab.2014.10.003. [DOI] [Google Scholar]
- MATLAB, version 9.0.0.341360 (R2016a); The MathWorks Inc.: Natick, MA, 2016.
- Connelly N. G.; Geiger W. E. Chem. Rev. 1996, 96, 877–910. 10.1021/cr940053x. [DOI] [PubMed] [Google Scholar]
- Winters M. U.; Dahlstedt E.; Blades H. E.; Wilson C. J.; Frampton M. J.; Anderson H. L.; Albinsson B. J. Am. Chem. Soc. 2007, 129, 4291–4297. 10.1021/ja067447d. [DOI] [PubMed] [Google Scholar]
- Shultz D. A.; Lee H.; Kumar R. K.; Gwaltney K. P. J. Org. Chem. 1999, 64, 9124–9136. 10.1021/jo991046h. [DOI] [Google Scholar]
- a Brancato-Buentello K. E.; Kang S.-J.; Scheidt W. R. J. Am. Chem. Soc. 1997, 119, 2839–2846. 10.1021/ja9616950. [DOI] [Google Scholar]; b Li M.; Neal T. J.; Wyllie G. R. A.; Oliver A. G.; Schulz C. E.; Scheidt W. R. Inorg. Chem. 2011, 50, 9114–9121. 10.1021/ic201292t. [DOI] [PMC free article] [PubMed] [Google Scholar]
- Stoll S.; Schweiger A. J. Magn. Reson. 2006, 178, 42–55. 10.1016/j.jmr.2005.08.013. [DOI] [PubMed] [Google Scholar]
- Frisch M. J.; Trucks G. W.; Schlegel H. B.; Scuseria G. E.; Robb M. A.; Cheeseman J. R.; Scalmani G.; Barone V.; Mennucci B.; Petersson G. A.; Nakatsuji H.; Caricato M.; Li X.; Hratchian H. P.; Izmaylov A. F.; Bloino J.; Zheng G.; Sonnenberg J. L.; Hada M.; Ehara M.; Toyota K.; Fukuda R.; Hasegawa J.; Ishida M.; Nakajima T.; Honda Y.; Kitao O.; Nakai H.; Vreven T.; Montgomery J. A. Jr.; Peralta J. E.; Ogliaro F.; Bearpark M.; Heyd J. J.; Brothers E.; Kudin K. N.; Staroverov V. N.; Kobayashi R.; Normand J.; Raghavachari K.; Rendell A.; Burant J. C.; Iyengar S. S.; Tomasi J.; Cossi M.; Rega N.; Millam J. M.; Klene M.; Knox J. E.; Cross J. B.; Bakken V.; Adamo C.; Jaramillo J.; Gomperts R.; Stratmann R. E.; Yazyev O.; Austin A. J.; Cammi R.; Pomelli C.; Ochterski J. W.; Martin R. L.; Morokuma K.; Zakrzewski V. G.; Voth G. A.; Salvador P.; Dannenberg J. J.; Dapprich S.; Daniels A. D.; Farkas Ö.; Foresman J. B.; Ortiz J. V; Cioslowski J.; Fox D. J.. Gaussian 09; Gaussian Inc.: Wallingford, CT, 2009.
- Vydrov O. A.; Scuseria G. E. J. Chem. Phys. 2006, 125, 234109. 10.1063/1.2409292. [DOI] [PubMed] [Google Scholar]
- a Ditchfield R.; Hehre W. J.; Pople J. A. J. Chem. Phys. 1971, 54, 724–728. 10.1063/1.1674902. [DOI] [Google Scholar]; b Hehre W. J.; Ditchfield R.; Pople J. A. J. Chem. Phys. 1972, 56, 2257–2261. 10.1063/1.1677527. [DOI] [Google Scholar]; c Hariharan P. C.; Pople J. A. Theor. Chim. Acta 1973, 28, 213–222. 10.1007/BF00533485. [DOI] [Google Scholar]; d Rassolov V. A.; Pople J. A.; Ratner M. A.; Windus T. L. J. Chem. Phys. 1998, 109, 1223–1229. 10.1063/1.476673. [DOI] [Google Scholar]
- Lane P. A.; Wei X.; Vardeny Z. V. Phys. Rev. Lett. 1996, 77, 1544–1547. 10.1103/PhysRevLett.77.1544. [DOI] [PubMed] [Google Scholar]
- Österbacka R.; An C. P.; Jiang X. M.; Vardeny Z. V. Science 2000, 287, 839–842. 10.1126/science.287.5454.839. [DOI] [PubMed] [Google Scholar]
- Heimel G. ACS Cent. Sci. 2016, 2, 309–315. 10.1021/acscentsci.6b00073. [DOI] [PMC free article] [PubMed] [Google Scholar]
- a Arnold D. P.; Hartnell R. D.; Heath G. A.; Newby L.; Webster R. D. Chem. Commun. 2002, 754–755. 10.1039/b200803n. [DOI] [PubMed] [Google Scholar]; b Wilson G. J.; Arnold D. P. J. Phys. Chem. A 2005, 109, 6104–6113. 10.1021/jp0507041. [DOI] [PubMed] [Google Scholar]
- Torras J.; Casanovas J.; Alemán C. J. Phys. Chem. A 2012, 116, 7571–7583. 10.1021/jp303584b. [DOI] [PubMed] [Google Scholar]
- Gierschner J.; Cornil J.; Egelhaaf H. J. Adv. Mater. 2007, 19, 173–191. 10.1002/adma.200600277. [DOI] [Google Scholar]
- The data in Figure 6 and SI Figure S18 are fitted to the Meier equation: νmax(N) = νmax(∞) + [νmax(1) – νmax(∞)]exp[−α(N – 1)], where νmax(N) is the frequency of the band for an oligomer of length N (from experimental spectra); νmax(1), νmax(∞) and α are fitting parameters. This is a purely empirical relationship.Meier H.; Stalmach U.; Kolshorn H. Acta Polym. 1997, 48, 379–384. 10.1002/actp.1997.010480905. [DOI] [Google Scholar]
- Parkinson P.; Kondratuk D. V.; Menelaou C.; Gong J. Q.; Anderson H. L.; Herz L. M. J. Phys. Chem. Lett. 2014, 5, 4356–4361. 10.1021/jz5022153. [DOI] [PubMed] [Google Scholar]
- Takeda N.; Asaoka S.; Miller J. R. J. Am. Chem. Soc. 2006, 128, 16073–16082. 10.1021/ja062596h. [DOI] [PubMed] [Google Scholar]
- The coupling H can be estimated from the intensity of the IV-CT band using the Mulliken–Hush equation:16H = 0.0206 (νmaxν1/2εmax)0.5/r, where r is the electron-transfer distance (13.5 Å in l-P2+•, estimated from the Zn–Zn distance in the crystal structure of the neutral dimer12), ν1/2 is the full width at half maximum intensity (∼3000 cm–1) and εmax is the molar absorption coefficient (5.1 × 10⁴ M–1 cm–1). The result from this method (H ≈ 1200 cm–1) is approximate because ν1/2 is poorly defined for an asymmetric peak and the effective distance of charge transfer may not be the center-to-center distance. For discussion of this approach, see:Hush N. S. Coord. Chem. Rev. 1985, 64, 135–157. 10.1016/0010-8545(85)80047-3. [DOI] [Google Scholar]
- Nelsen S. F. Chem. - Eur. J. 2000, 6, 581–588. . [DOI] [PubMed] [Google Scholar]
- Zamadar M.; Asaoka S.; Grills D. C.; Miller J. R. Nat. Commun. 2013, 4, 2818. 10.1038/ncomms3818. [DOI] [Google Scholar]
- Kvarnström C.; Neugebauer H.; Ivaska A.; Sariciftci N. S. J. Mol. Struct. 2000, 521, 271–277. 10.1016/S0022-2860(99)00442-1. [DOI] [Google Scholar]
- Cravino A.; Neugebauer H.; Luzzati S.; Catellani M.; Petr A.; Dunsch L.; Sariciftci N. S. J. Phys. Chem. B 2002, 106, 3583–3591. 10.1021/jp013351o. [DOI] [Google Scholar]
- Österbacka R.; Jiang X. M.; An C. P.; Horovitz B.; Vardeny Z. V. Phys. Rev. Lett. 2002, 88, 226401. 10.1103/PhysRevLett.88.226401. [DOI] [PubMed] [Google Scholar]
- Yin J.; Wang Z.; Fazzi D.; Shen Z.; Soci C. J. Phys. Chem. C 2016, 120, 1994–2001. 10.1021/acs.jpcc.5b11764. [DOI] [Google Scholar]
- Londergan C. H.; Salsman J. C.; Ronco S.; Kubiak C. P. Inorg. Chem. 2003, 42, 926–928. 10.1021/ic0261629. [DOI] [PubMed] [Google Scholar]
- Rocha R. C.; Shreve A. P. Chem. Phys. 2006, 326, 24–32. 10.1016/j.chemphys.2006.01.008. [DOI] [Google Scholar]
- At first sight, the Fano antiresonances observed in the IR spectra of c-P6·T6+• and t-P12·(T6)2+• might appear to be subtraction artifacts. This explanation can be eliminated by comparing the background spectra, as shown in SI Figure S5.
- a Minto C.; Flytzanis C. Chem. Phys. Lett. 1979, 68, 501–506. 10.1016/0009-2614(79)87247-4. [DOI] [Google Scholar]; b Sturge M. D.; Guggenheim H. J.; Pryce M. H. L. Phys. Rev. B 1970, 2, 2459–2471. 10.1103/PhysRevB.2.2459. [DOI] [Google Scholar]
- Gasyna Z.; Schatz P. N. J. Phys. Chem. 1996, 100, 1445–1448. 10.1021/jp9533281. [DOI] [Google Scholar]
- Norris J. R.; Uphaus R. A.; Crespi H. L.; Katz J. J. Proc. Natl. Acad. Sci. U. S. A. 1971, 68, 625–628. 10.1073/pnas.68.3.625. [DOI] [PMC free article] [PubMed] [Google Scholar]
- Wilson T. M.; Hori T.; Yoon M.-C.; Aratani N.; Osuka A.; Kim D.; Wasielewski M. R. J. Am. Chem. Soc. 2010, 132, 1383–1388. 10.1021/ja908605s. [DOI] [PubMed] [Google Scholar]
- Seth J.; Palaniappan V.; Johnson T. E.; Prathapan S.; Lindsey J. S.; Bocian D. F. J. Am. Chem. Soc. 1994, 116, 10578–10592. 10.1021/ja00102a027. [DOI] [Google Scholar]
- a Fajer J.; Borg D. C.; Forman A.; Dolphin D.; Felton R. H. J. Am. Chem. Soc. 1970, 92, 3451–3459. 10.1021/ja00714a038. [DOI] [PubMed] [Google Scholar]; b Fajer J.; Davis M. S. In The Porphyrins; Dolphin D., Ed.; Elsevier, 1979; pp 197–256. [Google Scholar]
- Tang J.; Dikshit S. N.; Norris J. R. J. Chem. Phys. 1995, 103, 2873–2881. 10.1063/1.470500. [DOI] [Google Scholar]
- Li J.; Ambroise A.; Yang S. I.; Diers J. R.; Seth J.; Wack C. R.; Bocian D. F.; Holten D.; Lindsey J. S. J. Am. Chem. Soc. 1999, 121, 8927–8940. 10.1021/ja991730d. [DOI] [Google Scholar]
- Kelley R. F.; Tauber M. J.; Wasielewski M. R. Angew. Chem., Int. Ed. 2006, 45, 7979–7982. 10.1002/anie.200603046. [DOI] [PubMed] [Google Scholar]
- Cohen A. J.; Mori-Sanchez P.; Yang W. Science 2008, 321, 792–794. 10.1126/science.1158722. [DOI] [PubMed] [Google Scholar]
- Becke A. D. J. Chem. Phys. 1993, 98, 5648. 10.1063/1.464913. [DOI] [Google Scholar]
- Chai J.-D.; Head-Gordon M. Phys. Chem. Chem. Phys. 2008, 10, 6615–6620. 10.1039/b810189b. [DOI] [PubMed] [Google Scholar]
- Frequency calculations on the radical cations reveal strongly intensified IR modes, but are unable to completely reproduce the experimental IR spectra (SI Figure S17). Zamadar et al. observed similar differences between experiment and simulation when they studied oligofluorene radical cation and anion IR spectra.43 They noted that the IR peaks reproduced by DFT were those intensified as a result of the increased dipole derivatives due to charge doping; other bands, not reproduced by DFT IR calculations, were probably those which arose due to intensity borrowing from low-energy electronic transitions.
- Wang D.; Talipov M. R.; Ivanov M. V.; Rathore R. J. Am. Chem. Soc. 2016, 138, 16337–16344. 10.1021/jacs.6b09209. [DOI] [PubMed] [Google Scholar]
- Ivanov M. V.; Talipov M. R.; Boddeda A.; Abdelwahed S. H.; Rathore R. J. Phys. Chem. C 2017, 121, 1552–1561. 10.1021/acs.jpcc.6b12111. [DOI] [Google Scholar]
- Peeks M. D.; Claridge T. D. W.; Anderson H. L. Nature 2017, 541, 200–203. 10.1038/nature20798. [DOI] [PubMed] [Google Scholar]
- a Wilson T. M.; Tauber M. J.; Wasielewski M. R. J. Am. Chem. Soc. 2009, 131, 8952–8957. 10.1021/ja902258g. [DOI] [PubMed] [Google Scholar]; b Howarth O. W.; Fraenkel G. K. J. Chem. Phys. 1970, 52, 6258–6267. 10.1063/1.1672936. [DOI] [Google Scholar]
Associated Data
This section collects any data citations, data availability statements, or supplementary materials included in this article.


