

Summary
The role of the unique T‐cell population, natural killer T (NKT) cells, which have similar functions to NK cells in pancreatic cancer (PC), is not yet evaluated. To address the regulatory roles of NKT cells on tumour progression through tumour‐associated macrophages (TAM) and their production of microsomal prostaglandin E synthase‐1 (mPGES‐1) and 5‐lipoxygenase (5‐LOX) in (Kras)‐driven pancreatic tumour (KPT) progression, we crossed CD1d−/− mice deficient in both invariant and variant NKT cells with the KrasG12D mice. Loss of NKT cells significantly increased pancreatic intraepithelial neoplasia (PanIN) lesions and also increased 5‐LOX and mPGES‐1 expression in M2‐type macrophages and cancer stem‐like cells in pancreatic tumours. Pharmacological inhibition of mPGES‐1 and 5‐LOX in M2 macrophages with specific inhibitor YS‐121 in KPT‐CD1d−/− mice decreased PanIN lesions and suppressed tumour growth in association with elevated levels of active CD8a cells. Hence, NKT cells regulate PC by modulating TAMs (M2) through mPGES‐1 and 5‐LOX; and the absence of NKT cells leads to aggressive development of PC.
Keywords: microsomal prostaglandin E synthase‐1, natural killer T cells, pancreatic cancer, prevention, treatment
Introduction
Pancreatic cancer (PC) is highly lethal. It is difficult to diagnose early, and diagnosis is often made late in the disease course. In 2017, about 53 670 new cases and about 43 090 deaths are estimated to occur in the USA.1 Even for surgically resectable, and therefore potentially curable, tumours, the risk of cancer recurrence and subsequent death remains high. It is well established that K‐ras mutations are commonly (~90–95%) found in human PC. In spite of good progress in our understanding of the molecular aetiology of PC, we still lack significant information regarding the aggressive nature of PC progression and the reason for the poor survival of patients with PC. Recent evidence indicates that inflammation and immune cells in the tumour microenvironment play major roles in PC development and progression.2 Inverse associations between the numbers and functional activities of immune cells in patients with aggressive cancers suggest that these cells play important roles in anti‐tumour immune responses, and that tumour escape from these cells may result in disease progression. It is a well‐accepted phenomenon that cancer arises from regions of chronic inflammation. In addition, to the oncogenic changes that contribute to cancer development, inflammatory cells, secretory molecules, and cytokines within established tumours can contribute to cancer cell survival and tumour development, growth and progression.
The roles of innate immune natural killer (NK) and natural killer T (NKT) cells in eliminating cancer cells are not fully understood. Recent studies have determined that NK cells and a unique subpopulation of T cells called NKT cells provide an immune surveillance function and play an important role in innate immunity. NKT cells are hypothesized to be deregulated in pancreatic tumour progression and contribute to aggressive tumour growth. Whether genetic loss of NKT cells will enhance or decrease pancreatic tumour progression in a human mimic model is not yet evaluated. How NKT cells regulate the inflammatory environment during pancreatic tumorigenesis is still unclear. NKT cells are reported to decrease monocyte number in neuroblastoma using NOD/SCID mice.3 However, particularly with regard to how tumour‐associated macrophages (TAMs) evade the inhibitory activities of NKT cells in PC are not studied.
We hypothesize based on available literature that NKT cells regulate pro‐inflammatory responses by inhibiting TAMs, which may impede tumour growth. The literature suggests that TAM‐mediated inflammation occurs through microsomal prostaglandin E synthase‐1 (mPGES‐1) and plays an essential role in tumour progression.4, 5 We and others have reported increased expression of mPGES‐1 in colon and pancreatic cancers.4, 5, 6, 7, 8 During inflammation, prostaglandin E2 (PGE2) and leukotrienes are produced from the metabolism of arachidonic acid by subsequent actions of the inducible enzymes cyclo‐oxygenase‐2, mPGES‐1 and 5‐lipoxygenase (5‐LOX). PGE2 exerts anti‐inflammatory effects and leukotrienes drive inflammation. These two are the potent inflammatory eicosanoids associated with signalling and immunosuppression reactions in cancers. Enhanced PGE2 and leukotriene synthesis, linked to immunosuppression, has been documented in many human cancers.9, 10, 11 Several secreted factors, such as PGE2 and leukotrienes, are known to induce immunosuppression in the tumour microenvironment. As such, no reports are available on whether NKT cells regulate mPGEs‐1. However, much is unexplored regarding the involvement of mPGES‐1‐mediated inflammatory signalling and the immune response remains to be clarified.
We evaluated the roles of NKT cells in pancreatic carcinogenesis by crossing the KPT model (p48Cre/+‐LSL‐KrasG12D/+) with CD1‐deficient (CD1d−/−) mice that do not produce type I NKT (invariant or iNKT) or type II NKT (variant or vNKT) cells. The development of immunopreventive or immunotherapeutic strategies is highly dependent on comprehending the NKT–TAM interaction in the tumour microenvironment. NKT cells are immune effector cells, which are responsible for specifically identifying and negatively regulating TAMs. NKT cells are the immune effector cells that may specifically recognize and negatively regulate TAMs.
In the present study, we tested the hypothesis that pancreatic tumour progression is affected by NKT cell regulation of tumour‐infiltrating macrophage cells and in turn production of mPGES‐1 and 5‐LOX. Specifically, our results indicate that tumour progression in the pancreas is highly dependent on the NKT cells and NKT cell‐regulated 5‐LOX expression and mPGES‐1 in M2‐type TAMs.
Materials and methods
Mice, diet, handling and drugs
De‐identified human tissue samples were kindly provided by the Stephenson Cancer Center Core Facility. Generation of p48Cre/+; LSL‐KrasG12D/+ mice expressing the activated KrasG12D oncogene has been described previously.7 CD1d−/− mice have been described previously,12 and were housed at University of Oklahoma Health Sciences Center, Oklahoma City, OK. All animal protocols were approved by the Institutional Animal Care and Use Committee of University of Oklahoma Health Sciences Center (OUHSC; Oklahoma City, OK). The research presented in this paper was performed under the approved protocols; 30 ppm YS121 was used to experiments using these mice. Please see the Supplementary material (AppendixS1) for details.
Breeding and genotyping analysis
LSL‐KrasG12D/+ and p48Cre/+ mice were maintained in a C57BL/6 heterozygous genetic background and bred. Offspring of activated p48Cre/+.LSL‐KrasG12D/+ (KPT) and CD1d−/− mice were generated at the required quantities. KPT‐CD1d−/− were obtained by breeding CD1d−/− mice with KPT mice that have active K‐ras and that were deficient in both invariant (i)NKT and variant (v)NKT cells. The genotype of each pup for KPT and CD1d−/− was confirmed by tail DNA extraction and PCR.7, 12, 13 The loss of CD1d−/− was confirmed by flow cytometry and by tail DNA extraction and PCR in KPT‐CD1d−/− mice (see Supplementary material, Fig.S1).
Preclinical assays
The animal experiments were performed to understand the role of NKT cells, and the influence of NKT cells on TAMs. In experiments 1 and 2, 6‐week‐old mice were selected and randomized so that the average body weights in each group were equal (n = 9/6/group). In Experiment 1, to study the role of NKT cells specifically in pancreatic tumour development, KPT‐CD1d−/−, and KPT mice were used. Animals obtained regular chow until termination of the study. Observation for indications of weight loss or signs of toxicity and other abnormalities was routinely carried out. The mice were weighed once weekly for the first 6 weeks, and then once a month until termination. In experiment 2, to understand the regulatory role of NKT cells on M2‐type macrophage mPGES‐1 and 5‐LOX, KPT‐CD1d−/− mice were used. The mice were fed Purina diet for 11 weeks and then AIN‐76A experimental diets containing 0 ppm, 30 ppm YS121 until the end of the study. Observation for indications of weight loss or signs of toxicity and other abnormalities was routinely carried out. The mice were weighed once weekly until termination. After 6 weeks on experimental diet, all mice were killed by CO2 asphyxiation. Pancreata were collected from all experimental groups. Pancreata were then weighed and snap‐frozen in liquid nitrogen for further analysis. Collection, fixation and histopathological analysis of pancreata were performed as described earlier.7, 14 For details please see the Supplementary material (Appendix S1).
Isolation of immune cells and flow cytometric analysis
Pancreata were dissociated with a tumour dissociation kit for isolation of TAMs, NK cells, regulatory T (Treg) cells, and cancer stem cells (CSCs), using a gentleMACS Dissociator and a MACSmix™ Tube Rotator according to the manufacturer's instructions (Miltenyi Biotech, San Diego, CA, USA). The dissociated single‐cell suspensions of tumour tissues were treated with Fixation/Permeabilization solution (Biolegend, San Diego, CA, USA.). The fixed/permeabilized single‐cell suspensions were labelled with the above‐mentioned antibodies for TAMs, NK cells, Treg cells and CSCs, and were analysed on a FACSCalibur. Data were analysed with FlowJo software (FlowJo LLC, Oregon, USA).
Immunohistochemistry and immunohistofluorescence
Immunohistochemistry (IHC) was performed for mPGES‐1, CD68, Dclk1, 5‐LOX and Lgr5, as reported earlier.7 Sections of intestinal tissue were processed and incubated for 1 hr at room temperature with primary antibodies for 5‐LOX, TAMs (PE‐CD68), mPGES‐1, Dclk1 and Lgr5. Double immunofluorescent staining for mPGES‐1/TAMs, 5‐LOX/TAMs and Dclk1/Lgr5 was performed on pancreas sections. The sections were incubated overnight with anti‐mPGES‐1/anti‐5‐LOX/anti‐Dclk1/anti‐Lgr5 antibodies. The sections were washed three times with PBS for 5 min and were incubated with FITC‐linked secondary antibody to mPGES‐1/5‐LOX for 1 hr, along with phycoerythrin‐linked anti‐CD68 antibody for TAMs. The sections were incubated with FITC‐linked secondary antibody to Dclk1 for 1 hr, along with phycoerythrin‐linked Lgr5 antibody for CSCs. The sections were washed three times with PBS for 5 min in the dark room, and were incubated with 0·5 μg/ml 40,6‐diamidino‐2‐phenylindole (DAPI) for 5 min. Sections were rinsed with PBS and were observed for fluorescence under respective filters using an Olympus microscope IX701 (Olympus America, Center Valley, PA, USA.). Digital computer images were recorded with an Olympus DP70 camera. For quantification of Dclk1 cells, Lgr5 cells, NKT cells, 5‐LOX, TAMs and mPGES‐1, multiple sections and fields of the pancreas tissue were read for positively stained cells as the number of cells per field at × 400 magnification.
Statistical analysis
All results were expressed as means ± SEM unless otherwise stated. Student's t‐test with one‐tailed Welch's correction was used to evaluate the significant differences between groups. Differences were considered significant at the P < 0·05 level. All statistical analysis was performed using graphpad prism Software 5·1 (GraphPad Software, Inc., San Diego, CA).
Results
Low NKT cells and high mPGES‐1and 5‐LOX in TAMs from mouse and human pancreatic tumours
We observed high expression of mPGES‐1 and 5‐LOX in pancreatic tumours from KPT (p48Cre/+‐LSL‐KrasG12D/+) mice, compared with normal pancreatic tissues and increased expression was also observed in human pancreatic tumour tissue [Fig. 1a(i–v) and b(i–v); and see Supplementary material, Fig.S2]. However, we observed high levels of mPGES‐1 and 5‐LOX protein expression in infiltrating cells [Fig. 1a(i–v) and b(i–v); and see Supplementary material, Fig.S2]. In addition, CD68‐positive cells in murine and human pancreatic tumours exhibited higher mPGES‐1 and 5‐LOX expression than did CD68‐positive cells in normal pancreatic tissues (Fig. 1a(i–v) and b(i–v); and see Supplementary material, Fig.S2). Double‐staining with CD68 and stabilin demonstrated that higher expression of mPGES‐1 and 5‐LOX occurred in M2 macrophages (Fig.1c and d; and see Supplementary material, Fig.S2). High mPGES‐1 and 5‐LOX mRNA expression was observed in mouse pancreatic tumours compared with normal pancreatic tissues (Fig. 1e). This finding was confirmed by whole genome Illumina sequencing (using t‐test, with Benjamini's and Hochberg's corrections) of pancreatic tumours compared with normal pancreas (data not shown). We observed few NKT (Nkp1·1‐positive) cells, in pancreatic tumours from KPT (p48Cre/+‐LSL‐KrasG12D/+) mice, compared with normal pancreatic tissues (see Supplementary material, Fig. S3a). KPT mouse pancreatic tumour tissues showed very few NKT cells (purple colour) and KPT‐CD1d mice pancreatic tumour tissues did not show any NKT cell staining (see Supplementary material, Fig.S3b). Human pancreatic tumour tissues showed no NKT cells (see Supplementary material, Fig.S3c).
Figure 1.
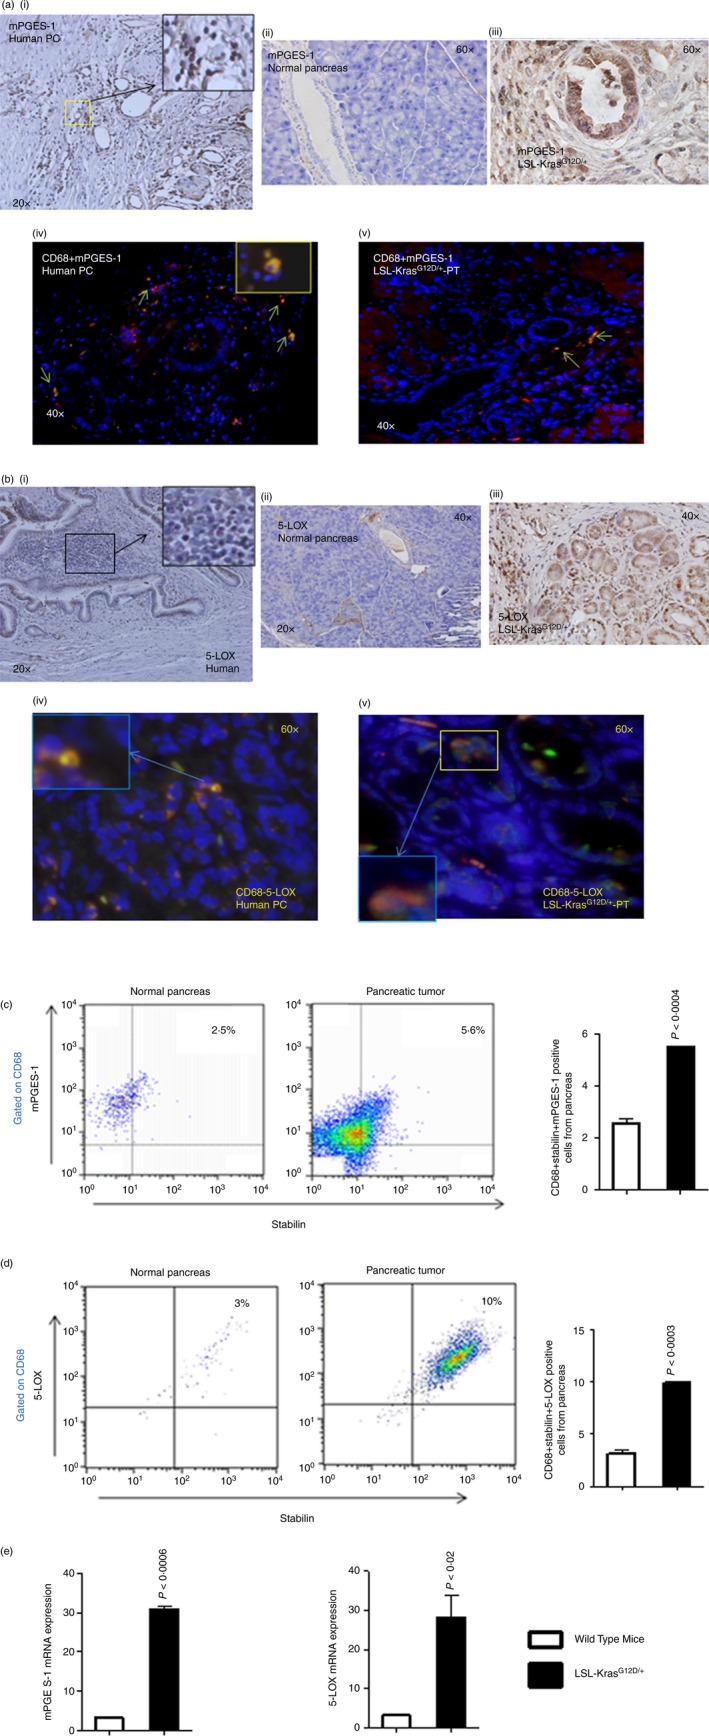
Expression of mPGES‐1, 5‐LOX and macrophages, and in LSL‐KrasG12D/+ mouse pancreases and in human pancreatic cancer. (a) Upper panel: IHC staining for mPGEs‐1 expression in human pancreatic tumours and in LSL‐KrasG12D/+ mouse pancreatic tumours. Lower panel: IHF staining for CD68 and mPGES‐1 double‐positive cells in human pancreatic tumours and in LSL‐KrasG12D/+ mouse pancreatic tumours. (b) Upper panel: IHC staining for 5‐LOX expression in human pancreatic tumours and in LSL‐KrasG12D/+ mouse pancreatic tumours. Lower panel: IHF staining for CD68 and 5‐LOX double‐positive cells in human pancreatic tumours and in LSL‐KrasG12D/+ mouse pancreatic tumours. (c) Flow cytometry analysis for M2 type macrophages (CD68 + Stabilin) positive for mPGES‐1 expression in pancreatic tumours from LSL‐KrasG12D/+ mice compared with pancreatic tissues from wild‐type mice. The numbers represent the % of total cells. (d) Flow cytometry analysis for M2‐type macrophages (CD68 + Stabilin) positive for 5‐LOX expression in pancreatic tumours from LSL‐KrasG12D/+ mice compared with pancreatic tissues from wild‐type mice. Data are given as means ± SE, with Welch's correction. The numbers represent the % of total cells. (e) mRNA analysis of normal pancreas versus LSL‐KrasG12D/+ mouse pancreatic tumours for mPGES‐1 and 5‐LOX. [Colour figure can be viewed at wileyonlinelibrary.com]
Phenotypic changes in genetically engineered mice, p48Cre/+‐LSL‐KrasG12D/+
We observed no phenotypic differences in the three genetically engineered mice used in this study. Furthermore, at the end of the experiments, there were no significant differences in body weight gains between KPT (p48Cre/+‐LSL‐KrasG12D/+) and KPT‐CD1d (CD1d−/−‐p48Cre/+‐LSL‐KrasG12D/+) mice that were fed the normal or experimental diets (data not shown). None of the animals that were fed the experimental diets exhibited any observable toxicity, defects or gross changes attributable to liver, kidney or lung damage, despite notable differences in the pancreatic weights, as described below. No NKT staining was observed in KPT‐CD1d mice (see Supplementary material, Fig.S3). Flow cytometry analysis confirmed the loss of CD1d in KPT‐CD1d mice (see Supplementary material, Fig.S3). The only exception was observable organ‐specific (pancreatic) tumour growth in each of the KPT and KPT‐CD1d genetically engineered mice, due to activation of K‐ras.
Increased PC progression in NKT‐deficient KPT‐CD1d mice
To further validate the role of NKT cells in pancreatic tumour progression, we generated KPT‐CD1d mice, which lack both iNKT and vNKT cells in an activated KPT background. We observed a significant difference (36%, P < 0·04) in the pancreas weights of KPT‐CD1d mice compared with KPT mice (Fig. 2a). Histological evaluation of Haematoxylin & Eosin‐stained figures suggested an increase in pancreatic intraepithelial neoplasia (PanIN) lesions in KPT‐CD1d mice compared with KPT mice (Fig. 2b). The pathologist's quantification of the histology slides revealed a 50% increase in total PanIN lesion formation in the absence of NKT cells in KPT‐CD1d mice compared with that found in KPT mice (Fig. 2c). At 22 weeks of age, KPT mice spontaneously developed PanIN lesions: PanIN 1 (175 ± 12·29), PanIN 2 (80 ± 1·96) and PanIN 3 (17 ± 3·56; Fig. 2d). In contrast, at 22 weeks of age, KPT‐CD1d mice developed more PanIN lesions, PanIN 1 (362 ± 17·7), PanIN 2 (162 ± 10·8) and PanIN 3 (30 ± 0·08), showing a significant increase in PanIN lesions in the absence of NKT cells (Fig. 2d). The difference in PanIN 1 lesions was two‐fold (Fig. 2d). Importantly, a ~43% increase was observed in PanIN3 (carcinoma in situ) lesions in KPT‐CD1d mice compared with KPT mice. In addition, the percentage of normal pancreas decreased significantly in KPT‐CD1d mice (Fig. 2e). We did not observe any carcinomas in KPT or KPT‐CD1d mice at this age.
Figure 2.
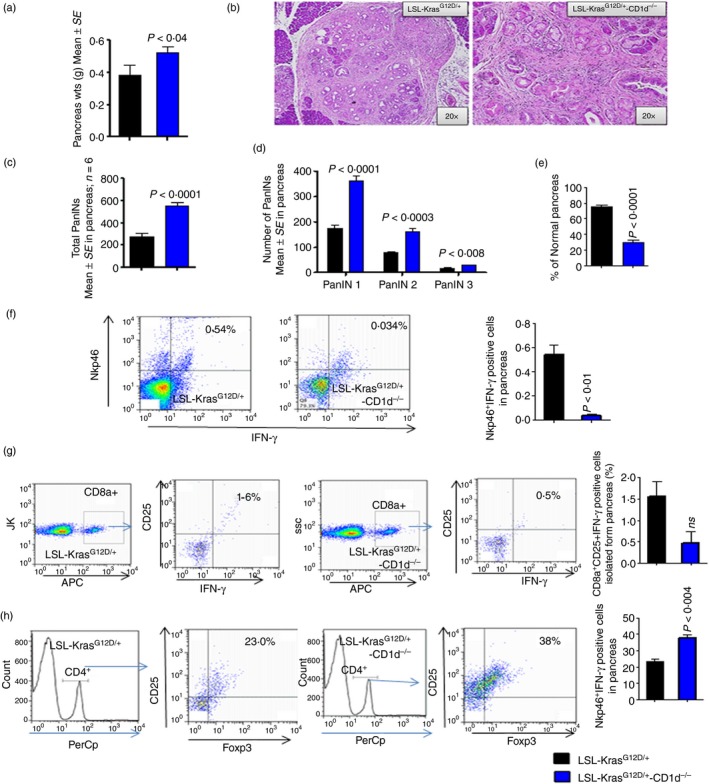
Loss of natural killer T (NKT) cells and activity decreased cytotoxicity of CD8a and NK cells and increased regulatory T (Treg) cells and pancreatic intraepithelial neoplasia (PanIN) lesions in LSL‐KrasG12D/+‐CD1d−/− mouse pancreas compared with LSL‐KrasG12D/+ mouse pancreas. (a) Pancreas weights. (b) H&E staining of pancreata from LSL‐KrasG12D/+ and LSL‐KrasG12D/+‐CD1d−/− mice. (c) Percentage of total PanIN lesions. (d) Number of PanIN lesions (e) Percentage of normal pancreas. (f) The pancreatic tumour cells are gated on lymphocytes and analysed for cells that are double‐positive for Nkp46 and interferon‐γ (IFN‐γ). The dot plot shows the double‐positive cells at the left hand corner of each plot. The bar graph shows the percentages of cells that were double‐positive cells for Nkp46 and IFN‐γ. (g) The pancreatic tumour cells are gated on CD8a‐positive cells and analysed for CD25 and IFN‐γ triple‐positive cells. The dot plot shows the triple‐positive cells at the left hand corner of each plot. The bar graph shows the percentages of triple‐positive cells for CD8a‐, CD25‐ and IFN‐γ‐positive cells. The numbers represent the % of total cells. (h) The pancreatic tumour cells are gated on CD4‐positive cells and analysed for CD25 and Foxp3 triple‐positive cells. The dot plot shows the triple‐positive cells at the left hand corner of each plot. The bar graph shows the percentages of cells that are triple‐positive for CD4, CD25 and Foxp3. Data are given as means ± SE with Welch's correction. The numbers represent the % of total cells. [Colour figure can be viewed at wileyonlinelibrary.com]
Decreased NK cell activity, CD8 cell cytotoxicity, and increased Treg cell and tumour cell proliferation in KPT‐CD1d mice
As it is known that NKT cells transactivate NK cell activity and influence adaptive immunity, we analysed the association of NKT loss in the KPT‐CD1d mice with altered NK cell activity, CD8 cells cytotoxicity, and Treg cells. We observed that the percentages of active NK cells [Nkp46 and interferon‐γ (IFN‐γ); 0·5400 ± 0·07, versus 0·034 ± 0·008, P < 0·01; Fig. 2f] and CD8 (CD8a, CD25 and IFN‐γ) cytotoxic cells were reduced in KPT‐CD1d mice, compared with KPT mice (1·60 ± 0·3500 versus 0·50 ± 0·2650, not significant; Fig. 2g). A significant (P < 0·004) increase in the percentage of Treg cells was also observed in KPT‐CD1d mice (38·00 ± 1·732; Fig. 2h), compared with KPT mice (23·0 ± 1·719; Fig. 2h). Furthermore, we observed significant increases in PCNA‐ (53·82 ± 4·684 versus 84·25 ± 7·36, P < 0·008) and Ki67‐ (66·32 ± 5·1 versus 86·75 ± 5·33, P < 0·01) positively stained cells in KPT‐CD1d mice compared with KPT mice (Fig. 3a–c).
Figure 3.
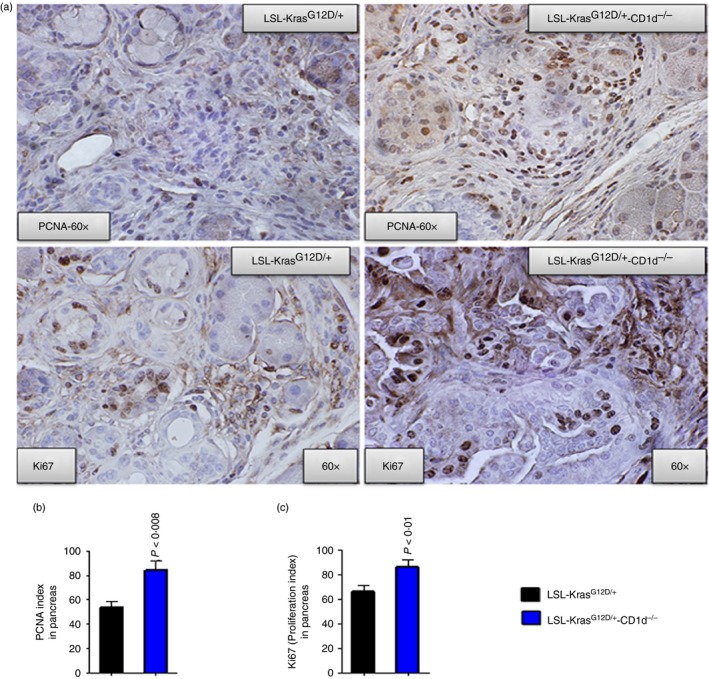
Expression of PCNA, Ki67, Dclk1 and Lgr5 in LSL‐KrasG12D/+‐CD1d−/− compared with LSL‐KrasG12D/+ mouse pancreata. (a) Upper panel: IHC staining for PCNA expression in LSL‐KrasG12D/+ and LSL‐KrasG12D/+‐CD1d−/− mouse pancreatic tumours. Lower panel: IHC staining for Ki67 expression in LSL‐KrasG12D/+ and LSL‐KrasG12D/+‐CD1d−/− mouse pancreatic tumours. (b) Bar graphs depicting PCNA‐positive cells/index. (c) Bar graphs depicting Ki67 proliferation index. [Colour figure can be viewed at wileyonlinelibrary.com]
Increased expression of mPGES‐1/5‐LOX in TAMs and cancer stem‐like cells in KPT‐CD1 mice
The pancreatic tumours from KPT‐CD1d mice had higher expression of mPGES‐1 (~12%)/5‐LOX (~28%) and more TAMs (CD68 positive cells, 106·8 ± 8·85 versus 63·50 ± 3·61, P < 0·01) compared with KPT mice (Fig. 4a–f). Furthermore, the pancreatic tumours analysed using flow cytometry suggested an increased expression of mPGES‐1 in cells that were double‐positive for CD68 and stabilin (M2‐type macrophages) in KPT‐CD1d mice compared with KPT mice (Fig. 4g–h). Also the pancreatic tumours analysed using flow cytometry suggested an increased expression of 5‐LOX in cells that were double‐positive for CD68 and stabilin (M2‐type macrophages) in KPT‐CD1d mice compared with KPT mice (Fig. 5a–f).
Figure 4.
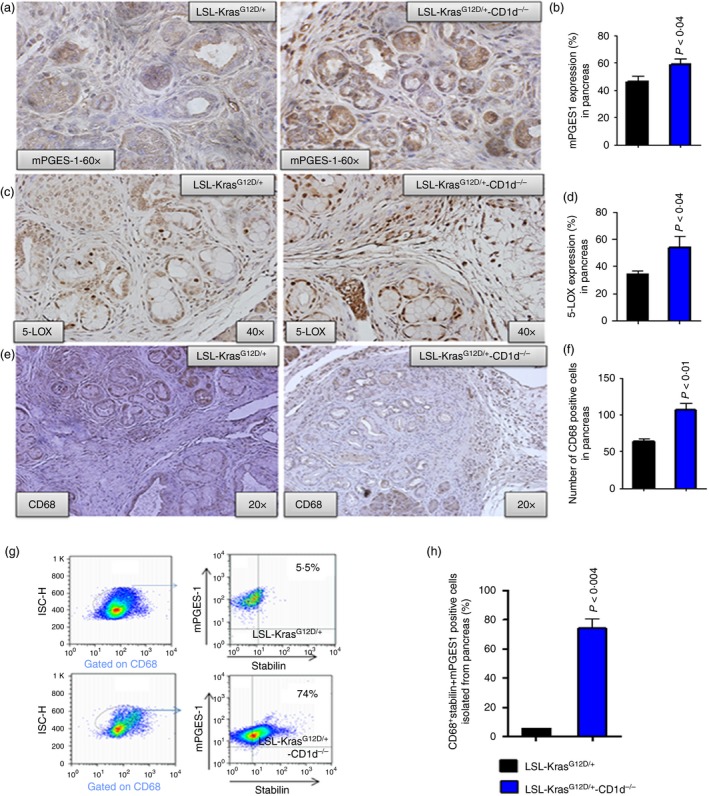
Loss of natural killer T (NKT) cells increased mPGES‐1, 5‐LOX, CD68 in pancreatic tumours from LSL‐KrasG12D/+‐CD1d−/− mice, compared with LSL‐KrasG12D/+ mice. (a) Upper panel: IHC for mPGES‐1 protein expression. (b) Bar graphs depicting mPGEs‐1 protein expression. (c) Middle panel: IHC for 5‐LOX protein expression. (d) Bar graphs depicting 5‐LOX protein expression. (e) Lower panel: IHC for CD68‐positive cells. (f) Bar graph depicting CD68‐positive cells. (g, h) Flow cytometry analysis for M2‐type macrophages (CD68 + Stabilin) positive for mPGES‐1 expression in pancreatic tumours from LSL‐KrasG12D/+ mice, compared with LSL‐KrasG12D/+‐CD1d−/− mice. The bar graphs show the percentages of cells that are triple‐positive for CD68 + Stabilin+mPGES‐1. The numbers represent the % of total cells. Data are given as means ± SE with Welch's correction. [Colour figure can be viewed at wileyonlinelibrary.com]
Figure 5.
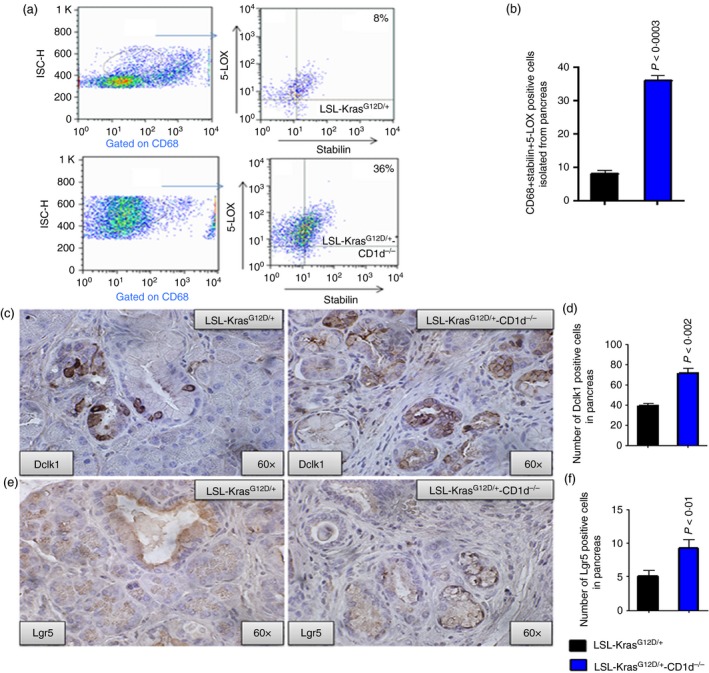
Increased expression of 5‐LOX and cancer stem cells in pancreatic tumours from LSL‐KrasG12D/+‐CD1d−/− mice, compared with LSL‐KrasG12D/+ mice. (a) Flow cytometry analysis for M2 type macrophages (CD68 + Stabilin) positive for 5‐LOX expression in pancreatic tumours from LSL‐KrasG12D/+ mice, compared with LSL‐KrasG12D/+‐CD1d−/− mice. The numbers represent the % of total cells. (b) The bar graphs shows the percentages of cells that are triple‐positive for CD68 + Stabilin+mPGES‐1. Data are given as means ± SE with Welch's correction. (c) Upper panel: IHC staining for Dclk1 expression in LSL‐KrasG12D/+ and LSL‐KrasG12D/+‐CD1d−/− mouse pancreatic tumours. (d) Bar graph depicting Dclk1‐positive cells. (e) Lower panel: IHC staining for Lgr5 expression in LSL‐KrasG12D/+ and LSL‐KrasG12D/+‐CD1d−/− mouse pancreatic tumours. (f) Bar graphs depicting Lgr5‐positive cells. [Colour figure can be viewed at wileyonlinelibrary.com]
Because the PGE2 metabolite of mPGES‐1 has been shown to enhance cancer cell stemness in tumours,15, 16 and mPGES‐1 is increased in KPT‐CD1d mice, we compared the expression of CSCs using markers DCLK1 and LGR5 in pancreatic tumours from KPT‐CD1d and KPT mice. Immunohistochemical analysis of the pancreatic tumours showed a similar increase in the number of Dclk1‐ and Lgr5‐positive cells in the KPT‐CD1d tumours compared with the KPT tumours (Dclk1‐71·75 ± 5·250 versus 38·82 ± 2·888, P < 0·002; Lgr5‐9·250 ± 1·315 versus 5·070 ± 0·8895, P < 0·01, respectively; Fig. 5c–f). These results suggest that increases in CSCs were associated with an increase in mPGES‐1 expression and absence of NKT cells in KPT‐CD1d mice.
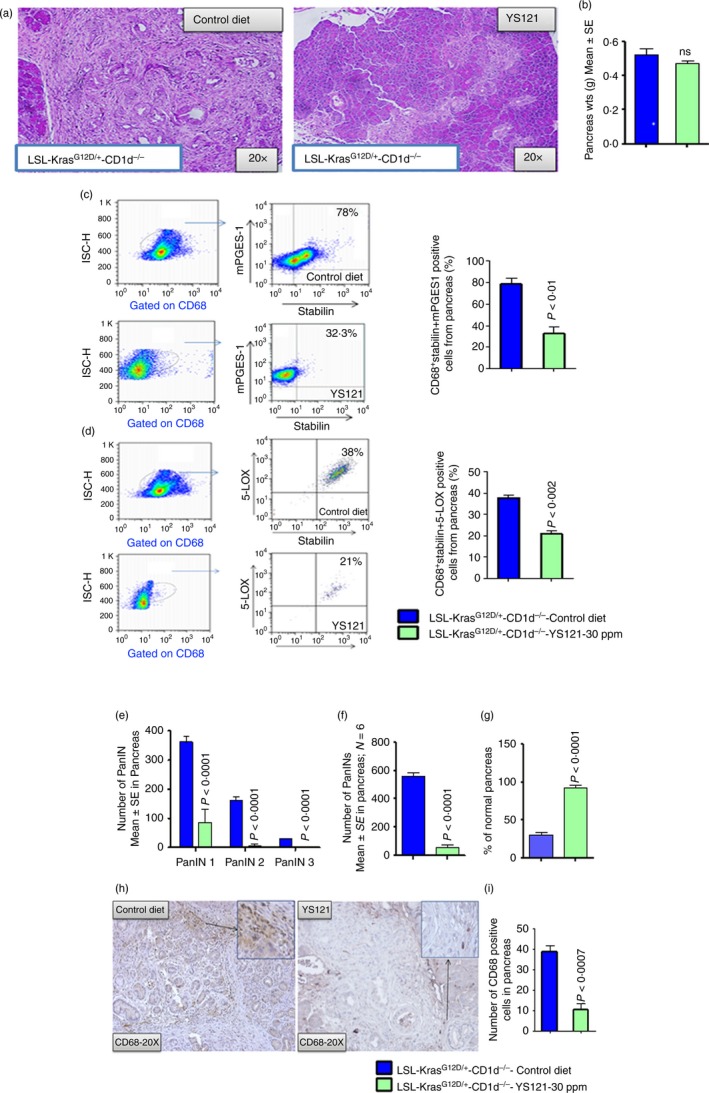
Pharmacological inhibition of mPGES‐1/5‐LOX decreased pancreatic tumorigenesis in KPT‐CD1d mice
We used a specific mPGES‐1/5‐LOX inhibitor, YS121, to test whether these enzymes play a role in the reduced pancreatic tumorigenesis observed in KPT‐CD1d mice. Histological evaluation of the pancreatic tumours after 6 weeks of YS121 treatment revealed fewer PanIN lesions and most pancreas tissue devoid of PanIN lesions in the treatment group (Fig. 6a and b). Flow cytometry analysis showed a significant decrease in the percentage of M2 macrophages specifically expressing mPGES‐1/5‐LOX in pancreatic tumours (10%, P < 0·04) of KPT‐CD1d mice treated with YS121 compared with untreated KPT‐CD1d mice (32·33 ± 6·386, versus 78 ± 5·460 P < 0·01/21·00 ± 1·528 versus 38 ± 1·444, P < 0·002; Fig. 6c and d). Furthermore, pancreatic histology showed that pharmacological inhibition of mPGES‐1 led to significant suppression of PanIN 1, 2 and 3 lesions (86·7 ± 44·99, 7 ± 4·733 and 0, respectively), compared with PanIN 1, 2 and 3 lesions (362·33 ± 17·8, 162·0 ± 10·85 and 30·0 ± 0·88, respectively) in the KPT‐CD1d mice fed control diet (Fig. 6e and g). PanIN 3 lesions and/or carcinomas in situ were completely suppressed in the YS121‐treated mice (Fig. 6e,f). Up to 92·5% of the pancreata from KPT‐CD1d mice treated with YS121 appeared normal (i.e. free from PanIN lesions), whereas only up to 30% appeared normal in the untreated KPT‐CD1d mice (Fig. 6g). Furthermore, the numbers of CD68‐positive macrophage cells were significantly decreased in YS‐121‐treated pancreata compared with untreated pancreata in KPT‐CD1d mice (38·50 ± 3·38 versus 10·25 ± 2·9, P < 0·007; Fig. 6h–i).
Figure 6.
YS121 pharmacological suppression of mPGES‐1/5‐LOX in CD68 cells decreased formation of pancreatic intraepithelial neoplasia (PanIN) lesions in LSL‐KrasG12D/+ ‐CD1d−/− mice. (a) H&E staining of pancreas from control LSL‐KrasG12D/+ ‐CD1d−/− mice and YS121‐treated (30 ppm) LSL‐KrasG12D/+ ‐CD1d−/− mice. (b) Pancreas weights. (c) Dot plot of flow cytometry analysis for M2‐type macrophages (CD68 + Stabilin) positive for mPGES‐1 expression in pancreatic tumours from control LSL‐KrasG12D/+‐CD1d−/− and YS121‐treated (30 ppm) LSL‐KrasG12D/+‐CD1d−/− mice. Bar graph depicting the percentage of cells positive for mPGES‐1 expression in M2 type macrophages in control LSL‐KrasG12D/+‐CD1d−/− mice and YS121‐treated (30 ppm) LSL‐KrasG12D/+ ‐CD1d−/− mice. The numbers represent the % of total cells. (d) Flow cytometry analysis for M2‐type macrophages (CD68 + Stabilin) positive for 5‐LOX expression in pancreatic tumours from control LSL‐KrasG12D/+‐CD1d−/− and YS121‐treated (30 ppm) LSL‐KrasG12D/+‐CD1d−/− mice. Bar graph depicting the percentage of cells positive for 5‐LOX expression in M2 type macrophages in control LSL‐KrasG12D/+‐CD1d−/− mice and YS121‐treated (30 ppm) LSL‐KrasG12D/+ ‐CD1d−/− mice. The numbers represent the % of total cells. (e) Histopathological analysis using H&E staining of pancreas from control LSL‐KrasG12D/+‐CD1d−/− mice and YS121‐treated (30 ppm) LSL‐KrasG12D/+ ‐CD1d−/− mice. (f) Percentage of total PanIN lesions. (g) Percentage of normal pancreas. (h) IHC for CD68‐positive cells. (i) Bar graph depicting the CD68‐positive cells in control LSL‐KrasG12D/+‐CD1d−/− mice and YS121‐treated (30 ppm) LSL‐KrasG12D/+ ‐CD1d−/− mice. Data are given as means ± SE with Welch's correction. [Colour figure can be viewed at wileyonlinelibrary.com]
mPGES‐1 inhibition led to decreased expression of CSCs and proliferation indices in KPT‐CD1d mice
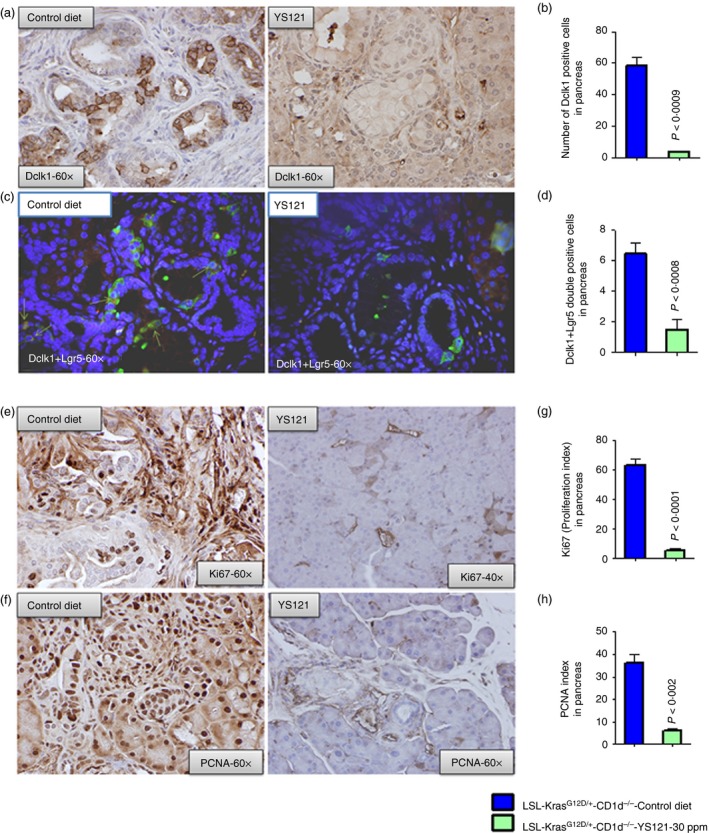
As shown in Fig. 7(a and b) when evaluated by IHC and immunohistofluorescence (IHF), pancreatic tissues of YS121‐treated KPT‐CD1d mice showed significantly reduced (%, 91·34 ± 3·672 versus 48·90 ± 2·617, P < 0·001) expression of markers of CSCs compared with KPT mice (Fig. 7a–d). Upon YS121 treatment, IHC analysis revealed reduced protein expression of Dclk1‐positive cells (mean ± SEM, 58·25 ± 5·154 versus 3·500 ± 0·6455, P < 0·0009). IHF analysis showed that cells that were double‐positive for Dclk1 and Lgr5 were also reduced upon treatment with YS121 (mean ± SEM, 6·500 ± 0·6455 versus 1·500 ± 0·6455, P < 0·0008). Taken together, these findings (Fig. 7c and d) suggest that mPGES‐1/5‐LOX inhibition led to a decrease in the CSCs. Ki67 and PCNA staining was performed on tumour tissues to assess tumour inhibition. Significant inhibition of proliferation markers Ki67 (Fig. 7e, upper panel) and PCNA (Fig. 7f, lower panel) were also observed in the pancreata from YS121‐treated mice. Decreased proliferation indices for Ki67 staining (63·35 ± 3·897 versus 5·250 ± 1·652, P < 0·0001) and , for PCNA staining (36·32 ± 3·581 versus 6·000 ± 1·080, P < 0·002) were observed in pancreatic tumours of YS121‐treated mice compared with untreated mice (Fig. 7g and h).
Figure 7.
Inhibition of mPGES‐1/5‐LOX leads to decrease in Dclk1‐ and Lgr5‐positive cells and decreased proliferating (PCNA and Ki67 positive) cells in pancreatic tumours. (a) IHC staining for Dclk1 expression in staining of pancreas from control LSL‐KrasG12D/+‐CD1d−/− mice and YS121‐treated (30 ppm) LSL‐KrasG12D/+ ‐CD1d−/− mice. (b) Bar graph depicting the Dclk1‐positive cells in control LSL‐KrasG12D/+‐CD1d−/− mice and YS121‐treated (30 ppm) LSL‐KrasG12D/+ ‐CD1d−/− mice. (c) IHF staining for Dclk1 and Lgr5 double‐positive cells in pancreas from control LSL‐KrasG12D/+‐CD1d−/− mice and YS121‐treated (30 ppm) LSL‐KrasG12D/+ ‐CD1d−/− mice. (d) Bar graph depicting the Dclk1 plus Lgr5 double‐positive cells in control LSL‐KrasG12D/+‐CD1d−/− mice and YS121‐treated (30 ppm) LSL‐KrasG12D/+ ‐CD1d−/− mice. (e) IHC staining for PCNA‐positive cells in pancreas from control LSL‐KrasG12D/+‐CD1d−/− mice and YS121‐treated (30 ppm) LSL‐KrasG12D/+ ‐CD1d−/− mice. (f) IHC staining for Ki67‐positive cells in pancreas from control LSL‐KrasG12D/+‐CD1d−/− mice and YS121‐treated (30 ppm) LSL‐KrasG12D/+ ‐CD1d−/− mice. (g) Bar graphs depicting Ki67 proliferation index. (h) Bar graphs depicting PCNA‐positive cells/index. c) [Colour figure can be viewed at wileyonlinelibrary.com]
Pharmacological inhibition of mPGES‐1/5‐LOX restored NK cell and CD8+ cell cytotoxicity and reduced Treg cells in KPT‐CD1d mice
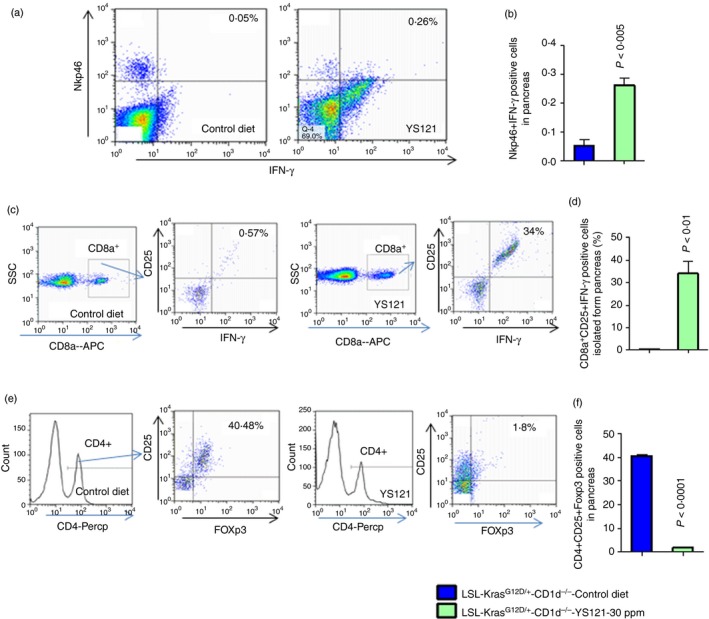
Although Nkp46‐positive cells were present in the pancreata of control KPT‐CD1d mice, these cells were devoid of IFN‐γ expression, suggesting loss of activity. Suppression of mPGES‐1 resulted in active NK cell populations in treated pancreatic tumours (untreated 0·05133 ± 0·02467 versus treated 0·2610 ± 0·02616, P < 0·005, Fig. 8a,b). In further analysis for effects on adaptive immunity, a significant increase in CD8+ cells cytotoxicity (untreated 0·5700 ± 0·1060 versus treated 34·00 ± 5·292, P < 0·01; Fig. 8c,d) and a decrease in the percentage of Treg cells (untreated 40·48 ± 0·7157 versus treated 1·8 ± 0·2310, P < 0·0001; Fig. 8e,f) were observed in treated pancreatic tumours, compared with untreated pancreatic tumours.
Figure 8.
Inhibition of mPGES‐1/5‐LOX leads to increase in CD8a‐ and NKp46‐positive cells and decrease in Foxp3‐positive CD4 cells. (a) The pancreatic tumour cells are gated on lymphocytes and analysed for cells that are double‐positive for Nkp46 and interferon‐γ (IFN‐γ). The dot plot shows the double‐positive cells at the left hand corner of each plot. (b) The bar graph shows the percentages of cells that are double‐positive for Nkp46 and IFN‐γ. The numbers represent the % of total cells. (c) Flow cytometry analysis for CD8a, CD25 and IFN‐γ triple‐positive cells. The dot plot shows the triple‐positive cells at the left hand corner of each plot. (d) The bar graph represents the percentages of cells that are triple‐positive cells for CD8a, CD25 and IFN‐γ. The numbers represent the % of total cells. (e) The pancreatic tumour cells are gated on CD4‐positive cells and analysed for double‐positive cells for CD25 and Foxp3. The dot plot shows the triple‐positive cells at the left hand corner of each plot. (f) The bar graph shows the percentages of cells that are triple‐positive for CD4, CD25 and Foxp3. The numbers represent the % of total cells. Data are given as means ± SE with Welch's correction. [Colour figure can be viewed at wileyonlinelibrary.com]
Discussion
To our knowledge, this is the first study addressing the role of NKT cell‐mediated anti‐tumour immunity in pancreatic tumorigenesis. Our results demonstrate the presence and absence of NKT cells with pancreatic tumour progression, and provide mechanistic insight into these associations. Human clinical specimens and KPT specimens exhibited lower levels of NKT cells in pancreatic tumours than in normal pancreatic tissue. In addition, the M2‐type macrophages within the tumours expressed higher levels of mPGES‐1and 5‐LOX than did the macrophages in normal tissue. Induction of early anti‐tumour immune responses by NK cells and NKT cells has been reported in several studies; more emphasis was given towards increasing NK cell immune responses by using combination immune therapies.17, 18, 19, 20, 21, 22 KPT‐CD1d mice, which produced no NKT cells, exhibited increased pancreatic tumour development and progression and more TAM M2, which expressed higher levels of mPGES1/5‐LOX, compared with what was observed in KPT mice. These results indicate that (i) the absence of NKT cells might have led to an increase in macrophages, and (ii) an increase of mPGES‐1/5‐LOX expression in M2 macrophages. These data suggest that NKT cells inhibit pancreatic tumorigenesis by modulating M2 macrophages and their expression of mPGES‐1/5‐LOX. To further test this theory, we inhibited mPGES‐1/5‐LOX in KPT‐CD1d mice and analysed PanIN lesion progression. A dramatic decrease in PanIN I and II lesions was observed, with no PanIN III (carcinoma in situ), upon inhibition of mPGES‐1/5‐LOX. Suggesting that NKT cells possess natural anti‐tumour properties – rather than killing tumour cells directly, they modulate non‐malignant cells such as TAMs via the inhibition of TAM‐specific mPGES‐1/5‐LOX, which is a critical mechanism for the survival and growth of the neoplastic cells (Fig. 9). Furthermore, the inhibition of pancreatic tumour progression caused by the mPGES1/5‐LOX inhibitor was associated with altered immune cell profiles (increased NK cell and CD8+ cell cytotoxicity and decreased Treg cells) and reduction of tumour cell CSC biomarker expression within the pancreatic tumours. We and others reported that high levels of PGE2 support the enhancement or protection of CSCs during pancreatic tumorigenesis. In the tumour microenvironment, mPGES‐1 in the TAMs is primarily responsible for PGE2; the TAMs appear to protect CSCs from anti‐tumour immune cytotoxic cells, so promoting tumour progression and recurrence.23, 24 It was recently observed that NKT cells control tumour‐supportive inflammation by killing M2‐like TAMs or by polarizing them to M1 in a xenograft model.25
Figure 9.
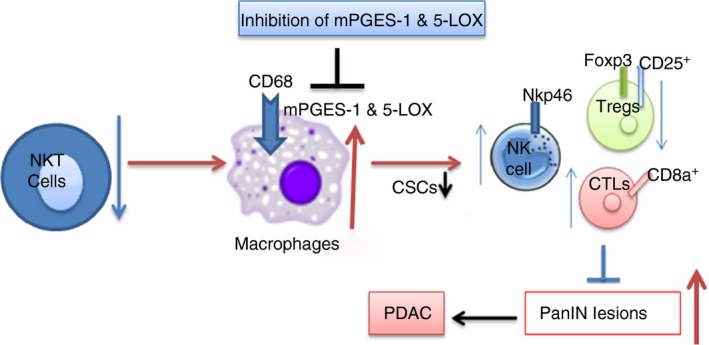
Graphical representation of loss of natural killer T (NKT) cells leads to up regulation of inflammatory markers mPGES‐1/5‐LOX in M2 macrophages and aggravate progression of pancreatic cancer and inhibition of mPGES‐1/5‐LOX leads to inhibition of pancreatic intraepithelial neoplasia (PanIN) lesions and, eventually, results in inhibition of pancreatic cancer. [Colour figure can be viewed at wileyonlinelibrary.com]
The CD1d mouse model used in the present study is devoid of type 1 and 2 NKT cells, because both these cell types are CD1d‐restricted. The functions of type I NKT cells were reported to be suppressed by type II NKT cell activation in in vitro and in vivo tumour models.26 In addition, due to possible CD1d restriction in both types of NKT cells and competition for CD1d binding, type II NKT cell expansion may be inhibited by type I. It is still unclear how type I NKT cells interact with the other groups of NKT cells in the pancreas. NKT cells are well known to transactivate NK cells against tumour cells and to influence adaptive immunity. Hence, we further investigated how NK cells are altered when the function of NKT cells is lost, and how NK cell function is restored when M2 functions are inhibited.
The protective role of NKT cells in tumour immunosurveillance has been reported in melanomas, fibrosarcomas and in a transgenic prostate cancer mouse model.13, 27, 28, 29 The NKT cells transactivate NK cells through production of IFN‐γ. In the present study, YS121 increased IFN‐γ production by NK cells in KPT, although total IFN‐γ production in the pancreatic tumours was not significant (data not shown). In addition, we observed tumour‐specific activation of CD8a T‐cell responses towards proliferating tumour cells. mPGES‐1/5‐LOX in M2 macrophage inhibition increased CD8a+‐CD25+‐IFN‐γ‐producing cells and decreased Treg cells. Most inflammatory cells, however, reside in the tumour stroma, and can produce inflammatory eicosanoids, such as PGE2, which in turn influence tumour cell proliferation and help the tumour escape from anti‐tumour immune responses. It is evident from our results that NKT cells play a regulatory role on other immune cells through mPGES‐1/5‐LOX in M2. Further in‐depth experiments to study how mPGES‐1/5‐LOX may regulate Treg cell function are warranted. These results suggest that, in a scenario of fewer/less active NKT cells during tumorigenesis, suppression of mPGES‐1/5‐LOX could enhance anti‐tumour functions in pancreatic carcinogenesis. Hence, the development of agents to enhance NKT cell function or to inhibit mPGES‐1 for clinical PC prevention or treatment is warranted.
In conclusion, the present study demonstrates altered pancreatic tumour development and progression in mice with altered immune cell profiles, but within the otherwise isogenic KPT background. The absence of NKT cells was associated with increased pancreatic tumour development and progression. Higher levels of mPGES‐1/5‐LOX in the TAMs upon the loss of NKT cells appear to contribute to pancreatic tumour progression.
Author contributions
N.B.J. performed all experiments unless otherwise noted; A.M. generated LSL‐Kras mouse, performed necropsy, collected tumour specimens and performed gene expression analysis; T.B. performed mouse genotyping, assisted in flow cytometry measurements, IHC and IHF; R.R. aided mouse genotyping; S.L. performed histopathological assessment; N.S. assisted in IHF and IHC; L.J. helped with the transcriptome analysis; N.B.J., A.M. and C.V.R. analysed the data; N.B.J. wrote the paper; N.B.J., A.M. and C.V.R. designed the study. N.B.J., A.M., D.B.M., M.L.L., A.A. and C.V.R. collected literature and reviewed the paper for intellectual content. All authors were involved in the discussion of results and critical reading of the manuscript and approved the final version.
Grant support
Study was supported in part by College of Medicine Alumni Association award, Kerley‐Cade Chair Endowment and NCI‐CN‐53300. Transcriptome analysis was supported by the National Center for Research Resources and the National Institute of General Medical Sciences of the National Institutes of Health through Grant Number 8P20GM103447.
Conflicts of interest
The authors have no conflicts of interest.
Supporting information
Figure S1 a) Flow cytometry of C57BL/6 wild‐type and CD1d‐LSL‐KrasG12D/+ animal spleen cells stained with CD1d antibody (green) or isotype control (blue). DNA gel electrophoresis image of genotyping of CD1d−/− and wild‐type (WT) animal.
Figure S2 Quantitative histograms for mPGES1, 5‐LOX staining and CD68 plus mPGES1 and CD68 plus 5‐LOX positive cells in pancreatic tumours.
Figure S3 (a) TCR‐β and Nk1.1 double‐positive natural killer T (NKT) cells in LSL‐KrasG12D/+ mice; (b) TCR‐β and Nk1.1 double‐positive NKT cells in LSL‐KrasG12D/+‐CD1d−/− mice; (c) TCR‐Vα24‐J α18 and Granzyme B double‐positive NKT cells in human pancreatic cancer tissue.
Appendix S1 Supplementary Materials and methods
Acknowledgements
The authors thank the University of Oklahoma Health Sciences Center Rodent Barrier Facility staff. We also want to thank Ms Kathy Kyler and Ms Agata Bien for editorial help. We thank Dr Gopal Pathuri for synthesizing YS121. We thank the Stephenson Cancer Center at the University of Oklahoma Health Sciences Center, Oklahoma City, OK, for the use of Biospecimen Acquisition Core and Bank, which provided human PC tissue slides. We also thank the Laboratory for Genomics and Bioinformatics at the OUHSC for providing core services for sequencing of pancreatic tissues. The authors also thank Jim Henthorn at the Flow Cytometry Core for his assistance with flow work. We thank Dr M. Lang for providing CD1d−/− mice.
Current Address: Chemopreventive Agent Development Research Group, Division of Cancer Prevention, NCI, Rockville, MD, USA
Contributor Information
Naveena B. Janakiram, Email: njanakir@ouhsc.edu
Chinthalapally V. Rao, Email: cv-rao@ouhsc.edu.
References
- 1. American Cancer Society . https://www.cancer.org/cancer/pancreatic-cancer/about/key-statistics.html
- 2. Sergei IG, Florian RG, Michael K. Immunity, Inflammation, and Cancer. Cell 2010; 140:883–99. [DOI] [PMC free article] [PubMed] [Google Scholar]
- 3. Song L, Asgharzadeh S, Salo J, Engell K, Wu HW, Sposto R et al Vα24‐invariant NKT cells mediate antitumor activity via killing of tumor‐associated macrophages. J Clin Invest 2009; 119:1524–36. [DOI] [PMC free article] [PubMed] [Google Scholar]
- 4. Nakanishi M, Gokhale V, Meuillet EJ, Rosenberg DW. mPGES‐1 as a Target for Cancer Suppression: a comprehensive invited review “Phospholipase A2 and lipid mediators”. Biochimie 2010; 92:660–4. [DOI] [PMC free article] [PubMed] [Google Scholar]
- 5. Nakanishi M, Menoret A, Tanaka T, Miyamoto S, Montrose DC, Vella AT et al Selective PGE2 suppression impairs colon carcinogenesis and modifies local mucosal immunity. Cancer Prev Res 2011; 4:1198–208. [DOI] [PMC free article] [PubMed] [Google Scholar]
- 6. Mohammed A, Janakiram NB, Li Q, Choi C‐In, Zhang Y, Steele VE et al Chemoprevention of Colon and Small Intestinal Tumorigenesis in APCMin/+ Mice by Licofelone, a Novel Dual 5‐LOX/COX Inhibitor: potential Implications for Human Colon Cancer Prevention. Cancer Prev Res 2011;4[12]:2015–26. [DOI] [PMC free article] [PubMed] [Google Scholar]
- 7. Mohammed A, Janakiram NB, Madka V, Brewer M, Ritchie RL, Lightfoot S et al Targeting pancreatitis blocks tumor‐initiating stem cells and pancreatic cancer progression. Oncotarget 2015; 6:15524–39. [DOI] [PMC free article] [PubMed] [Google Scholar]
- 8. Sasaki Y, Kamei D, Ishikawa Y, Ishii T, Uematsu S, Akira S et al Microsomal prostaglandin E synthase‐1 is involved in multiple steps of colon carcinogenesis. Oncogene 2012; 31:2943–52. [DOI] [PubMed] [Google Scholar]
- 9. Kalinski P. Regulation of immune responses by prostaglandin E2 . J Immunol 2012; 188:21–8. [DOI] [PMC free article] [PubMed] [Google Scholar]
- 10. Sinha P, Clements VK, Fulton AM, Ostrand‐Rosenberg S. Prostaglandin E2 promotes tumor progression by inducing myeloid‐derived suppressor cells. Cancer Res 2007; 67:4507–13. [DOI] [PubMed] [Google Scholar]
- 11. Yang FC, Agematsu K, Nakazawa T, Mori T, Ito S, Kobata T et al CD27/CD70 interaction directly induces natural killer cell killing activity. Immunology 1996; 88:289–93. [DOI] [PMC free article] [PubMed] [Google Scholar]
- 12. Exley MA, Bigley NJ, Cheng O, Shaulov A, Tahir SM, Carter QL et al Innate immune response to encephalomyocarditis virus infection mediated by CD1d. Immunology 2003; 110:519–26. [DOI] [PMC free article] [PubMed] [Google Scholar]
- 13. Lang GA, Johnson AM, Devera TS, Joshi SK, Lang ML. Reduction of CD1d expression in vivo minimally affects NKT‐enhanced antibody production but boosts B‐cell memory. Int Immunol 2011; 23:251–60. [DOI] [PMC free article] [PubMed] [Google Scholar]
- 14. Brat DJ, Lillemoe KD, Yeo CJ, Warfield PB, Hruban RH. Progression of pancreatic intraductal neoplasias to infiltrating adenocarcinoma of the pancreas. Am J Surg Pathol 1998; 22:163–9. [DOI] [PubMed] [Google Scholar]
- 15. Kurtova AV, Xiao J, Mo Q, Pazhanisamy S, Krosnow R, Lerner SP et al Blocking PGE2‐induced tumour repopulation abrogates bladder cancer chemoresistance. Nature 2015; 517:209–13. [DOI] [PMC free article] [PubMed] [Google Scholar]
- 16. Wang D, Fu L, Sun H, Guo L, DuBois RN. Prostaglandin E2 promotes colorectal cancer stem cell expansion and metastasis in mice. Gastroenterology 2015; 149:1884–95. pii: S0016‐5085[15]01097‐5. https://doi.org/10.1053/j.gastro.2015.07.064 [DOI] [PMC free article] [PubMed] [Google Scholar]
- 17. Konjevic G, Jurisic V, Jovic V, Vuletic A, Martinovic MK, Radenkovic S et al Investigation of NK cell function and their modulation in different malignancies. Immunol Res 2012; 52:139–56. [DOI] [PubMed] [Google Scholar]
- 18. McGilvray RW, Eagle RA, Watson NF, Al‐Attar A, Ball G, Jafferji I et al NKG2D ligand expression in human colorectal cancer reveals associations with prognosis and evidence for immunoediting. Clin Cancer Res 2009; 15:6993–7002. [DOI] [PMC free article] [PubMed] [Google Scholar]
- 19. Hilpert J, Grosse‐Hovest L, Grunebach F, Buechele C, Nuebling T, Raum T et al Comprehensive analysis of NKG2D ligand expression and release in leukemia: Implications for NKG2D‐mediated NK cell responses. J Immunol 2012; 189:1360–71. [DOI] [PubMed] [Google Scholar]
- 20. Garcia‐Iglesias T, Del Toro‐Arreola A, Albarran‐Somoza B, Del Toro‐Arreola S, Sanchez‐Hernandez PE, Ramirez‐Duenas MG et al Low NKp30, NKp46 and NKG2D expression and reduced cytotoxic activity on NK cells in cervical cancer and precursor lesions. BMC Cancer 2009; 9:186. [DOI] [PMC free article] [PubMed] [Google Scholar]
- 21. Mamessier E, Sylvain A, Thibult ML, Houvenaeghel G, Jacquemier J, Castellano R et al Human breast cancer cells enhance self tolerance by promoting evasion from NK cell antitumor immunity. J Clin Invest 2011; 121:3609–22. [DOI] [PMC free article] [PubMed] [Google Scholar]
- 22. Yun‐Peng P, Zhu Y, Zhang J‐J, Ze‐K Xu, Qian Z‐Y, Dai C‐C et al Comprehensive analysis of the percentage of surface receptors and cytotoxic granules positive natural killer cells in patients with pancreatic cancer, gastric cancer, and colorectal cancer. J Transl Med 2013; 11:262. [DOI] [PMC free article] [PubMed] [Google Scholar]
- 23. Pollard JW. Tumour‐educated macrophages promote tumour progression and metastasis. Nat Rev Cancer 2004; 4:71–8. [DOI] [PubMed] [Google Scholar]
- 24. Chanmee T, Ontong P, Konno K, Itano N. Tumor‐associated macrophages as major players in the tumor microenvironment. Cancers 2014; 6:1670–90. [DOI] [PMC free article] [PubMed] [Google Scholar]
- 25. Ambrosino E, Terabe M, Halder RC, Peng J, Takaku S, Miyake S et al Cross‐regulation between type I and type II NKT cells in regulating tumor immunity: a new immunoregulatory axis. J Immunol 2007; 179:5126–36. [DOI] [PubMed] [Google Scholar]
- 26. Courtney NA, Tian G, Liu D, Marinova E, Heczey A, Xu X et al Cross‐talk between NKT cells and tumor associated macrophages in the tumor microenvironment. J Immunol 2016; 196(1 Supplement):142.7. [Google Scholar]
- 27. Kawano T, Cui J, Koezuka Y, Toura I, Kaneko Y, Sato H et al Natural killer‐like nonspecific tumor cell lysis mediated by specific ligand‐activated Vα14 NKT cells. Proc Natl Acad Sci USA 1998; 95:5690–3. [DOI] [PMC free article] [PubMed] [Google Scholar]
- 28. Smyth MJ, Thia KY, Street SE, Cretney E, Trapani JA, Taniguchi M et al Differential tumor surveillance by natural killer [NK] and NKT cells. J Exp Med 2000; 191:661–8. [DOI] [PMC free article] [PubMed] [Google Scholar]
- 29. Nowak M, Arredouani MS, Tun‐Kyi A, Schmidt‐Wolf I, Sanda MG, Balk SP et al Defective NKT Cell Activation by CD1d+ TRAMP Prostate Tumor Cells Is Corrected by Interleukin‐12 with α‐Galactosylceramide. PLoS One 2010; 5:e11311. [DOI] [PMC free article] [PubMed] [Google Scholar]
Associated Data
This section collects any data citations, data availability statements, or supplementary materials included in this article.
Supplementary Materials
Figure S1 a) Flow cytometry of C57BL/6 wild‐type and CD1d‐LSL‐KrasG12D/+ animal spleen cells stained with CD1d antibody (green) or isotype control (blue). DNA gel electrophoresis image of genotyping of CD1d−/− and wild‐type (WT) animal.
Figure S2 Quantitative histograms for mPGES1, 5‐LOX staining and CD68 plus mPGES1 and CD68 plus 5‐LOX positive cells in pancreatic tumours.
Figure S3 (a) TCR‐β and Nk1.1 double‐positive natural killer T (NKT) cells in LSL‐KrasG12D/+ mice; (b) TCR‐β and Nk1.1 double‐positive NKT cells in LSL‐KrasG12D/+‐CD1d−/− mice; (c) TCR‐Vα24‐J α18 and Granzyme B double‐positive NKT cells in human pancreatic cancer tissue.
Appendix S1 Supplementary Materials and methods