

Abstract
For patients with head and neck squamous cell carcinoma (HNSCC), survival rates have not improved due to local recurrence and distant metastasis. Current targeted molecular therapies do not substantially benefit HNSCC patients. Therefore, it is necessary to use advanced genomic approaches to elucidate the molecular mechanisms underlying the aggressiveness of HNSCC cells. Analysis of our microRNA (miRNA) expression signature by RNA sequencing showed that the miR‐199 family (miR‐199a‐5p, miR‐199a‐3p, miR‐199b‐5p and miR‐199b‐3p) was significantly reduced in cancer tissues. Ectopic expression of mature miRNA demonstrated that all members of the miR‐199 family inhibited cancer cell migration and invasion by HNSCC cell lines (SAS and HSC3). These findings suggested that both passenger strands and guide strands of miRNA are involved in cancer pathogenesis. In silico database and genome‐wide gene expression analyses revealed that the gene coding for integrin α3 (ITGA3) was regulated by all members of the miR‐199 family in HNSCC cells. Knockdown of ITGA3 significantly inhibited cancer cell migration and invasion by HNSCC cells. Moreover, overexpression of ITGA3 was confirmed in HNSCC specimens, and high expression of ITGA3 predicted poorer survival of the patients (P = 0.0048). Our data revealed that both strands of pre‐miR‐199a (miR‐199a‐5p and miR‐199a‐3p) and pre‐miR‐199b (miR‐199b‐5p and miR‐199b‐3p) acted as anti‐tumor miRNA in HNSCC cells. Importantly, the involvement of passenger strand miRNA in the regulation of cellular processes is a novel concept in RNA research. Novel miRNA‐based approaches for HNSCC can be used to identify potential targets for the development of new therapeutic strategies.
Keywords: Anti‐tumor, head and neck squamous cell carcinoma, ITGA3, miR‐199a, miR‐199b
Head and neck squamous cell carcinoma (HNSCC) develops in the mucous membranes of the nasopharynx, oral cavity, oropharynx, larynx and hypopharynx.1 Due to local recurrence and distant metastasis, the 5‐year survival frequency of patients with HNSCC has not improved for 20 years.2, 3, 4, 5 Recently, new targeted therapeutics have been developed to inhibit oncogenic receptor‐mediated signaling, including that in HNSCC.6 However, these targeted therapies have offered few benefits in the management of patients with disease recurrence and distant metastasis.6, 7 Therefore, there is a need for new and effective treatment options based on genome‐wide RNA networks analyses.
MicroRNA (miRNA) belong to a family of small non‐cording RNA.8 miRNA fine‐tune the expression of protein coding/noncoding RNA by repressing translation or cleaving RNA transcripts in a sequence‐dependent manner.8, 9, 10 The discovery of miRNA has suggested new approaches to cancer therapeutics. A unique characteristic of miRNA is that a single miRNA regulates a large number of RNA transcripts in human cells.11, 12 Therefore, the presence of dysregulated miRNA can disturb entire RNA networks. Numerous studies have shown that miRNA are aberrantly expressed in several cancers, including HNSCC.12, 13, 14 These studies suggest new approaches to the analysis of networks regulating cancer.
We have used miRNA expression signatures to identify anti‐tumor miRNA that modulate novel cancer networks in HNSCC cells.15, 16, 17, 18 More recently, we have analyzed miRNA signatures of HNSCC constructed by RNA‐sequencing methods.19 These techniques are superior analytical methods for study of the transcriptome, and this strategy is leading to the discovery of novel dysregulated miRNA in cancer cells. Our signature showed that several miRNA passenger strands are aberrantly expressed in HNSCC.19 In miRNA biogenesis, it is believed that the passenger strand of miRNA is degraded and not incorporated into the RNA‐induced silencing complex (RISC) and has no functional role in cells.10, 20, 21
Our studies of miRNA signatures in HNSCC using RNA sequencing revealed that the miR‐199 family (miR‐199a‐5p, miR‐199a‐3p, miR‐199b‐5p and miR‐199b‐3p) was significantly reduced in cancer tissues. We hypothesized that both strands of pre‐miR‐199a (miR‐199a‐5p and miR‐199a‐3p) and pre‐miR‐199b (miR‐199b‐5p and miR‐199b‐3p) functioned as anti‐tumor miRNA targeting novel pathways. The aim of the present study was to investigate the functional significance of the miR‐199 family and the coordinately regulated oncogenic targets and pathways involved in HSCC pathogenesis. Elucidation of antitumor molecular networks modulated by the miR‐199 family in HNSCC cells may provide new insight into the mechanisms of the disease.
Materials and Methods
Clinical head and neck squamous cell carcinoma specimens, cell lines and RNA extraction
A total of 22 clinical tissue specimens were collected from patients with HNSCC who underwent surgical resection at Chiba University Hospital between 2008 and 2013. The patients’ backgrounds and clinicopathological characteristics are summarized in Table 1. All patients in this study provided informed consent and the study protocol was approved by the Institutional Review Board of Chiba University.
Table 1.
Clinical features of 22 patients with head and neck squamous cell carcinoma
| Number | Age | Sex | Location | T | N | M | Stage | Differentiation |
|---|---|---|---|---|---|---|---|---|
| 1 | 64 | F | Oral floor | 4a | 2c | 0 | IVA | Moderate |
| 2 | 73 | M | Tongue | 3 | 2b | 0 | IVA | Poor |
| 3 | 77 | M | Tongue | 2 | 2b | 0 | IVA | Poorly |
| 4 | 63 | F | Oral floor | 2 | 2b | 0 | IVA | Basaloid SCC |
| 5 | 59 | M | Tongue | 1 | 2a | 0 | IVA | Moderate |
| 6 | 36 | F | Tongue | 3 | 1 | 0 | III | Moderate |
| 7 | 67 | M | Tongue | 3 | 0 | 0 | III | Moderate |
| 8 | 60 | F | Tongue | 2 | I | 0 | III | Well |
| 9 | 66 | M | Tongue | 2 | 0 | 0 | II | Moderate |
| 10 | 67 | M | Tongue | 2 | 0 | 0 | II | Poor–moderate |
| 11 | 76 | F | Tongue | 1 | 0 | 0 | I | Well |
| 12 | 69 | M | Tongue | 1 | 0 | 0 | I | Well |
| 13 | 73 | F | Tongue | 1 | 0 | 0 | I | Well |
| 14 | 64 | M | Tongue | 1 | 0 | 0 | I | Well |
| 15 | 70 | M | Tongue | 1 | 0 | 0 | I | Well |
| 16 | 38 | M | Tongue | 1 | 0 | 0 | I | Well |
| 17 | 51 | M | Tongue | 1 | 0 | 0 | I | Well |
| 18 | 34 | F | Tongue | 1 | 0 | 0 | I | Poor |
| 19 | 70 | M | Tongue | 1 | 0 | 0 | I | Moderate |
| 20 | 71 | M | Tongue | 1 | 0 | 0 | I | Well |
| 21 | 82 | M | Oral floor | 1 | 0 | 0 | I | Well |
| 22 | 81 | M | Tongue | 1 | 0 | 0 | I | Extremely well |
Two human HNSCC cell lines, SAS and HSC3, were investigated in this study. Both cell lines were obtained from RIKEN Cell Bank (Tsukuba, Ibaraki, Japan).
Total RNA, including miRNA, was isolated using TRIzol reagent (Invitrogen, Carlsbad, CA, USA) according to the manufacturer's protocol.
Quantitative real‐time PCR
PCR quantification was carried out essentially as previously described.15, 16, 22 To quantify the expression level of miRNA, we utilized stem‐loop quantitative RT‐PCR (qRT‐PCR) for miR‐199a‐5p (assay ID: 000498; Applied Biosystems, Foster City, CA, USA), miR‐199b‐5p (assay ID: 000500, Applied Biosystems) and miR‐199‐3p (assay ID: 002304, Applied Biosystems) following the manufacturer's protocol. TaqMan probes and primers for Pri‐miR‐199a‐1 (Hs03302808_pri, Applied Biosystems), Pri‐miR‐199a‐2 (Hs03302922_pri, Applied Biosystems), Pri‐miR‐199b (Hs04227284_pri, Applied Biosystems) and ITGA3 (Hs01076873_m1, Applied Biosystems) were assay‐on‐demand gene expression products. mRNA and miRNA data were normalized to human GUSB (assay ID: Hs99999908_m1; Applied Biosystems) and RNU48 (assay ID: 001006; Applied Biosystems), respectively. The fold change was calculated using the delta–delta Ct method.
Preparation of a high purity fraction of miRNA based on an immunoprecipitation method
We investigated whether the passenger strand of miRNA was incorporated into RNA‐induced silencing complex (RISC). We used a miRNA Isolation Kit, Human Ago2 (Wako, Osaka, Japan) to prepare a high purity fraction of microRNA based on an immunoprecipitation method using a high affinity anti‐human Ago2 monoclonal antibody. The procedure was carried out according to the manufacturer's protocol.
Transfection of miRNA mimic, siRNA and plasmid vector into head and neck squamous cell carcinoma cell lines
Head and neck squamous cell carcinoma cell lines were transfected with miRNA mimics for gain‐of‐function experiments and siRNA for loss‐of‐function experiments. Pre‐miR miRNA Precursors (miR‐199a‐5p; P/N: PM10893, miR‐199b‐5p; P/N: PM10553, miR‐199‐3p; P/N: PM11779 and negative control miR; P/N: AM17111; Applied Biosystems) were used. The following siRNA were used: stealth select RNAi siRNA, si‐ITGA3 (P/N: HSS105531 and HSS179967; Invitrogen). For transfection, RNA were incubated with OPTIMEM (Invitrogen) and Lipofectamine RNAiMAX Reagent (Invitrogen) as in previous studies.15, 16, 22 Plasmid vectors were incubated with Opti‐MEM and Lipofectamine 3000 reagent (Invitrogen) by forward transfection following the manufacturer's protocol.23
Cell proliferation, migration and invasion assays
SAS and HSC3 cells were transfected with 10 nM miRNA or siRNA by reverse transfection. Cell proliferation, migration and invasion assays were carried out as previously described.15, 16, 22
Identification of genes putatively regulated by miR‐199a‐5p, miR‐199b‐5p and miR‐199a/b‐3p in head and neck squamous cell carcinoma cells
Genes specifically affected by miR‐199‐5p and miR‐199a/b‐3p were identified by a combination of in silico and genome‐wide gene expression analyses. Genes regulated by miR‐199‐5p and miR‐199a/b‐3p were listed using the TargetScan database (release 7.1). Genes upregulated in HNSCC were obtained from publicly available datasets in GEO (http://www.ncbi.nlm.nih.gov/geo/; accession number GSE9638). Our in silico analysis strategy behind this analysis procedure was described previously.15, 16, 22
Plasmid construction and dual‐luciferase reporter assays
The wide‐type or deletion‐type sequences of the 3′‐untranslated region (UTR) of ITGA3 in miR‐199a‐5p, miR‐199a/b‐3p and miR‐199b‐5p target sites were inserted in the psiCHECK‐2 vector (C8021; Promega, Madison, WI, USA). The vectors were provided by Dr H. Yoshino from Kagoshima University.24 The procedure for dual luciferase reporter assays was described previously.16, 22
Western blotting
Immunoblotting was performed with rabbit anti‐ITGA3 antibody (1:250, HPA008572; SIGMA‐ALDRICH, St. Louis, MO, USA), anti‐Akt antibody (1:1000, #4691; Cell Signaling Technology, Danvers, MA, USA), anti‐p‐Akt antibody (1:1000, #4060; Cell Signaling Technology), anti‐Erk1/2 antibody (1:1000, #4695; Cell Signaling Technology) and anti‐p‐Erk1/2 antibody (1:2000, #4370; Cell Signaling Technology), anti‐FAK antibody (1:1000, #3285; Cell Signaling Technology) and anti‐p‐FAK antibody (1:1000, #8556; Cell Signaling Technology). Anti‐GAPDH antibodies (1:1000, ab8245; Abcam, Cambridge, UK) were used as an internal control. The procedures were performed as described in our previous studies.15, 16, 22
The Cancer Genome Atlas database analysis of head and neck squamous cell carcinoma specimens
Head and neck squamous cell carcinoma specimens in the TCGA database (https://tcga-data.nci.nih.gov/tcga/) were divided into two groups (i.e. high and low expression of ITGA3). The groups were analyzed by Kaplan–Meier survival curves and log‐rank statistics by using OncoLnc (http://www.oncolnc.org).25 The genomic and clinical data were retrieved from cBioportal (http://www.cbioportal.org/), which were downloaded on 9 May 2017. Detailed information on the method is described in a previous paper.26
Statistical analysis
The statistical analysis was undertaken as described in previous studies.15, 16, 19, 22 All analyses were performed using Expert StatView (version 4; SAS Institute, Cary, NC, USA).
Results
Expression levels of miR‐199a‐1, miR‐199a‐2 and miR‐199b in head and neck squamous cell carcinoma clinical specimens and cell lines
We evaluated expression levels of miR‐199a‐1, miR‐199a‐2 and miR‐199b in HNSCC tissues (n = 22), normal epithelial tissues (n = 22) and two HNSCC cell lines (SAS and HSC3). Patient backgrounds and clinicopathological characteristics are summarized in Table 1. The stem‐loop sequences of miR‐199a‐1, miR‐199a‐2 and miR‐199b are described in Figure 1a.
Figure 1.
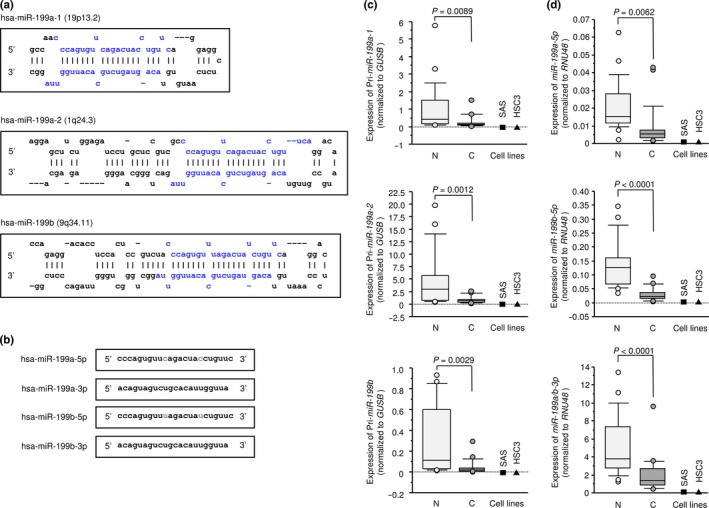
Sequences of the miR‐199 family and expression levels of miR‐199 in head and neck squamous cell carcinoma (HNSCC) clinical specimens. (a) Stem‐loop sequence of miR‐199a‐1, miR‐199a‐2 and miR‐199b, with blue characters indicating mature miRNA. (b) Mature miRNA sequences of the miR‐199 family, with red characters indicating variant nucleotides. (c) Expression levels of pri‐miR‐199a‐1, pri‐miR‐199a‐2 and pri‐miR‐199b in HNSCC clinical specimens and cell lines. GUSB was used as an internal control. (d) Expression levels of miR‐199a‐5p, miR‐199b‐5p and miR‐199a/b‐3p in HNSCC clinical specimens and cell lines. RNU48 was used as an internal control. C, cancer; N, normal tissue.
The expression levels of miR‐199a‐1, miR‐199a‐2 and miR‐199b were significantly lower in tumor tissues and HNSCC cell lines compared with normal epithelial tissues (P = 0.0089, P = 0.0012 and P = 0.0029, respectively; Fig. 1c).
Expression levels of miR‐199a‐5p, miR‐199b‐5p and miR‐199a/b‐3p in head and neck squamous cell carcinoma clinical specimens and cell lines
We evaluated expression levels of miR‐199a/b‐5p and miR‐199a/b‐3p in HNSCC tissues (n = 22), normal epithelial tissues (n = 22) and two HNSCC cell lines (SAS and HSC3). The miR‐199a‐5p sequence differs from the miR‐199b‐5p sequence by two nucleotides, and miR‐199a‐3p and miR‐199b‐3p have the same sequence (Fig. 1b).
The expression levels of miR‐199a‐5p, miR‐199b‐5p and miR‐199a/b‐3p were significantly lower in tumor tissues and HNSCC cell lines compared with normal epithelial tissues (P = 0.0062, P < 0.0001 and P < 0.0001, respectively; Fig. 1d).
Effects of miR‐199a‐5p, miR‐199b‐5p and miR‐199a/b‐3p expression on cell proliferation, migration and invasion in head and neck squamous cell carcinoma cell lines
XTT assays demonstrated that proliferation was not inhibited in miR‐199a‐5p, miR‐199b‐5p or miR‐199a/b‐3p transfectants in comparison with mock in SAS and HSC3 cells (Fig. 2a). In contrast, there was significant inhibition of cell migration activity after transfection with miR‐199a‐5p, miR‐199b‐5p or miR‐199a/b‐3p (*P < 0.0001; Fig. 2b). Phase micrographs of SAS and HSC3 cell lines in migration assays are shown in Figure 2d. Similarly, Matrigel invasion assays revealed that transfection with miR‐199a‐5p, miR‐199b‐5p or miR‐199a/b‐3p reduced cell invasion activities (*P < 0.0001; Fig. 2c). Phase micrographs of SAS and HSC3 cell lines in invasion assays are shown in Figure 2e.
Figure 2.
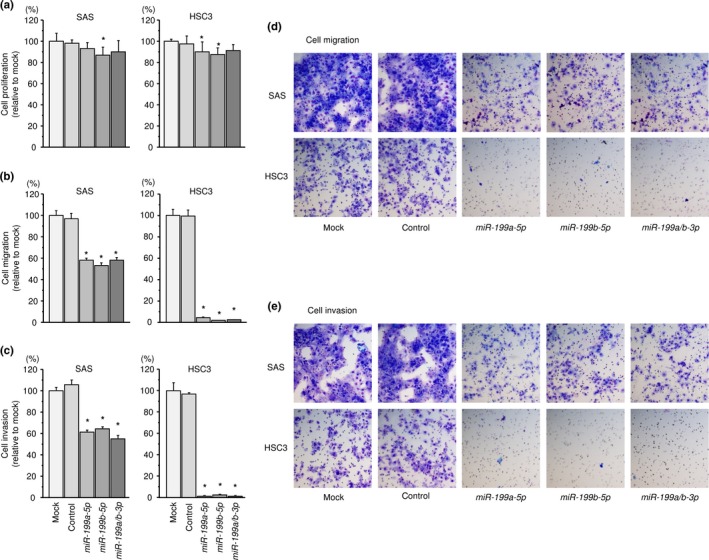
Functional significance of miR‐199a/b‐5p/‐3p in head and neck squamous cell carcinoma (HNSCC) cells. (a) Cell proliferation was determined by XTT assay 72 h after transfection with miR‐199a‐5p, miR‐199b‐5p or miR‐199a/b‐3p. *P < 0.05. (b) Cell movement was assessed by migration assays 48 h after transfection with miR‐199a‐5p, miR‐199b‐5p or miR‐199a/b‐3p. *P < 0.0001. (c) Characterization of cell invasive capacity 48 h after transfection with miR‐199a‐5p, miR‐199b‐5p or miR‐199a/b‐3p. *P < 0.0001. (d) Phase micrographs of SAS and HSC3 cell lines in migration assays. (e) Phase micrographs of SAS and HSC3 cell lines in invasion assays (100 × magnification field).
Incorporation of the miR‐199 family into RISC in SAS cells
To confirm that miR‐199 family members were actually functioning in cells, we used RT‐PCR to demonstrate that restored mature miRNA was incorporated into the RISC. The schema of this procedure is shown in Figure 3a. Expression of miR‐199a‐5p was significantly higher than that in cells transfected with mock, miR control, miR‐199b‐5p or miR‐199a/b‐3p (P < 0.0001; Fig. 3b). Likewise, expression of miR‐199b‐5p was significantly higher than that in cells transfected with mock, miR control, miR‐199a‐5p or miR‐199a/b‐3p (P < 0.0001; Fig. 3b). Expression of miR‐199a/b‐3p was significantly higher than that in cells transfected with mock or miR control, miR‐199a‐5p or miR‐199b‐5p (P < 0.0001; Figure 3b).
Figure 3.
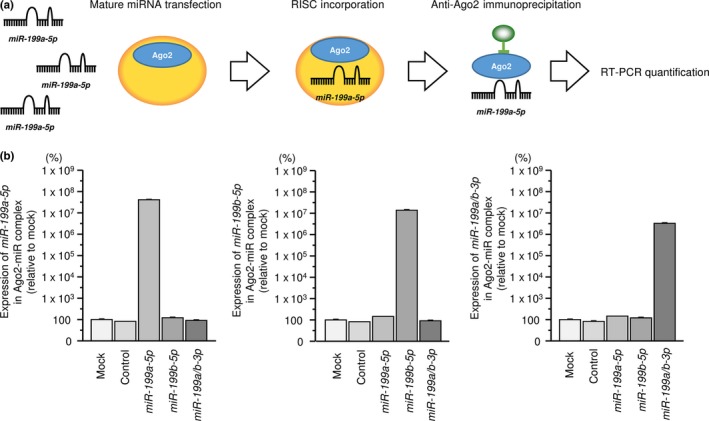
Incorporation of the miR‐199 family into the RNA‐induced silencing complex (RISC) in SAS cells. (a) Mature microRNA was transfected into SAS cells, and it was incorporated into the RISC. The incorporated microRNA was prepared to high purity using immunoprecipitation with anti‐human Ago2 monoclonal antibody. Expression of the microRNA was quantified with RT‐PCR. (b) Expression of miR‐199a‐5p was significantly higher than that in cells transfected with mock, miR control, miR‐199b‐5p or miR‐199a/b‐3p (P < 0.0001). Likewise, expression of miR‐199b‐5p was significantly higher than that in cells transfected with mock, miR control, miR‐199a‐5p or miR‐199a/b‐3p (P < 0.0001). Expression of miR‐199a/b‐3p was significantly higher than that in cells transfected with mock, miR control, miR‐199a‐5p or miR‐199b‐5p (P < 0.0001).
Identification of target genes coordinately regulated by the miR‐199 family in head and neck squamous cell carcinoma cells
To identify target genes coordinately regulated by miR‐199‐5p and miR‐199‐3p, we combined several in silico analyses. Our strategy for selection of those genes is shown in Figure 4.
Figure 4.
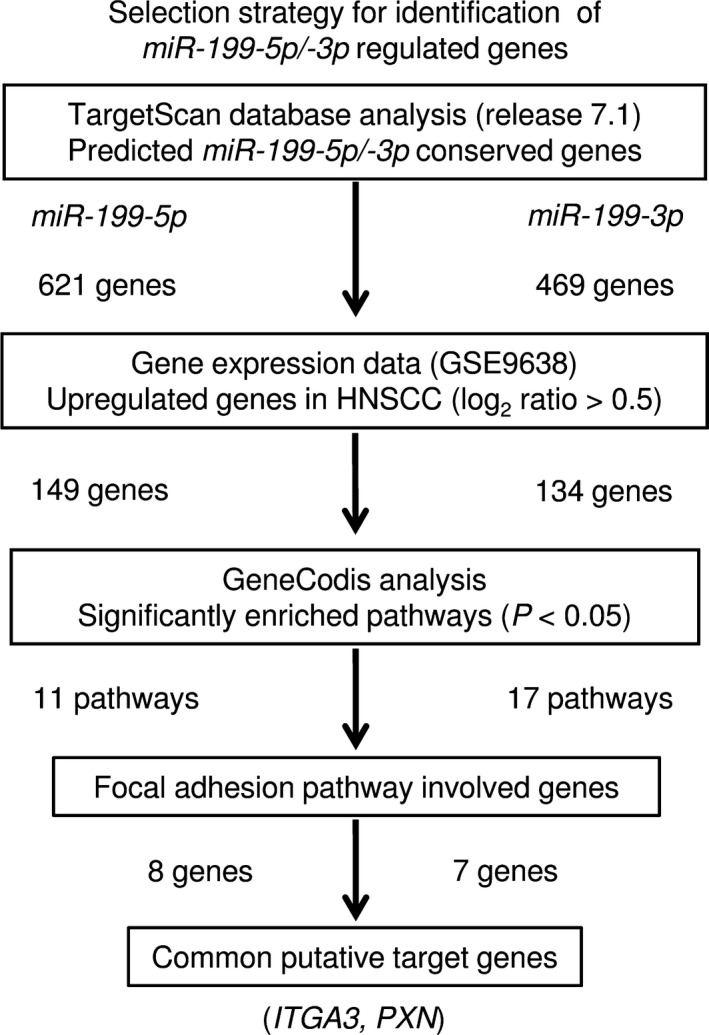
Flow chart depicting the strategy for identification of miR‐199‐5p and miR‐199‐3p target genes. Analysis using the TargetScan database showed that 621 and 469 genes had putative target sites for miR‐199‐5p/‐3p, respectively, in their 3′‐UTR. Then, we assessed the expression levels of those genes using the GEO database (GSE9638). Finally, we categorized these putative target genes into KEGG pathways using the GeneCodis database, and 11 and 17 pathways were identified. Among these pathways, we focused on the “focal adhesion pathway” because miR‐199‐5p/‐3p markedly inhibited cancer cell migration and invasion. The data showed that two genes (ITGA3 and PXN) were regulated by both miR‐199‐5p/‐3p.
The TargetScan database (release 7.1) showed that 621 and 469 genes have putative target sites for miR‐199‐5p and miR‐199‐3p, respectively, in their 3′‐UTR. First, to evaluate upregulated genes in clinical HNSCC specimens, we examined gene expression profiles in the GEO database (accession number GSE9638). A total of 149 and 134 genes were identified as putative target genes for miR‐199‐5p and miR‐199‐3p, respectively, in HNSCC cells.
Next, we categorized these putative target genes by reference to the Kyoto Encyclopedia of Genes and Genomes (KEGG) pathways using the GeneCodis database, and 11 and 17 pathways were identified as significantly enriched pathways (Tables 2 and 3). Among these, we focused on the “focal adhesion pathway” because miR‐199‐5p and miR‐199‐3p markedly inhibited cancer cell migration and invasion (Fig. 2b,c). Two genes (ITGA3 and PXN) were regulated by both miR‐199‐5p and miR‐199‐3p (Tables 4 and 5). We focused on ITGA3 because according to our previous studies, aberrant integrin‐mediated signaling promoted cancer cell aggressiveness.23, 27, 28
Table 2.
Significantly enriched annotations regulated by miR‐199‐5p
| Number of genes | P‐value | Annotations |
|---|---|---|
| 8 | 9.2E‐05 | (KEGG) 04510: Focal adhesion |
| 5 | 1.0E‐04 | (KEGG) 05217: Basal cell carcinoma |
| 10 | 1.2E‐04 | (KEGG) 05200: Pathways in cancer |
| 6 | 9.2E‐04 | (KEGG) 04310: Wnt signaling pathway |
| 4 | 1.6E‐03 | (KEGG) 04340: Hedgehog signaling pathway |
| 6 | 3.9E‐03 | (KEGG) 04810: Regulation of actin cytoskeleton |
| 4 | 4.7E‐03 | (KEGG) 05222: Small cell lung cancer |
| 4 | 4.7E‐03 | (KEGG) 04512: ECM–receptor interaction |
| 4 | 6.7E‐03 | (KEGG) 04916: Melanogenesis |
| 3 | 6.8E‐03 | (KEGG) 02010: ABC transporters |
| 3 | 2.8E‐02 | (KEGG) 05412: Arrhythmogenic right ventricular cardiomyopathy |
Table 3.
Significantly enriched annotations regulated by miR‐199‐3p
| Number of genes | P‐value | Annotations |
|---|---|---|
| 7 | 3.8E‐06 | (KEGG) 04512: ECM–receptor interaction |
| 8 | 8.0E‐05 | (KEGG) 04810: Regulation of actin cytoskeleton |
| 7 | 3.9E‐04 | (KEGG) 04510: Focal adhesion |
| 5 | 6.1E‐04 | (KEGG) 05414: Dilated cardiomyopathy |
| 4 | 3.6E‐03 | (KEGG) 05412: Arrhythmogenic right ventricular cardiomyopathy |
| 4 | 3.9E‐03 | (KEGG) 05222: Small cell lung cancer |
| 4 | 4.0E‐03 | (KEGG) 05410: Hypertrophic cardiomyopathy (HCM) |
| 7 | 4.5E‐03 | (KEGG) 05200: Pathways in cancer |
| 4 | 7.1E‐03 | (KEGG) 05146: Amoebiasis |
| 3 | 2.2E‐02 | (KEGG) 04971: Gastric acid secretion |
| 3 | 2.2E‐02 | (KEGG) 05100: Bacterial invasion of epithelial cells |
| 3 | 2.3E‐02 | (KEGG) 04730: Long‐term depression |
| 3 | 3.0E‐02 | (KEGG) 04970: Salivary secretion |
| 3 | 3.0E‐02 | (KEGG) 04640: Hematopoietic cell lineage |
| 3 | 3.1E‐02 | (KEGG) 04540: Gap junction |
| 3 | 3.7E‐02 | (KEGG) 04912: GnRH signaling pathway |
| 3 | 3.7E‐02 | (KEGG) 04972: Pancreatic secretion |
Table 4.
Focal adhesion pathway regulated by miR‐199‐5p
| Gene symbol | Gene name | Conserved | Poorly conserved | GEO9638 log2 ratio |
|---|---|---|---|---|
| COL5A3 | Collagen, type V, alpha 3 | 1 | 0 | 1.373 |
| PPP1R12A | Protein phosphatase 1, regulatory (inhibitor) subunit 12A | 1 | 0 | 0.797 |
| PXN | Paxillin | 1 | 0 | 0.774 |
| LAMC1 | Laminin, gamma 1 (formerly LAMB2) | 1 | 0 | 0.657 |
| VEGFA | Vascular endothelial growth factor A | 1 | 0 | 0.653 |
| ITGA4 | Integrin, alpha 4 (antigen CD49D, alpha 4 subunit of VLA‐4 receptor) | 1 | 0 | 0.618 |
| GSK3B | Glycogen synthase kinase 3 beta | 2 | 0 | 0.606 |
| ITGA3 | Integrin, alpha 3 (antigen CD49C, alpha 3 subunit of VLA‐3 receptor) | 1 | 3 | 0.583 |
Table 5.
Focal adhesion pathway regulated by miR‐199‐3p
| Gene symbol | Gene name | Conserved | Poorly conserved | GEO9638 log2 ratio |
|---|---|---|---|---|
| FN1 | Fibronectin 1 | 1 | 1 | 1.831 |
| COL4A5 | Collagen, type IV, alpha 5 | 1 | 1 | 1.364 |
| ITGA1 | Integrin, alpha 1 | 3 | 2 | 1.249 |
| ITGA6 | Integrin, alpha 6 | 1 | 0 | 1.105 |
| PXN | Paxillin | 1 | 0 | 0.774 |
| ITGB8 | Integrin, beta 8 | 2 | 0 | 0.697 |
| ITGA3 | Integrin, alpha 3 (antigen CD49C, alpha 3 subunit of VLA‐3 receptor) | 1 | 0 | 0.583 |
miR‐199‐5p and miR‐199‐3p controlled the expression of ITGA3 in head and neck squamous cell carcinoma cells
We assessed the Kaplan–Meier univariate survival of patient groups using a TCGA database, comparing those with a high expression level of ITGA3 and those with a low expression level of ITGA3. Figure 5a shows that the ITGA3 high expression group had a significantly poorer overall survival rate (P = 0.0048). Moreover, high expression of ITGA3 was associated with disease‐free survival (P = 0.0338) (Fig. 5a). Multivariate Cox proportional hazards models were used to assess independent predictors of progression‐free survival, including the expression level of the gene (Z score > 0 vs Z score ≤ 0), tumor stage (T3 and T4 vs T1 and T2), lymph node stage (N+ vs N−), age at diagnosis (>60 years vs ≤60 years), histologic grade (G3 and G4 vs G1 and G2) and sex (male vs female). High ITGA3 expression was a significant prognostic factor in patients with HNSCC (hazard ratio [HR] = 1.48, 95% confidence interval [CI] = 1.08–2.04, P = 0.015; Table 6).
Figure 5.
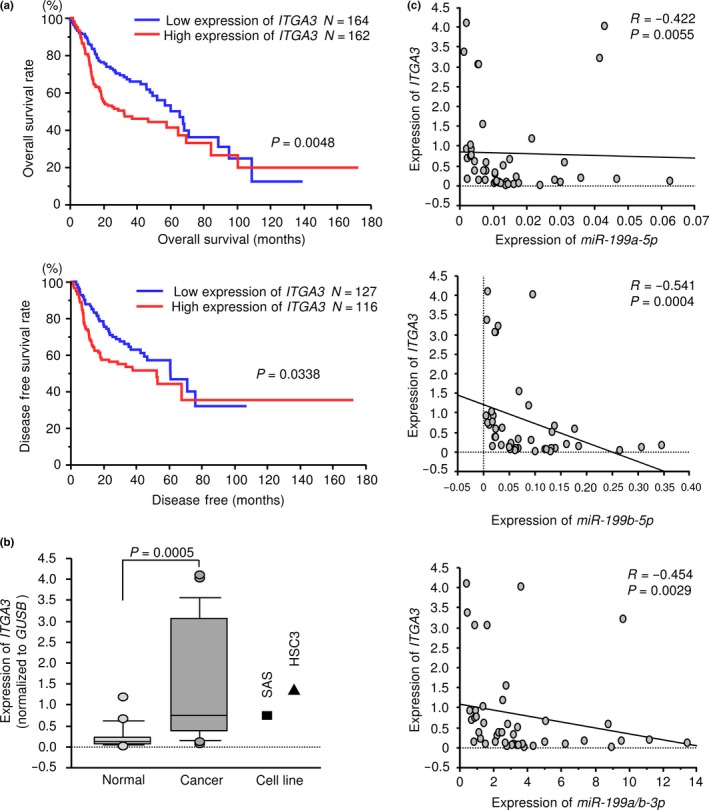
Regulation of target gene expression by miR‐199‐5p and miR‐199‐3p in head and neck squamous cell carcinoma (HNSCC) clinical specimens and HNSCC cell lines. (a) Kaplan–Meier survival curves, as determined using data from the TCGA database. (b) Expression levels of ITGA3 in HNSCC clinical specimens and cell lines. GUSB was used as an internal control. (c) The negative correlations between ITGA3 expression and the expression of miR‐199a/b‐5p/3p. Spearman's rank test was used to evaluate the correlation.
Table 6.
Hazard ratio and 95% CI of each subgroup in TCGA database
| Factor | HR | 95% CI | P‐value |
|---|---|---|---|
| ITGA3 expression (Z > 0 vs Z <=0) | 1.48 | 1.08–2.04 | 0.015 |
| T stage (T3&4 vs T1&2) | 2.06 | 1.42–3.09 | <0.0001 |
| N stage (N+ vs N−) | 1.92 | 1.37–2.73 | <0.0001 |
| Histologic grade (G3&4 vs G1&2) | 0.95 | 0.66–1.35 | 0.796 |
| Age (>60 vs <=60) | 1.19 | 0.86–1.65 | 0.295 |
| Gender (male vs female) | 0.78 | 0.55–1.11 | 0.162 |
We investigated the mRNA expression levels of ITGA3 in 22 HNSCC clinical specimens by qRT‐PCR. ITGA3 was significantly upregulated in HNSCC tumor tissues (P = 0.0005; Fig. 5b). Spearman's rank test showed a negative correlation between the expression of ITGA3 and miR‐199a‐5p (P = 0.0055, R = −0.422; Fig. 5c), the expression of ITGA3 and miR‐199b‐5p (P = 0.0004, R = −0.541; Fig. 5c) and the expression of ITGA3 and miR‐199a/b‐3p (P = 0.0029, R = −0.454; Fig. 5c).
ITGA3 was directly regulated by miR‐199 family in head and neck squamous cell carcinoma cells
We also investigated whether ITGA3 expression was reduced by restoration of miR‐199a‐5p, miR‐199b‐5p and miR‐199a/b‐3p in HNSCC cells. The expression levels of ITGA3 mRNA and protein were significantly repressed in miR‐199a‐5p, miR‐199b‐5p and miR‐199a/b‐3p transfectants compared with mock cells (Fig. 6a,b).
Figure 6.
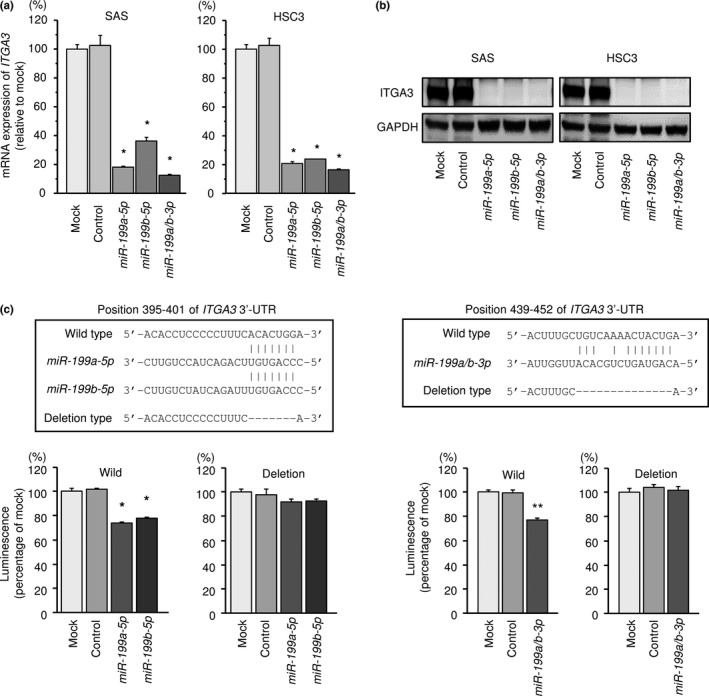
Direct regulation of ITGA3 by miR‐199 family in head and neck squamous cell carcinoma (HNSCC) cells. (a) Expression levels of ITGA3 mRNA 72 h after transfection with 10 nM miR‐199a‐5p, miR‐199b‐5p or miR‐199a/b‐3p into cell lines. GUSB was used as an internal control. *P < 0.0001. (b) Protein expression of ITGA3 72 h after transfection with miR‐199a‐5p, miR‐199b‐5p or miR‐199a/b‐3p. GAPDH was used as a loading control. (c) miR‐199 family binding sites in the 3′‐UTR of ITGA3 mRNA. Dual luciferase reporter assays using vectors encoding putative miR‐199 family target sites of the ITGA3 3′ UTR (positions 395–401 and 439–452) for wild type and deletion type. Normalized data were calculated as ratios of Renilla/firefly luciferase activities. *P < 0.0001, **P < 0.05.
We performed dual‐luciferase reporter assays in SAS cells to determine whether the ITGA3 was directly regulated by miR‐199a‐5p, miR‐199a/b‐3p and miR‐199b‐5p. Seed sequences of miR‐199a‐5p and miR‐199b‐5p are identical. We used vectors encoding the partial wild‐type or deletion‐type sequences of the 3′‐UTR of the ITGA3 with miR‐199 family target sites. We detected that the luminescence intensities were significantly reduced by co‐transfection with miR‐199a‐5p, miR‐199a/b‐3p and miR‐199b‐5p the vectors carrying the wild type (Fig. 6c). In contrast, transfection with the deletion‐type vector blocked the reduction of luminescence intensities (Fig. 6c). These findings indicated that miR‐199 family directly bound specific sites in the 3′‐UTR of ITGA3.
Effects of ITGA3 knockdown on cell proliferation, migration and invasion in head and neck squamous cell carcinoma cells
First, we evaluated the knockdown efficiency of si‐ITGA3 transfection in SAS and HSC3 cell lines. qRT‐PCR data and western blotting indicated that the siRNA effectively downregulated ITGA3 expression (Fig. 7a,b).
Figure 7.
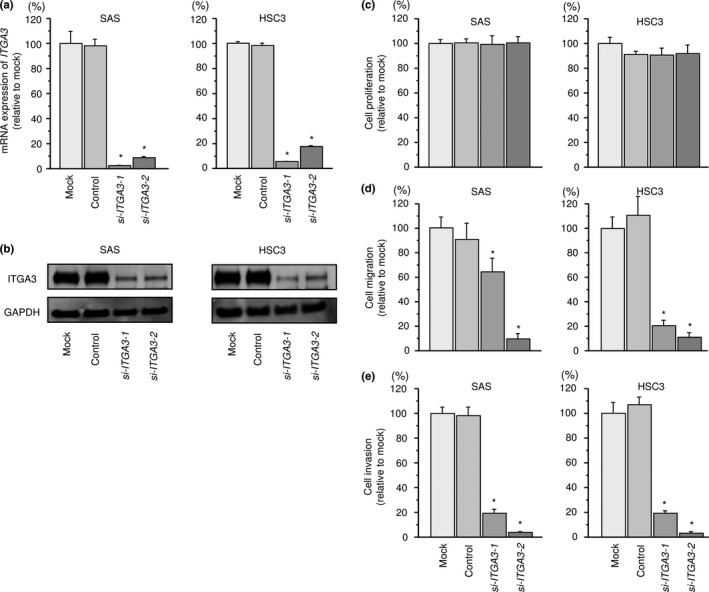
Effects of ITGA3 silencing by siRNA transfection in head and neck squamous cell carcinoma (HNSCC) cells. (a) ITGA3 mRNA expression 72 h after transfection of 10 nM siRNA into HNSCC cells. GUSB was used as an internal control. *P < 0.0001. (b) ITGA3 protein expression 72 h after transfection with siRNA. GAPDH was used as a loading control. (c) Cell proliferation was determined by XTT assay 72 h after transfection with siRNA. (d) Cell movement was assessed by migration assay 48 h after transfection with siRNA. *P < 0.0001. (e) Characterization of invasion 48 h after transfection with siRNA. *P < 0.0001.
XTT assays demonstrated that SAS and HSC3 cell proliferation was not inhibited by si‐ITGA3 transfection compared with mock (Fig. 7c). In contrast, migration of SAS and HSC3 cell lines was significantly inhibited in si‐ITGA3 transfectants in comparison with mock (Fig. 7d). We also found that the invasion activities of SAS and HSC3 cells were significantly inhibited after si‐ITGA3 transfection in comparison with mock transfection (Fig. 7e).
Effects of co‐transfection of ITGA3/miR‐199s in SAS cells
To validate whether the ITGA3/miR‐199 family axis was critical for the progression of HNSCC, we performed ITGA3 rescue experiments by co‐transfection with ITGA3 and the miR‐199 family in SAS cells (Fig. S1). The results showed that the migration and invasion abilities of SAS cells were recovered by ITGA3 and miR‐199 family transfection compared with cells that restored each miR‐199 family only (Fig. 8). These findings suggested that ITGA3 was involved in cancer cell migration and invasion in HNSCC cells.
Figure 8.
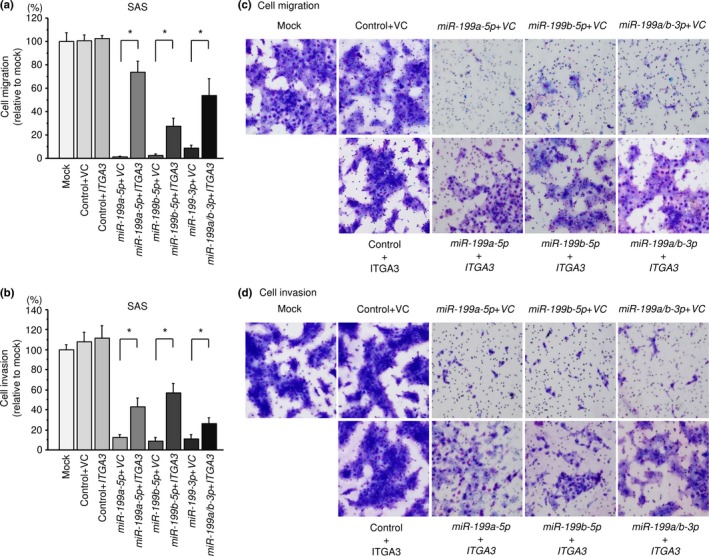
Effects of co‐transfection of ITGA3/miR‐199 family in SAS cells. (a) Cell migration activity was assessed by wound‐healing assays 48 h after reverse transfection with miR‐199 family and 24 h after forward transfection with the ITGA3 vector. *P < 0.0001. (b) Cell invasion activity was characterized by invasion assays 48 h after reverse transfection with miR‐199 family and 48 h after forward transfection with ITGA3 vector. *P < 0.0001. (c,d) Phase micrographs of SAS cell line in migration and invasion assays (100 × magnification field).
Effects of ITGA3 knockdown on downstream signaling
We analyzed the effects of downstream oncogenic signaling of ITGA3 by using siRNA transfection of SAS cells. The phosphorylation status of AKT (Ser 473), ERK1/2 (Thr 202/Tyr 204) and FAK (Tyr 397) was examined. Knockdown of ITGA3 reduced the phosphorylation of AKT, ERK1/2 and FAK in SAS cells (Fig. 9).
Figure 9.
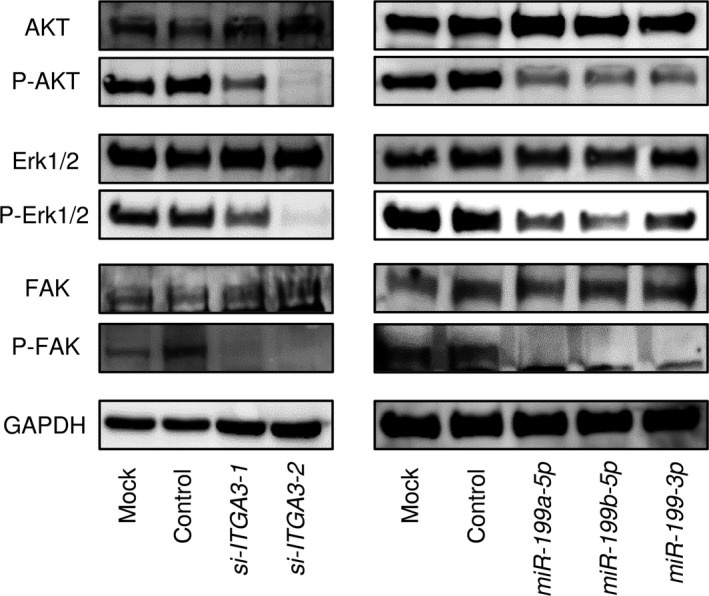
Effects of the gene encoding ITGA3 protein on downstream signaling. (a) Knockdown of ITGA3 and (b) restoration of miR‐199 family in SAS cells reduced the phosphorylation of AKT, Erk1/2 and FAK. GAPDH was used as a loading control.
We also investigated whether the expression of miR‐199 family (miR‐199a‐5p, miR‐199a/b‐3p and miR‐199b‐5p) affected downstream signaling. Restoration of miR‐199 family reduced phosphorylation of AKT, ERK1/2 and FAK in SAS cells (Fig. 9).
Discussion
New therapeutic strategies are needed to improve the poor prognosis of HNSCC patients with metastasis. To achieve that goal, novel regulatory networks that promote HNSCC cellular metastasis must be identified and targeted. Towards that end, we have identified anti‐tumor miRNA‐modulated pathways that promote the aggressive behavior of various cancer cells, including HNSCC cells.15, 16, 17, 18, 22, 29, 30, 31, 32, 33, 34Our past studies showed that anti‐tumor miRNA, including miR‐26a/b, miR‐29a/b/c and miR‐218, concertedly regulated the lysyl oxidase‐like 2 (LOXL2) gene in cancer cells.29, 30, 31, 32, 33, 34 The basic function of LOXL2 is covalent crosslinking of collagen and/or elastin in the extracellular matrix (ECM).35 Overexpression of LOXL2 was correlated with disease progression of several cancers and induced the epithelial–mesenchymal transition (EMT) by interaction with transcription factor SNAIL1.36 Our miRNA‐based strategy can efficiently identify novel molecular pathways involved in cancer pathogenesis.
More recently, we have analysed the miRNA signature of HNSCC clinical specimens by using RNA‐sequencing technology.19 Our signature revealed that several passenger strands of miRNA, such as miR‐143‐3p, miR‐145‐3p and miR‐150‐3p, were downregulated in HNSCC tissues.19 In general, passenger strands of miRNA are degraded without incorporation into the RISC.10, 20, 21 In contrast, our signatures indicate that some passenger strands of miRNA function in cancer cells. We recently showed that passenger strands of certain miRNA (miR‐144‐5p, miR‐145‐3p and miR‐139‐3p) acted as anti‐tumor miRNA through their targeting of several oncogenic genes.37, 38, 39, 40 Our results have changed the concept of miRNA biogenesis and the role of passenger strands, opening up new approaches in miRNA research.
In this study, we focused on the miR‐199 family (miR‐199a‐5p, miR‐199a‐3p, miR‐199b‐5p and miR‐199b‐3p) because all members of the family were significantly reduced in our RNA sequencing‐based miRNA signature of HNSCC. We hypothesized that dual strands of pre‐miR‐199a and pre‐miR‐199b acted as anti‐tumor miRNA and were involved in HNSCC pathogenesis. Our functional assays showed that ectopic expression of all members of the miR‐199 family inhibited cancer cell aggressiveness, indicating that the family acted as anti‐tumor miRNA in HNSCC cells. The anti‐tumor function of miR‐199a‐5p was reported in several types of cancers.41, 42, 43 With regard to miR‐199a‐5p, recent data showed that miR‐199a‐3p was downregulated in osteosarcoma and that restoration of miR‐199a‐3p significantly inhibited CD44 expression.44 In prostate cancer, miR‐199a‐3p contributed to tumorigenic cancer stem cells through its targeting of CD44, c‐MYC, CCND1 and EGFR.45 Several studies suggested that downregulated miR‐199b‐5p was involved in progression and metastasis in several cancers.46, 47 Our present data describing the antitumor functions of the miR‐199 family in HNSCC cells are consistent with past studies.
To elucidate the contributions of the miR‐199 family to HNSCC pathogenesis, we analyzed the molecular networks that it regulated. We identified 2 putative targets in HNSCC cells that were modulated by the miR‐199 family, ITGA3 and PXN. Here, we focused on the ITGA3 gene because our previous studies indicated that dysregulated ECM and integrin‐meditated oncogenic signaling enhanced cancer cell migration and invasion.23 Our present data demonstrated that all members of the miR‐199 family regulated ITGA3 in HNSCC cells. Moreover, knockdown of ITGA3 inhibited cancer cell aggressiveness through regulating downstream oncogenic signaling. Integrin α3β1 is abundant in human tissues and its aberrant expression has been implicated in the development and progression of cancer.23, 48, 49 Several studies demonstrated that overexpression of integrin α3β1 contributed to cancer cell invasion. Moreover, overexpression was positively correlated with poor prognosis of the patients.50
A large cohort study using data from the TCGA database indicated that high expression of ITGA3 predicted poorer survival of HNSCC patients. Interestingly, Kaplan–Meier survival curves showed that high expression of ITGB1 predicted poorer survival in patients with HNSCC. These findings indicate that overexpression of integrin α3β1 could be deeply involved in HNSCC pathogenesis. Recent studies demonstrated that TGF‐β stimulates the expression of integrin α3β1 by transcriptional upregulation through the Ets transcription factor.51 Moreover, activation of α3β1‐mediated signaling upregulated several oncogenic gene expression and enhanced metastatic phenotypes.50, 52 Therefore, it is important to better understand integrin α3β1‐mediated gene regulation in normal cells as well as in cancer cells.
Disclosure Statement
The authors have no conflicts of interest to declare.
Supporting information
Fig. S1. (a) ITGA3 protein expression levels were measured by western blot after 24 h ITGA3‐expression vector transfection on SAS cells. GAPDH was used as a loading control. (b) ITGA3 protein expression levels were measured by western blot 48 h after reverse transfection with miR‐199 family and 24 h after forward transfection with the vector control (VC) and ITGA3 vector on SAS cells. GAPDH was used as a loading control. (c) Cell proliferation was determined using XTT assays 48 h after reverse transfection with miR‐199 family and 24 h after forward transfection with the vector control (VC) and ITGA3 vector. **P = 0.004
Acknowledgments
This study was supported by JSPS KAKENHI, 16K20229, 15K10801, 25462676 and 26462596.
Cancer Sci 108 (2017) 1681–1692
Funding Information
JSPS KAKENHI, 16K20229, 15K10801, 25462676 and 26462596
References
- 1. Leemans CR, Braakhuis BJ, Brakenhoff RH. The molecular biology of head and neck cancer. Nat Rev Cancer 2011; 11: 9–22. [DOI] [PubMed] [Google Scholar]
- 2. Massano J, Regateiro FS, Januario G, Ferreira A. Oral squamous cell carcinoma: Review of prognostic and predictive factors. Oral Surg Oral Med Oral Pathol Oral Radiol Endod 2006; 102: 67–76. [DOI] [PubMed] [Google Scholar]
- 3. Bhattacharya A, Roy R, Snijders AM et al Two distinct routes to oral cancer differing in genome instability and risk for cervical node metastasis. Clin Cancer Res 2011; 17: 7024–34. [DOI] [PMC free article] [PubMed] [Google Scholar]
- 4. Wikner J, Grobe A, Pantel K, Riethdorf S. Squamous cell carcinoma of the oral cavity and circulating tumour cells. World J Clin Oncol 2014; 5: 114–24. [DOI] [PMC free article] [PubMed] [Google Scholar]
- 5. Siegel RL, Miller KD, Jemal A. Cancer statistics, 2016. CA Cancer J Clin 2016; 66: 7–30. [DOI] [PubMed] [Google Scholar]
- 6. Bonner JA, Harari PM, Giralt J et al Radiotherapy plus cetuximab for squamous‐cell carcinoma of the head and neck. N Engl J Med 2006; 354: 567–78. [DOI] [PubMed] [Google Scholar]
- 7. Bonner JA, Harari PM, Giralt J et al Radiotherapy plus cetuximab for locoregionally advanced head and neck cancer: 5‐year survival data from a phase 3 randomised trial, and relation between cetuximab‐induced rash and survival. Lancet Oncol 2010; 11: 21–8. [DOI] [PubMed] [Google Scholar]
- 8. Bartel DP. MicroRNAs: Genomics, biogenesis, mechanism, and function. Cell 2004; 116: 281–97. [DOI] [PubMed] [Google Scholar]
- 9. Lewis BP, Burge CB, Bartel DP. Conserved seed pairing, often flanked by adenosines, indicates that thousands of human genes are microRNA targets. Cell 2005; 120: 15–20. [DOI] [PubMed] [Google Scholar]
- 10. Bartel DP. MicroRNAs: Rarget recognition and regulatory functions. Cell 2009; 136: 215–33. [DOI] [PMC free article] [PubMed] [Google Scholar]
- 11. Iorio MV, Croce CM. MicroRNAs in cancer: Small molecules with a huge impact. J Clin Oncol 2009; 27: 5848–56. [DOI] [PMC free article] [PubMed] [Google Scholar]
- 12. Wiemer EA. The role of microRNAs in cancer: No small matter. Eur J Cancer 2007; 43: 1529–44. [DOI] [PubMed] [Google Scholar]
- 13. Sethi N, Wright A, Wood H, Rabbitts P. MicroRNAs and head and neck cancer: Reviewing the first decade of research. Eur J Cancer 2014; 50: 2619–35. [DOI] [PubMed] [Google Scholar]
- 14. Tran N, O'Brien CJ, Clark J, Rose B. Potential role of micro‐RNAs in head and neck tumorigenesis. Head Neck 2010; 32: 1099–111. [DOI] [PubMed] [Google Scholar]
- 15. Fukumoto I, Kinoshita T, Hanazawa T et al Identification of tumour suppressive microRNA‐451a in hypopharyngeal squamous cell carcinoma based on microRNA expression signature. Br J Cancer 2014; 111: 386–94. [DOI] [PMC free article] [PubMed] [Google Scholar]
- 16. Fukumoto I, Hanazawa T, Kinoshita T et al MicroRNA expression signature of oral squamous cell carcinoma: Functional role of microRNA‐26a/b in the modulation of novel cancer pathways. Br J Cancer 2015; 112: 891–900. [DOI] [PMC free article] [PubMed] [Google Scholar]
- 17. Kikkawa N, Hanazawa T, Fujimura L et al miR‐489 is a tumour‐suppressive miRNA target PTPN11 in hypopharyngeal squamous cell carcinoma (HSCC). Br J Cancer 2010; 103: 877–84. [DOI] [PMC free article] [PubMed] [Google Scholar]
- 18. Nohata N, Hanazawa T, Kikkawa N et al Tumour suppressive microRNA‐874 regulates novel cancer networks in maxillary sinus squamous cell carcinoma. Br J Cancer 2011; 105: 833–41. [DOI] [PMC free article] [PubMed] [Google Scholar]
- 19. Koshizuka K, Nohata N, Hanazawa T et al Deep sequencing‐based microRNA expression signatures in head and neck squamous cell carcinoma: Dual strands of pre‐miR‐150 as antitumor miRNAs. Oncotarget 2017; 8: 30288–304. [DOI] [PMC free article] [PubMed] [Google Scholar]
- 20. Chendrimada TP, Gregory RI, Kumaraswamy E et al TRBP recruits the Dicer complex to Ago2 for microRNA processing and gene silencing. Nature 2005; 436: 740–4. [DOI] [PMC free article] [PubMed] [Google Scholar]
- 21. Hutvagner G, Zamore PD. A microRNA in a multiple‐turnover RNAi enzyme complex. Science (New York, NY) 2002; 297: 2056–60. [DOI] [PubMed] [Google Scholar]
- 22. Koshizuka K, Hanazawa T, Fukumoto I et al Dual‐receptor (EGFR and c‐MET) inhibition by tumor‐suppressive miR‐1 and miR‐206 in head and neck squamous cell carcinoma. J Hum Genet 2017; 62: 113–21. [DOI] [PubMed] [Google Scholar]
- 23. Kurozumi A, Goto Y, Matsushita R et al Tumor‐suppressive microRNA‐223 inhibits cancer cell migration and invasion by targeting ITGA3/ITGB1 signaling in prostate cancer. Cancer Sci 2016; 107: 84–94. [DOI] [PMC free article] [PubMed] [Google Scholar]
- 24. Sakaguchi T, Yoshino H, Yonemori M et al Regulation of ITGA3 by the dual‐stranded microRNA‐199 family as a potential prognostic marker in bladder cancer. Br J Cancer 2017; 116: 1077–87. [DOI] [PMC free article] [PubMed] [Google Scholar]
- 25. Anaya J. OncoLnc: linking TCGA survival data to mRNAs, miRNAs, and lncRNAs. PeerJ CompSci 2016; 2: e67. [Google Scholar]
- 26. Gao J, Aksoy BA, Dogrusoz U et al Integrative analysis of complex cancer genomics and clinical profiles using the cBioPortal. Sci Signal 2013; 6: pl1. [DOI] [PMC free article] [PubMed] [Google Scholar]
- 27. Kinoshita T, Hanazawa T, Nohata N et al Tumor suppressive microRNA‐218 inhibits cancer cell migration and invasion through targeting laminin‐332 in head and neck squamous cell carcinoma. Oncotarget 2012; 3: 1386–400. [DOI] [PMC free article] [PubMed] [Google Scholar]
- 28. Kinoshita T, Nohata N, Hanazawa T et al Tumour‐suppressive microRNA‐29s inhibit cancer cell migration and invasion by targeting laminin‐integrin signalling in head and neck squamous cell carcinoma. Br J Cancer 2013; 109: 2636–45. [DOI] [PMC free article] [PubMed] [Google Scholar]
- 29. Nishikawa R, Chiyomaru T, Enokida H et al Tumour‐suppressive microRNA‐29s directly regulate LOXL2 expression and inhibit cancer cell migration and invasion in renal cell carcinoma. FEBS Lett 2015; 589: 2136–45. [DOI] [PubMed] [Google Scholar]
- 30. Mizuno K, Seki N, Mataki H et al Tumor‐suppressive microRNA‐29 family inhibits cancer cell migration and invasion directly targeting LOXL2 in lung squamous cell carcinoma. Int J Oncol 2016; 48: 450–60. [DOI] [PMC free article] [PubMed] [Google Scholar]
- 31. Kurozumi A, Kato M, Goto Y et al Regulation of the collagen cross‐linking enzymes LOXL2 and PLOD2 by tumor‐suppressive microRNA‐26a/b in renal cell carcinoma. Int J Oncol 2016; 48: 1837–46. [DOI] [PMC free article] [PubMed] [Google Scholar]
- 32. Fukumoto I, Kikkawa N, Matsushita R et al Tumor‐suppressive microRNAs (miR‐26a/b, miR‐29a/b/c and miR‐218) concertedly suppressed metastasis‐promoting LOXL2 in head and neck squamous cell carcinoma. J Hum Genet 2016; 61: 109–18. [DOI] [PubMed] [Google Scholar]
- 33. Kamikawaji K, Seki N, Watanabe M et al Regulation of LOXL2 and SERPINH1 by antitumor microRNA‐29a in lung cancer with idiopathic pulmonary fibrosis. J Hum Genet 2016; 61: 985–93. [DOI] [PubMed] [Google Scholar]
- 34. Kato M, Kurozumi A, Goto Y et al Regulation of metastasis‐promoting LOXL2 gene expression by antitumor microRNAs in prostate cancer. J Hum Genet 2017; 62: 123–32. [DOI] [PubMed] [Google Scholar]
- 35. Moon HJ, Finney J, Ronnebaum T, Mure M. Human lysyl oxidase‐like 2. Bioorg Chem 2014; 57: 231–41. [DOI] [PMC free article] [PubMed] [Google Scholar]
- 36. Millanes‐Romero A, Herranz N, Perrera V et al Regulation of heterochromatin transcription by Snail1/LOXL2 during epithelial‐to‐mesenchymal transition. Mol Cell 2013; 52: 746–57. [DOI] [PubMed] [Google Scholar]
- 37. Mataki H, Seki N, Mizuno K et al Dual‐strand tumor‐suppressor microRNA‐145 (miR‐145‐5p and miR‐145‐3p) coordinately targeted MTDH in lung squamous cell carcinoma. Oncotarget 2016; 7: 72084–98. [DOI] [PMC free article] [PubMed] [Google Scholar]
- 38. Matsushita R, Yoshino H, Enokida H et al Regulation of UHRF1 by dual‐strand tumor‐suppressor microRNA‐145 (miR‐145‐5p and miR‐145‐3p): Inhibition of bladder cancer cell aggressiveness. Oncotarget 2016; 7: 28460–87. [DOI] [PMC free article] [PubMed] [Google Scholar]
- 39. Yonemori M, Seki N, Yoshino H et al Dual tumor‐suppressors miR‐139‐5p and miR‐139‐3p targeting matrix metalloprotease 11 in bladder cancer. Cancer Sci 2016; 107: 1233–42. [DOI] [PMC free article] [PubMed] [Google Scholar]
- 40. Matsushita R, Seki N, Chiyomaru T et al Tumour‐suppressive microRNA‐144‐5p directly targets CCNE1/2 as potential prognostic markers in bladder cancer. Br J Cancer 2015; 113: 282–9. [DOI] [PMC free article] [PubMed] [Google Scholar]
- 41. Byrnes KA, Phatak P, Mansour D et al Overexpression of miR‐199a‐5p decreases esophageal cancer cell proliferation through repression of mitogen‐activated protein kinase kinase kinase‐11 (MAP3K11). Oncotarget 2016; 7: 8756–70. [DOI] [PMC free article] [PubMed] [Google Scholar]
- 42. Gui R, Huang R, Zhang JH, Wen XH, Nie XM. MicroRNA‐199a‐5p inhibits VEGF‐induced tumorigenesis through targeting oxidored‐nitro domain‐containing protein 1 in human HepG2 cells. Oncol Rep 2016; 35: 2216–22. [DOI] [PubMed] [Google Scholar]
- 43. Zhou M, Wang S, Hu L, Liu F, Zhang Q, Zhang D. miR‐199a‐5p suppresses human bladder cancer cell metastasis by targeting CCR7. BMC Urology 2016; 16: 64. [DOI] [PMC free article] [PubMed] [Google Scholar]
- 44. Gao Y, Feng Y, Shen JK et al CD44 is a direct target of miR‐199a‐3p and contributes to aggressive progression in osteosarcoma. Sci Rep 2015; 5: 11365. [DOI] [PMC free article] [PubMed] [Google Scholar]
- 45. Liu R, Liu C, Zhang D et al miR‐199a‐3p targets stemness‐related and mitogenic signaling pathways to suppress the expansion and tumorigenic capabilities of prostate cancer stem cells. Oncotarget 2016; 7: 56628–42. [DOI] [PMC free article] [PubMed] [Google Scholar]
- 46. Garzia L, Andolfo I, Cusanelli E et al MicroRNA‐199b‐5p impairs cancer stem cells through negative regulation of HES1 in medulloblastoma. PLoS ONE 2009; 4: e4998. [DOI] [PMC free article] [PubMed] [Google Scholar]
- 47. Fang C, Zhao Y, Guo B. MiR‐199b‐5p targets HER2 in breast cancer cells. J Cell Biochem 2013; 114: 1457–63. [DOI] [PubMed] [Google Scholar]
- 48. Gilcrease MZ. Integrin signaling in epithelial cells. Cancer Lett 2007; 247: 1–25. [DOI] [PubMed] [Google Scholar]
- 49. Ganguly KK, Pal S, Moulik S, Chatterjee A. Integrins and metastasis. Cell Adh Migr 2013; 7: 251–61. [DOI] [PMC free article] [PubMed] [Google Scholar]
- 50. Ramovs V, Te Molder L, Sonnenberg A. The opposing roles of laminin‐binding integrins in cancer. Matrix Biol 2016; 57–58: 213–24. [DOI] [PubMed] [Google Scholar]
- 51. Kamoshida G, Matsuda A, Katabami K et al Involvement of transcription factor Ets‐1 in the expression of the alpha3 integrin subunit gene. FEBS J 2012; 279: 4535–46. [DOI] [PubMed] [Google Scholar]
- 52. Cagnet S, Faraldo MM, Kreft M et al Signaling events mediated by alpha3beta1 integrin are essential for mammary tumorigenesis. Oncogene 2014; 33: 4286–95. [DOI] [PubMed] [Google Scholar]
Associated Data
This section collects any data citations, data availability statements, or supplementary materials included in this article.
Supplementary Materials
Fig. S1. (a) ITGA3 protein expression levels were measured by western blot after 24 h ITGA3‐expression vector transfection on SAS cells. GAPDH was used as a loading control. (b) ITGA3 protein expression levels were measured by western blot 48 h after reverse transfection with miR‐199 family and 24 h after forward transfection with the vector control (VC) and ITGA3 vector on SAS cells. GAPDH was used as a loading control. (c) Cell proliferation was determined using XTT assays 48 h after reverse transfection with miR‐199 family and 24 h after forward transfection with the vector control (VC) and ITGA3 vector. **P = 0.004