

Summary
Multiple sclerosis is an inflammatory T cell‐mediated autoimmune disease. In a Phase II clinical trial, high‐dose immunosuppressive therapy combined with autologous CD34+ haematopoietic stem cell transplant resulted in 69·2% of subjects remaining disease‐free without evidence of relapse, loss of neurological function or new magnetic resonance imaging (MRI) lesions to year 5 post‐treatment. A combination of CyTOF mass cytometry and multi‐parameter flow cytometry was used to explore the reconstitution kinetics of immune cell subsets in the periphery post‐haematopoietic cell transplant (HSCT) and the impact of treatment on the phenotype of circulating T cells in this study population. Repopulation of immune cell subsets progressed similarly for all patients studied 2 years post‐therapy, regardless of clinical outcome. At month 2, monocytes and natural killer (NK) cells were proportionally more abundant, while CD4 T cells and B cells were reduced, relative to baseline. In contrast to the changes observed at earlier time‐points in the T cell compartment, B cells were proportionally more abundant and expansion in the proportion of naive B cells was observed 1 and 2 years post‐therapy. Within the T cell compartment, the proportion of effector memory and late effector subsets of CD4 and CD8 T cells was increased, together with transient increases in proportions of CD45RA‐regulatory T cells (Tregs) and T helper type 1 (Th1 cells) and a decrease in Th17·1 cells. While none of the treatment effects studied correlated with clinical outcome, patients who remained healthy throughout the 5‐year study had significantly higher absolute numbers of memory CD4 and CD8 T cells in the periphery prior to stem cell transplantation.
Keywords: CyTOF mass cytometry, flow cytometry, immune cell reconstitution, multiple sclerosis, T cells
Introduction
Multiple sclerosis (MS) is a chronic autoimmune disease of the central nervous system (CNS) in which infiltration of autoreactive immune cells into the CNS and release of inflammatory cytokines is thought to promote neuronal demyelination and damage. The role of CD4 T cells has long been considered central to MS pathophysiology 1, 2; however, increasing evidence suggests additional immune cell types, including B cells and natural killer (NK) cells, play a role in this complex disorder 3, 4, 5, 6. Alterations in the distribution and function of circulating T and B cell populations have been shown to correlate with disease activity and reflect those observed in the CNS of patients with MS, identifying potential immunological biomarkers for monitoring diseasing activity and response to treatment 6.
One intervention strategy that has shown promise as a durable therapy for MS is a single course of high‐dose immunosuppressive therapy (HDIT), followed by autologous haematopoietic stem cell transplant (HSCT) 7, 8, 9, 10. In the haematopoietic stem cell transplantation for relapsing–remitting multiple sclerosis (HALT‐MS) Phase II trial of HDIT/HSCT, overall event‐free survival 5 years post‐therapy was 69·2% 11. The mechanistic rationale of this therapy is to first remove pathogenic autoreactive cells thought to perpetuate disease, and replace them with a de‐novo repertoire of immune cells that hopefully promote immune tolerance to disease‐specific antigens. In this study, the analytical power of mass cytometry (CyTOF), together with multi‐parameter flow cytometry, were used to expand upon our initial findings 12, 13 and define the repopulation kinetics, composition, activation and cytokine profiles of discrete T cell subsets in the peripheral blood of MS patients before and after HDIT/HSCT treatment in the HALT‐MS trial. This comprehensive analysis of peripheral blood leucocytes allowed us to examine the dynamics of leucocyte repopulation in lymphopenic MS patients. While we did not see a correlation between treatment success or other patient parameters and cellular repopulation, we found that patients who remained healthy throughout the 5‐year study had significantly higher absolute numbers of memory CD4 and CD8 T cells in the periphery prior to HDIT/HSCT treatment.
Methods and materials
PBMC cryopreservation and thawing
PBMCs were isolated by Ficoll separation and cryopreserved. They were stored and shipped in vapour phase liquid nitrogen until thawing, which was carried out as described 14. After washing and counting, cells were resuspended at 107 cells/ml in complete medium, and plated at 200 μl per well in a 96‐well microtitre plate.
CyTOF staining and acquisition
Replicate wells of peripheral blood mononuclear cells (PBMC) from each patient time‐point were either stimulated with 10 ng/ml phorbol myristate acetate (PMA) + 1 μg/ml ionomycin, or left unstimulated, for 4 h at 37°C, in the presence of 5 μg/ml brefeldin A and 5 μg/ml monensin. Cells were then stained 15 using the cocktail shown in Table 1. After intracellular staining and washing, cells were kept at 4°C and analysed by CyTOF within 24 h. On the day of acquisition, cells were treated with DNA intercalator, then washed with CyFACS buffer and ultrapure deionized water 15. Approximately 300 000 total events per sample were collected on a CyTOFTM mass cytometer (Fluidigm, South San Francisco, CA, USA) using Dd mode. Flow cytometry standard (FCS) files were exported and analysed using FlowJo (TreeStar, Eugene, OR, USA).
Table 1.
CyTOF mass cytometry panel
| Metal label | Specificity | Antibody clone | Source |
|---|---|---|---|
| Qdot | CD3 | S4.1 | Invitrogen |
| 115In | Maleimide‐DOTA | Macrocyclics | |
| 139La | CD49d | 9F10 | Biolegend |
| 141Pr | CD45RO | UCHL1 | Biolegend |
| 142Nd | CD19 | HIB19 | DVS |
| 143Nd | CD57 | HCD57 | Biolegend |
| 144Nd | CD69 | FN50 | AbD Serotec |
| 145Nd | CD4 | RPA‐T4 | DVS |
| 146Nd | CD8 | HIT8a | Biolegend |
| 147Sm | CD20 | 2H7 | DVS |
| 148Nd | MIP‐1β | D21–1351 | BD Special |
| 149Sm | CD85j | 292319 | R+D Systems |
| 150Nd | CD45RA | HI100 | Biolegend |
| 151Eu | CD38 | HB‐7 | BD Special |
| 152Sm | TNF‐α | Mab | DVS |
| 153Eu | Granzyme B | GB11 | AbCam |
| 154Sm | CD107a | H4A3 | BD |
| 155Gd | GM‐CSF | BVD2–21C11 | Biolegend |
| 156Gd | CD94 | HP‐3D9 | BD |
| 157Gd | IL‐2 | MQ1–17h12 | eBiosci. |
| 158Gd | IFN‐γ | 4S.B3 | eBiosci. |
| 159Tb | HLA‐DR | G46–6 | BD |
| 160Gd | CD14 | M5E2 | DVS |
| 161Dy | CD43 | 84–3C1 | eBiosci. |
| 162Dy | Biotin‐IL‐10 | JES3–12G8 | Biolegend |
| 163Dy | CD154 | 24–31 | Biolegend |
| 164Dy | IL‐17A | N49–653 | DVS |
| 165Ho | CD127 | A019D5 | Biolegend |
| 166Er | CD33 | P67.6 | Santa Cruz Biotechnology |
| 167Er | CD27 | L128 | DVS |
| 168Er | CD28 | L293 | BD |
| 169Tm | CCR7 | 150503 | R&D Systems |
| 170Er | PD1 | EH12.1 | BD |
| 171Yb | TCR‐γδ | B1 | Biolegend |
| 172Yb | IgD | IA6–2 | Biolegend |
| 173Yb | Perforin | B‐D48 | AbCam |
| 174Yb | CD16 | 3G8 | Biolegend |
| 175Lu | CD56 | NCAM16.2 | BD |
| 176Yb | CD25 | M‐A251 | BD |
MIP‐1β = macrophage inflammatory protein 1β; TNF = tumour necrosis factor; GM‐CSF = granulocyte–macrophage colony‐stimulating factor; IL = interleukin; IFN = interferon; HLA‐DR = human leucocyte antigen D‐related; TCR = T cell receptor.
Spanning‐tree progression analysis of density‐normalized events (SPADE) analysis
Equal numbers of live singlets from each FCS file for a given time‐point were concatenated to form a single FCS file. The resulting four concatenated files were analysed in CytoSPADE 16, with a target node number of 400, and down‐sampling of 10%. Dimensions used for clustering are shown in bold type in Table 1.
Graphing and statistics
Gated percentages were converted to absolute cell counts by reference to complete blood counts. The absolute counts were plotted using GraphPad Prism. Group differences were assessed using multiple t‐tests, with correction for multiple comparisons by the Holm–Sidak method.
Flow cytometry staining and rhodamine efflux
Frozen PBMCs (10–15 million cells) were thawed and rested overnight at 37°C in a six‐well tissue culture plate (Greiner, Monroe, NC, USA). The following morning the cells were harvested and washed with ice‐cold efflux buffer (RPMI‐1640 + glutamine + HEPES + 1% bovine calf serum) then spun down at 300 × g for 5 min at 4°C. The cells were resuspended in 1·5 ml of cold efflux buffer + 10 µg/ml rhodamine‐123 (Sigma, St Louis, MO, USA) and left on ice for 30 min. Cells were then washed twice with cold efflux buffer and spun down at 300 × g for 5 min at 4° before being resuspended in 1·5 ml of 37°C efflux buffer and placed in a 37°C water‐bath for 1·5 h. Surface staining for CD3 (clone UCHT1; Biolegend, San Diego, CA, USA), CD4 (clone OKT4; Biolegend), CD8 (clone RPA‐T8; Biolegend), CD45RA (clone HI100; Biolegend), CD127 (clone A019D5; Biolegend), CD25 (clone BC96; Biolegend), CD161 (clone HP‐3G10; Biolegend), CCR4 (clone L291H4; Biolegend), CCR6 (clone R6H1; eBioscience, San Jose, CA, USA) and CXCR3 (clone 1C6; BD Biosciences, San Jose, CA, USA) was performed subsequently in fluorescence activated cell sorter (FACS) buffer [phosphate‐buffered saline (PBS) w/o Ca2+ + Mg2+ supplemented with 2% bovine calf serum (BCS) and 1 mM ethylenediamine tetraacetic acid (EDTA)] for 30 min on ice. Flow cytometry was performed on a FACS Aria II (BD Biosciences), and analysis performed using FlowJo (Tree Star).
Patient information
Clinical data from the HALT‐MS participants are outlined in Table 2 and have been reported previously 11, and are available from ITNTrialShare (https://www.itntrialshare.org/study/Studies/ITN033AI5YR/Study%20Data/dataset.view?datasetId = 502).
Table 2.
Patient data
| Patient number | End‐point | Age at mobilization | Gender | Race | Baseline EDSS score | Months in follow‐up |
|---|---|---|---|---|---|---|
| HALT_326456 | No relapse | 26 | Female | White | 4·50 | 61·4 |
| HALT_990611 | Relapse | 28 | Female | White | 5·00 | 61·2 |
| HALT_858871 | Relapse | 46 | Female | White | 4·50 | 31·7 |
| HALT_566004 | No relapse | 38 | Female | White | 3·00 | 72·4 |
| HALT_787656 | Relapse | 27 | Male | White | 4·50 | 48·3 |
| HALT_544537 | No relapse | 28 | Male | Multi‐Racial | 4·50 | 70·3 |
| HALT_990883 | No relapse | 34 | Male | White | 5·00 | 71·2 |
| HALT_831638 | Relapse | 27 | Female | White | 4·50 | 64·7 |
| HALT_295836 | No relapse | 34 | Male | White | 4·50 | 41·3 |
| HALT_957030 | Relapse | 33 | Female | White | 4·00 | 46·4 |
| HALT_389670 | Relapse | 26 | Female | White | 5·50 | 68·1 |
| HALT_324300 | No relapse | 42 | Male | White | 4·00 | 60·9 |
| HALT_613743 | No relapse | 41 | Female | White | 4·00 | 66·8 |
| HALT_284319 | No relapse | 52 | Female | White | 4·00 | 62·2 |
| HALT_416568 | No relapse | 43 | Female | White | 3·50 | 65·9 |
| HALT_677447 | No relapse | 39 | Female | White | 4·00 | 63·4 |
| HALT_268578 | No relapse | 31 | Female | White | 5·00 | 61·1 |
| HALT_201862 | No relapse | 37 | Female | White | 4·00 | 62·9 |
| HALT_452644 | No relapse | 47 | Female | White | 4·00 | 56·8 |
| HALT_454298 | No relapse | 40 | Male | White | 4·00 | 12·0 |
| HALT_663301 | Relapse | 49 | Female | White | 5·50 | 53·9 |
| HALT_302299 | No relapse | 37 | Female | White | 4·00 | 62·9 |
| HALT_169679 | No relapse | 31 | Male | White | 5·00 | 62·5 |
EDSS = expanded disability status scale.
Results
Time–course of immune cell reconstitution post‐stem cell transplant
Immunophenotyping by CyTOF mass cytometry was performed on cryopreserved PBMC from 23 HALT‐MS participants treated with HDIT/HSCT before and after intervention at month 2 and years 1 and 2. The CyTOF panel comprised a combination of 29 cell surface and nine intracellular markers (Table 1), providing a powerful immunological tool for monitoring the frequency and activation state of discrete leucocyte populations. SPADE analysis was employed to group related cell clusters into major leucocyte populations (CD4 T cells, CD8 T cells, B cells, NK cells and monocytes), and to determine the proportions of specific cell subsets within these parent populations. SPADE trees were generated to visualize the overall kinetics of immune cell reconstitution in the peripheral blood of all 23 participants following HDIT/HSCT. Absolute counts were calculated from SPADE analysis together with total lymphocyte counts obtained from patient complete blood counts (CBC), and used to generate pie charts for evaluating the relative composition of specific cell subsets within each major leucocyte population (Fig. 1).
Figure 1.
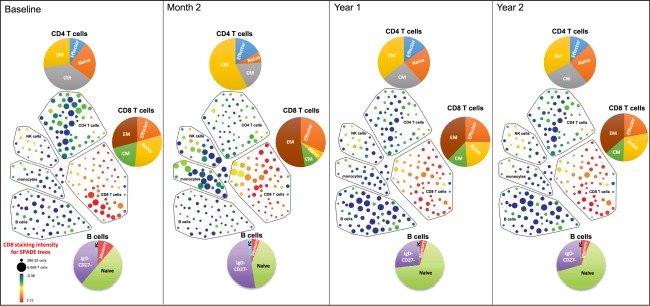
Time–course of immune cell reconstitution post‐stem cell transplant for all haematopoietic stem cell transplantation for relapsing‐remitting multiple sclerosis (HALT‐MS) patients using concatenated data, visualized by spanning‐tree progression analysis of density‐normalized events (SPADE) trees constructed from a concatenated flow cytometry standard (FCS) file containing equal numbers of cell events from each patient for each time‐point. Major immune cell populations were grouped according to the SPADE analysis. Each node in the SPADE tree represents a cluster of cells that share a similar phenotype. Nodes in this SPADE tree are coloured according to CD8 staining intensity, and their size reflects number of cells within the cluster represented by that node. Pie charts are based on absolute cell numbers to illustrate the proportion of cell subsets within the major immune cell population. Absolute counts were calculated from SPADE analysis together with total lymphocyte counts from complete blood counts (CBC). All cell subsets, except for CD4+ T cells, were recovered fully by 2 years post‐transplant. At 2 months, monocytes and natural killer (NK) cells are proportionally more abundant. There is also a redistribution of CD8+ T cell phenotypes, with a bias towards late effector phenotypes. At 1 and 2 years post‐transplant, B cells are proportionally more abundant, and other populations reflect baseline distributions more closely. Naive T cells: CD45RA+CCR7+; central memory (CM) T cells: CD45RA–CCR7+; effector memory (EM) T cells: CD45RA–CCR7–; effector T cells: CD45RA+CCR7–; naive B cells: immunoglobulin (Ig)D+CD27–; memory B cells: IgD–CD27+CD38–; plasma B cells (PC): IgD–CD27+CD38+.
A transient increase in the proportion of total monocytes and NK cells was observed 2 months post‐transplant that returned to baseline at year 1 (Fig. 1, SPADE trees). This is in contrast, and probably related, to the reduced numbers of circulating CD4 T cell and B cell populations reported previously at this early time‐point post‐HSCT 12, 13. Within the CD4 and CD8 T cell compartments in peripheral blood at month 2, we observed a temporary redistribution of subsets with increased proportions of effector memory (CD45RA–CCR7–) and late effector (CD45RA+CCR7–) subtypes that returned to baseline at years 1 and 2 (Fig. 1, pie charts). Total B cells were reduced modestly at month 2, but increased from baseline at years 1 and 2 post‐transplant (Fig. 1, SPADE trees). Within the circulating B cell population at years 1 and 2 post‐transplant, proportions of naive B cells expanded compared to baseline (Fig. 1, pie charts). All major immune cell types, except for CD4 T cells, were recovered fully 2 years post‐transplant.
Impact of HDIT/HSCT on discrete subsets of CD4 T cells in peripheral blood
Relapsing–remitting MS is considered to be mediated by autoreactive T helper type 1 (Th1)/Th17·1 effector cells 17, 18, 19, 20 and alterations in regulatory function and homeostasis of naive and memory‐like CD4+forkhead box protein 3 (FoxP3+)/CD25+CD127+ regulatory T cells (Tregs) 21, 22, 23, 24, 25, 26, 27, 28, 29. To evaluate the impact of HDIT/HSCT treatment on these subsets, multi‐parameter flow cytometric analysis was performed on cryopreserved PBMC from 17 of the 23 HALT‐MS participants for whom we had samples. Frequencies of CD4 Tregs (CD25+CD127low/–) and effector T helper cell lineage subsets were assessed before and after intervention at month 6 and year 2.
At month 6 and year 2 post‐transplant, the percentage of total CD4 Tregs in peripheral blood was not significantly different from baseline (Fig. 2a, graph). However, the ratio of CD45RA–CD45RA+ subsets within circulating Tregs was significantly different from baseline at month 6, with the majority displaying a memory (CD45RA–) phenotype that returned to baseline distribution at year 2 (Fig. 2a, pie charts). Although the percentage of memory CD4 non‐Tregs (CD45RA–CD25–CD127+) appeared to increase in peripheral blood at month 6 compared to baseline and year 2, this was not statistically significant (data not shown).
Figure 2.

Changes in frequency of regulatory and effector CD4 T cells post‐stem cell transplant. Flow cytometry was used to determine the frequency of (a) regulatory T cells (Tregs: CD4+CD25+CD127–) and (b) effector T cells (CD4+CD45RA– non‐Tregs) as well as (c) multi‐drug resistance protein 1 (MDR1) activity of effector T cells using rhodamine efflux as a marker. For Tregs, the pie charts represent the proportion of CD45RA+/– cells. For CD4+CD45RA– effector T cells, the line graphs in (b) represent proportion of effector T helper cell lineage subsets and in (c) represent the percentage of cells in each effector subset that efflux rhodamine. A mixed model for repeated measurements was used to determine significant differences between time‐points for the mean of evaluated T cell subsets indicated by P‐values under the pie charts and on the line graphs (*P < 0·01; **P < 0·001).
We next examined the composition of effector T helper cell lineage subsets using combinations of chemokine receptors on the surface of memory CD4 non‐Tregs 30. Each of these populations was measured relative to total CD4 cells. The proportion of CXCR3+CCR6– Th1 effector memory cells increased at month 6 and began to decrease at year 2, but did not return fully to baseline values. The proportion of CXCR3–CCR6+ Th17 effector memory cells did not change across all observed time‐points (Fig. 2b). Although the proportion of Th17·1 CXCR3+CCR6+ Th17·1 effector memory cells relative to total CD4 cells was low, this cell subset was significantly lower than baseline at both month 6 and year 2 (Fig. 2b).
Th17·1 cells expressing MDR1 have been shown to be potent co‐producers of interferon (IFN)‐γ, interleukin (IL)‐17, granulocyte–macrophage colony‐stimulating factor (GM‐CSF), lack IL‐10, are considered to be highly proinflammatory and are believed to be a primary contributor to pathogenesis in multiple sclerosis 31. A rhodamine efflux assay was used to measure MDR1 activity for Th1, Th17 and Th17·1 effector T cells 31. While MDR1 activity was decreased on all effector T cells following transplant, especially at 6 months, the Th17·1 cells were particularly susceptible to treatment and MDR1 activity did not rebound, even to year 2 (Fig. 2c). It should also be noted that no differences were seen between patients who did or did not maintain event‐free survival to year 5.
Impact of HDIT/HSCT on T cell cytokine and activation profiles
To analyse the cell phenotype further, we used CyTOF mass cytometry to track changes in intracellular cytokine production and activation markers on the surface of discrete T cell populations before and after HSCT treatment at month 2 and years 1 and 2. SPADE analysis 14 was used to construct trees by clustering related populations from all 23 subjects at each time‐point, as described in Fig. 1. Given the complexity of the data and small number of patients, statistical analyses of the changes in all markers in all cell subsets at each time‐point was not performed. Upon visual examination, however, changes in the overall expression of programmed cell death 1 (PD‐1) and the number of IFN‐γ‐expressing cells were striking. We therefore examined cell subsets using SPADE trees coloured by IFN‐γ (Fig. 3a) and PD‐1 (Fig. 3b) staining, recognizing that these changes represent trends across the cohort, but not necessarily robust statistical differences. Overall, staining intensity for IFN‐γ remained relatively consistent from baseline to year 2 for each of the five major leucocyte populations analysed. Tracking individual nodes within the CD4 T cell population reveals an increase in IFN‐γ‐staining intensity in a few specific cell populations at month 2 that return to baseline staining patterns at years 1 and 2 (Fig. 3a). While the same early time‐points could not be evaluated in the CyTOF and flow cytometry studies, the increased IFN‐γ staining in a subset of CD4 T cells at month 2 is consistent with the increased proportion of Th1 (CD45RA–CXCR3+CCR6–) effector cells revealed by flow cytometry at month 6 (Fig. 2b).
Figure 3.

Time–course of cytokine production and programmed cell death 1 (PD1) expression during immune cell reconstitution post‐stem cell transplant, visualized by spanning‐tree progression analysis of density‐normalized events (SPADE). (a) Nodes in this SPADE tree are coloured according to interferon (IFN)‐γ staining intensity and their size reflects number of cells within the cluster represented by that node. Representative IFN‐γ high‐ and low‐expressing nodes in the CD8 T cell population were selected for further evaluation. Co‐expression of interleukin (IL)‐2 and tumour necrosis factor (TNF) within these nodes were tracked over time (pop‐out density plots). (b) Nodes in this SPADE tree are coloured by PD1 staining intensity and their size reflects number of cells within the cluster represented by that node. The same IFN‐γ high‐ and low‐expressing nodes selected in (a) were tracked over time for co‐expression of PD1, CD57, human leucocyte antigen D‐related (HLA‐DR) and CD38 in (b).
Given the pathogenic role that Th1 and CD8 T cells are believed to play in MS 32, 33, co‐expression of IL‐2 and TNF‐α was also examined in IFN‐γ high‐ and low‐expressing nodes within the CD8 T cell compartment over time. Before HDIT/HSCT treatment, the majority of the IFN‐γ high‐expressing cell populations co‐expressed IL‐2 and tumour necrosis factor (TNF)‐α, whereas the majority of IFN‐γ low‐expressing populations consisted of single‐positive or double‐negative cells for IL‐2 and TNF‐α (Fig. 3a, dot‐plots). The polyfunctional staining profile of the IFN‐γ high‐expressing CD8 T cells remained relatively stable at all time‐points evaluated post‐HDIT/HSCT. In contrast, the proportion of cells co‐expressing IL‐2 and TNF‐α increased in the in IFN‐γ low‐expressing CD8 T cells at month 2, and returned to baseline staining patterns at years 1 and 2 (Fig. 3a, dot‐plots).
T cell activation was evaluated together with cytokine production by tracking the expression of surface markers PD‐1, CD57, CD38 and human leucocyte antigen D‐related (HLA‐DR) over time. Figure 3b shows increased staining intensity of PD‐1 on multiple CD4 and CD8 T cell populations at month 2 that return to baseline levels at years 1 and 2, with the exception of a few populations in the CD4 T cell compartment (Fig. 3b). Co‐expression of PD‐1, CD57, CD38 and HLA‐DR was examined in polyfunctional IFN‐γ high‐ and IFN‐γ low‐expressing CD8 T cells (the same clusters examined in Fig. 3a). Prior to HDIT/HSCT treatment at baseline, most cells in the polyfunctional IFN‐γ high‐expressing node exhibited intermediate levels of CD57 and HLA‐DR, with very few cells staining positive for PD‐1 or CD38 [Fig. 3b (the same clusters as examined in Fig. 3a)].
At 2 months post‐HSCT the majority of polyfunctional CD8 T cells expressed CD38 and an increased proportion expressed PD‐1 (Fig. 3b, top density plots), which is in contrast to the stable cytokine expression of the Th1 cells (Fig. 3a). The majority of IFN‐γ low‐expressing CD8 T cell populations lacked expression of PD‐1, CD57, CD38 and HLA‐DR prior to treatment. Striking alterations in the activation profile of these populations was observed at month 2, with the majority expressing high levels of CD57, CD38 and HLA‐DR (Fig. 3b, lower density plots). These changes in activation profiles returned to baseline at years 1 and 2 for both IFN‐γ high‐ and low‐expressing CD8 T cells.
Absolute numbers of memory CD4 and CD8 T cells in peripheral blood prior to HDIT/HSCT and 5‐year clinical outcome
The cell profiles prior to treatment and the repopulation kinetics post‐HDIT/HSCT treatment were examined to determine whether there were any biomarkers that correlated with the impressive 5‐year clinical outcome of this Phase II study. Of the 23 participants who received HSCT, 16 maintained event‐free survival to year 5 and seven did not. None of the immune cell reconstitution or expression patterns at any time‐point post‐HDIT/HSCT analysed by CyTOF mass cytometry or multi‐parameter flow cytometry correlated with the 5‐year clinical outcome. However, prior to HDIT/HSCT treatment, the group of 16 patients who remained healthy throughout the 5‐year study had significantly higher numbers of central memory (CD45RA–CCR7+) and effector memory (CD45RA–CCR7–) CD4 and CD8 T cells in peripheral blood than the seven participants who experienced an MS‐related event (Fig. 4a–d). Numbers of naive (CD45RA+CCR7+) and effector memory RA (EMRA) (CD45RA+CCR7–) CD4 and CD8 T cells were similar between the two groups prior to treatment (Fig. 4e–h).
Figure 4.

Absolute cell numbers for immune cell subsets grouped by the 5‐year clinical outcome, which is defined as maintenance of event‐free survival 5 years post‐stem cell transplant. Central memory (CM) CD4 (a) and CD8 (b) T cells: CD45RA–CCR7+; effector memory (EM) CD4 (c) and CD8 (d) T cells: CD45RA–CCR7–; naive CD4 (e) and CD8 (f) T cells: CD45RA+CCR7+; effector memory RA (EMRA) CD4 (g) and CD8 (h) T cells: CD45RA+CCR7. Absolute counts were calculated from SPADE analysis together with total lymphocyte counts from complete blood counts (CBC). Data shown are individual dot‐plots and group means ± standard error of the mean (s.e.m.) for the 15 participants who maintained event‐free survival to year 5 and the seven participants who did not. A mixed model for repeated measurements was used to determine significant difference between patient groups (**P < 0·001; ***P < 0·0001).
Discussion
Technological advances in mass cytometry and multi‐parameter flow cytometric analysis have improved dramatically our ability to monitor immunological changes associated with therapeutic intervention and disease activity. In the HALT‐MS study, we previously used five‐colour flow cytometric analysis of fresh peripheral blood to assess the reconstitution of major CD4 and CD8 T cells and B cell populations at 2 and 3 years post‐HSCT 12, 13. One of the goals of this follow‐up study was to use state‐of‐the‐art analytical tools to complete a more comprehensive survey of the reconstitution kinetics of discrete populations of circulating leucocytes in these patients. Here, we were able to monitor surface phenotypes and intracellular cytokine profiles simultaneously in multiple subsets of T cells as they repopulated in the peripheral blood of participants using CyTOF mass cytometry analysis of viably frozen PBMC. For example, this powerful tool revealed dynamic changes in activation profiles (up‐regulation of CD38 and PD‐1) of polyfunctional (IFN‐γ+TNF+IL‐2+) CD8 T cell subsets early in the reconstitution process. To our knowledge, this is the first analysis, in any disease setting, to use CyTOF for extensive multi‐parameter immunophenotyping of peripheral blood in patients treated with high‐dose immunosuppressive therapy followed by autologous stem cell transplant. This in‐depth reconstitution analysis builds upon what we and others have seen using lower resolution methods 12, 13, 34, 35 in MS and other autoimmune diseases.
We observed that the majority of differences in circulating leucocytes from baseline (prior to depletion) occurred early in the reconstitution process at 2–6 months post‐HDIT/HSCT. As expected, monocytes and NK cells were proportionally more abundant than CD4 T cell and B cell populations. This probably reflects slower kinetics of CD4 T cell and B cell reconstitution in the periphery, as reported previously 12, 13, 34. Consistent with prior reports, reconstituting cells in circulating CD4 and CD8 T cell compartments reflected a bias towards memory phenotype cells with a skewed distribution favouring effector memory and late effector subtypes 12, 13, 34, 35. The altered balance of memory/naive subtypes in total CD4 and CD8 T cell populations analysed by CyTOF was recapitulated in circulating CD25+CD127–/low CD4 Tregs analysed by flow cytometry. Taken together, these findings suggest HDIT/HSCT intervention results in an early bias towards memory subtypes in conventional and regulatory T cell populations during the reconstitution process in peripheral blood.
One of the most striking findings was increased PD‐1 on multiple subsets of circulating CD4 and CD8 T cells, which paralleled the bias towards effector memory and late effector phenotypes during early immune reconstitution. PD‐1 is a co‐inhibitory receptor that serves as a negative regulator of T cell function, proliferation and survival 36. PD‐1 is up‐regulated rapidly on T cells after acute activation to help limit the initial T cell response to robust stimulation 37. PD‐1 signalling is essential for maintaining lymphocyte homeostasis by preventing immune‐mediated damage and inducing T cell exhaustion to persistent antigens, as demonstrated in chronic viral infection and tumour models 38, 39. This mechanism is also thought to be important for establishing self‐tolerance during homeostatic proliferation in lymphopenic hosts 40. Therefore, we believe that the transient increase in PD‐1‐expressing T cells is probably the consequence of proliferation that occurs early after HDIT/HSCT in these lymphopenic MS patients. This observation is also consistent with a prior report of an independent cohort of MS patients treated with HSCT 41. Although this study is limited to the repopulation kinetics in MS patients post HDIT/HSCT, it is tempting to speculate that similar kinetics would be seen in other patients undergoing depletion‐repopulation therapy.
Using multi‐parameter flow cytometric analysis, we further characterized the reconstitution of different lineages of effector CD4 T cells in circulation post HDIT/HSCT and showed that the proportion of CXCR3+CCR6– Th1 effector memory cells was increased significantly, while the proportion of CXCR3+CCR6+ Th17·1 effector memory cells was decreased 6 months post‐HSCT. This transient early bias towards a Th1 effector memory surface phenotype was paralleled by increased IFN‐γ staining intensity, as revealed by CyTOF analysis in select subsets of CD4 T cells early after HDIT/HSCT, demonstrating a bias towards the Th1 phenotype in reconstituting effector memory CD4 T cells. In contrast, IFN‐γ production in CD8 T cells remained relatively stable at all time‐points evaluated, with IFN‐γ high‐expressing cells co‐expressing other cytokines such as IL‐2 and TNF‐α.
We were particularly interested in the kinetics of Th17·1 cell repopulation, as these cells, together with Th1 cells, have been implicated in the pathogenesis of MS. Consistent with the hypothesis that depletion of these cells would be beneficial, these were one of the few subsets where decreases in proportion to total CD4 cells were sustained for the 2 years following transplant. Furthermore, MDR1 activity, which is a marker for a particularly pathogenic cell subset, decreased following transplant and the decrease was maintained during the course of the study. While this decrease in MDR1 activity was also observed for other effector T cell subsets, Th17·1 cells were the only subset where the decrease in MDR1 activity was sustained to year 2. In all other subsets examined, MDR1 activity returned to baseline by year 2. Although this decrease in MDR1 activity in Th17·1 cells would be consistent with a positive clinical outcome, we observed this change in activity in all patients regardless of their disease status.
In general, the repopulation of immune cell subsets progressed similarly to 2 years for all patients studied, regardless of clinical outcome. The inability to detect repopulation differences corresponding with disease outcome could be a function of examining the heterogeneous population of T cells rather than the minor population of MS antigen‐specific cells, or it may be related to the limited sample size (n = 16–23 total study subjects; 4/16–17/23 who did not maintain event‐free survival) and/or heterogeneity in the clinical course (type of MS‐associated event and/or time post‐transplant event occurred) of the participants who did not achieve treatment success to 5 years post‐HSCT. Although none of the observed treatment effects correlated with clinical success, patients who remained healthy throughout the 5‐year study had significantly higher absolute numbers of memory CD4 and CD8 T cells in the periphery prior to HDIT/HSCT treatment. This unexpected finding could indicate that subjects who respond well to HDIT/HSCT intervention have worse disease prior to treatment. Conversely, one could speculate that patients who do not respond favourably to HDIT/HSCT have fewer numbers of effector and central memory T cells in peripheral blood prior to treatment, because these potentially pathogenic T cells are, instead, infiltrating the CNS perpetuating the disease. It is also possible that this is a spurious finding unrelated to the T cell immunopathology in the CNS 42. Further investigation is warranted before drawing conclusions about T cell biomarkers that might be predictive of treatment success.
Disclosures
The authors have no conflicts of interest to disclose.
Acknowledgements
We are indebted to Gerald Nepom and Philip Bernstein for their valuable critiques and additions to this paper. This research was performed as a project of the Immune Tolerance Network, an international clinical research consortium headquartered at the Benaroya Research Institute and supported by the National Institute of Allergy and Infectious Diseases of the National Institutes of Health under Award Number UM1AI109565. The content is solely the responsibility of the authors and does not necessarily represent the official views of the National Institutes of Health.
References
- 1. Chitnis T. The role of CD4 T cells in the pathogenesis of multiple sclerosis. Int Rev Neurobiol 2007; 79:43–72. [DOI] [PMC free article] [PubMed] [Google Scholar]
- 2. Fletcher JM, Lalor SJ, Sweeney CM, Tubridy N, Mills KH. T cells in multiple sclerosis and experimental autoimmune encephalomyelitis. Clin Exp Immunol 2010; 162:1–11. [DOI] [PMC free article] [PubMed] [Google Scholar]
- 3. Anolik JH, Barnard J, Owen T et al Delayed memory B cell recovery in peripheral blood and lymphoid tissue in systemic lupus erythematosus after B cell depletion therapy. Arthritis Rheum 2007; 56:3044–56. [DOI] [PubMed] [Google Scholar]
- 4. Chanvillard C, Jacolik RF, Infante‐Duarte C, Nayak RC. The role of natural killer cells in multiple sclerosis and their therapeutic implications. Front Immunol 2013; 4:63. [DOI] [PMC free article] [PubMed] [Google Scholar]
- 5. Claes N, Fraussen J, Stinissen P, Hupperts R, Somers V. B cells are multifunctional players in multiple sclerosis pathogenesis: insights from therapeutic interventions. Front Immunol 2015; 6:642. [DOI] [PMC free article] [PubMed] [Google Scholar]
- 6. Jones AP, Kermode AG, Lucas RM, Carroll WM, Nolan D, Hart PH. Circulating immune cells in multiple sclerosis. Clin Exp Immunol 2017; 187:193–203. [DOI] [PMC free article] [PubMed] [Google Scholar]
- 7. Bhattacharyya A, Sahhar J, Milliken S et al Autologous hematopoietic stem cell transplant for systemic sclerosis improves anemia from gastric antral vascular ectasia. J Rheumatol 2015; 42:554–5. [DOI] [PubMed] [Google Scholar]
- 8. Nash RA, McSweeney PA, Crofford LJ et al High‐dose immunosuppressive therapy and autologous hematopoietic cell transplantation for severe systemic sclerosis: long‐term follow‐up of the US multicenter pilot study. Blood 2007; 110:1388–96. [DOI] [PMC free article] [PubMed] [Google Scholar]
- 9. Vonk MC, Marjanovic Z, van den Hoogen FH et al Long‐term follow‐up results after autologous haematopoietic stem cell transplantation for severe systemic sclerosis. Ann Rheum Dis 2008; 67:98–104. [DOI] [PubMed] [Google Scholar]
- 10. Atkins HL, Bowman M, Allan D et al Immunoablation and autologous haemopoietic stem‐cell transplantation for aggressive multiple sclerosis: a multicentre single‐group phase 2 trial. Lancet 2016; 388:576–85. [DOI] [PubMed] [Google Scholar]
- 11. Richard GJH, Nash MA, Michael MD et al High‐dose immunosuppressive therapy and autologous HCT for relapsing‐remitting MS (HALT‐MS). Neurology 2017; 88:842–52. [DOI] [PMC free article] [PubMed] [Google Scholar]
- 12. Muraro PA, Robins H, Malhotra S et al T cell repertoire following autologous stem cell transplantation for multiple sclerosis. J Clin Invest 2014; 124:1168–72. [DOI] [PMC free article] [PubMed] [Google Scholar]
- 13. Nash RA, Hutton GJ, Racke MK et al High‐dose immunosuppressive therapy and autologous hematopoietic cell transplantation for relapsing‐remitting multiple sclerosis (HALT‐MS): a 3‐year interim report. JAMA Neurol 2015; 72:159–69. [DOI] [PMC free article] [PubMed] [Google Scholar]
- 14. Disis ML, dela Rosa C, Goodell V et al Maximizing the retention of antigen specific lymphocyte function after cryopreservation. J Immunol Methods 2006; 308:13–8. [DOI] [PubMed] [Google Scholar]
- 15. Lin D, Gupta S, Maecker HT. Intracellular cytokine staining on PBMCs using CyTOFTM mass cytometry. Bio‐Protocol 2015; 5:e1370. [DOI] [PMC free article] [PubMed] [Google Scholar]
- 16. Qiu P, Simonds EF, Bendall SC et al Extracting a cellular hierarchy from high‐dimensional cytometry data with SPADE. Nat Biotechnol 2011; 29:886–91. [DOI] [PMC free article] [PubMed] [Google Scholar]
- 17. Brucklacher‐Waldert V, Stuerner K, Kolster M, Wolthausen J, Tolosa E. Phenotypical and functional characterization of T helper 17 cells in multiple sclerosis. Brain 2009; 132:3329–41. [DOI] [PubMed] [Google Scholar]
- 18. Hedegaard CJ, Krakauer M, Bendtzen K, Lund H, Sellebjerg F, Nielsen CH. T helper cell type 1 (Th1), Th2 and Th17 responses to myelin basic protein and disease activity in multiple sclerosis. Immunology 2008; 125:161–9. [DOI] [PMC free article] [PubMed] [Google Scholar]
- 19. Jadidi‐Niaragh F, Mirshafiey A. Th17 cell, the new player of neuroinflammatory process in multiple sclerosis. Scand J Immunol 2011; 74:1–13. [DOI] [PubMed] [Google Scholar]
- 20. Tzartos JS, Friese MA, Craner MJ et al Interleukin‐17 production in central nervous system‐infiltrating T cells and glial cells is associated with active disease in multiple sclerosis. Am J Pathol 2008; 172:146–55. [DOI] [PMC free article] [PubMed] [Google Scholar]
- 21. Feger U, Luther C, Poeschel S, Melms A, Tolosa E, Wiendl H. Increased frequency of CD4+CD25+ regulatory T cells in the cerebrospinal fluid but not in the blood of multiple sclerosis patients. Clin Exp Immunol 2007; 147:412–8. [DOI] [PMC free article] [PubMed] [Google Scholar]
- 22. Haas J, Fritzsching B, Trübswetter P et al Prevalence of newly generated naive regulatory T cells (Treg) is critical for Treg suppressive function and determines Treg dysfunction in multiple sclerosis. J Immunol 2007; 179:1322–30. [DOI] [PubMed] [Google Scholar]
- 23. Haas J et al Reduced suppressive effect of CD4+CD25high regulatory T cells on the T cell immune response against myelin oligodendrocyte glycoprotein in patients with multiple sclerosis. Eur J Immunol 2005; 35:3343–52. [DOI] [PubMed] [Google Scholar]
- 24. Kebir H, Hug A, Viehöver A et al Preferential recruitment of interferon‐gamma‐expressing TH17 cells in multiple sclerosis. Ann Neurol 2009; 66:390–402. [DOI] [PubMed] [Google Scholar]
- 25. Kumar M, Putzki N, Limmroth V et al CD4+CD25+FoxP3+ T lymphocytes fail to suppress myelin basic protein‐induced proliferation in patients with multiple sclerosis. J Neuroimmunol 2006; 180:178–84. [DOI] [PubMed] [Google Scholar]
- 26. Venken K, Hellings N, Broekmans T, Hensen K, Rummens JL, Stinissen P. Natural naive CD4+CD25+CD127low regulatory T cell (Treg) development and function are disturbed in multiple sclerosis patients: recovery of memory Treg homeostasis during disease progression. J Immunol 2008; 180:6411–20. [DOI] [PubMed] [Google Scholar]
- 27. Venken K, Hellings N, Hensen K et al Secondary progressive in contrast to relapsing‐remitting multiple sclerosis patients show a normal CD4+CD25+ regulatory T‐cell function and FOXP3 expression. J Neurosci Res 2006; 83:1432–46. [DOI] [PubMed] [Google Scholar]
- 28. Venken K, Hellings N, Thewissen M et al Compromised CD4+ CD25(high) regulatory T‐cell function in patients with relapsing‐remitting multiple sclerosis is correlated with a reduced frequency of FOXP3‐positive cells and reduced FOXP3 expression at the single‐cell level. Immunology 2008; 123:79–89. [DOI] [PMC free article] [PubMed] [Google Scholar]
- 29. Viglietta V, Baecher‐Allan C, Weiner HL, Hafler DA. Loss of functional suppression by CD4+CD25+ regulatory T cells in patients with multiple sclerosis. J Exp Med 2004; 199:971–9. [DOI] [PMC free article] [PubMed] [Google Scholar]
- 30. Mahnke YD, Brodie TM, Sallusto F, Roederer M, Lugli E. The who's who of T‐cell differentiation: human memory T‐cell subsets. Eur J Immunol 2013; 43:2797–809. [DOI] [PubMed] [Google Scholar]
- 31. Ramesh R, Kozhaya L, McKevitt K et al Pro‐inflammatory human Th17 cells selectively express P‐glycoprotein and are refractory to glucocorticoids. J Exp Med 2014; 211:89–104. [DOI] [PMC free article] [PubMed] [Google Scholar]
- 32. Sospedra M, Martin R. Immunology of multiple sclerosis. Annu Rev Immunol 2005; 23:683–747. [DOI] [PubMed] [Google Scholar]
- 33. Weiner HL. Multiple sclerosis is an inflammatory T‐cell‐mediated autoimmune disease. Arch Neurol 2004; 61:1613–5. [DOI] [PubMed] [Google Scholar]
- 34. Arruda LC, de Azevedo JT, de Oliveira GL et al Immunological correlates of favorable long‐term clinical outcome in multiple sclerosis patients after autologous hematopoietic stem cell transplantation. Clin Immunol 2016; 169:47–57. [DOI] [PubMed] [Google Scholar]
- 35. Bosch M, Khan FM, Storek J. Immune reconstitution after hematopoietic cell transplantation. Curr Opin Hematol 2012; 19:324–35. [DOI] [PubMed] [Google Scholar]
- 36. Keir ME, Butte MJ, Freeman GJ, Sharpe AH. PD‐1 and its ligands in tolerance and immunity. Annu Rev Immunol 2008; 26:677–704. [DOI] [PMC free article] [PubMed] [Google Scholar]
- 37. Freeman GJ, Long AJ, Iwai Y et al Engagement of the PD‐1 immunoinhibitory receptor by a novel B7 family member leads to negative regulation of lymphocyte activation. J Exp Med 2000; 192:1027–34. [DOI] [PMC free article] [PubMed] [Google Scholar]
- 38. Barber DL, Wherry EJ, Masopust D et al Restoring function in exhausted CD8 T cells during chronic viral infection. Nature 2006; 439:682–7. [DOI] [PubMed] [Google Scholar]
- 39. Wherry EJ, Kurachi M. Molecular and cellular insights into T cell exhaustion. Nat Rev Immunol 2015; 15:486–99. [DOI] [PMC free article] [PubMed] [Google Scholar]
- 40. Lin SJ, Peacock CD, Bahl K, Welsh RM. Programmed death‐1 (PD‐1) defines a transient and dysfunctional oligoclonal T cell population in acute homeostatic proliferation. J Exp Med 2007; 204:2321–33. [DOI] [PMC free article] [PubMed] [Google Scholar]
- 41. Arruda LC, Lorenzi JC, Sousa AP et al Autologous hematopoietic SCT normalizes miR‐16, −155 and −142–3p expression in multiple sclerosis patients. Bone Marrow Transplant 2015; 50:380–9. [DOI] [PubMed] [Google Scholar]
- 42. Han S, Lin YC, Wu T et al Comprehensive immunophenotyping of cerebrospinal fluid cells in patients with neuroimmunological diseases. J Immunol 2014; 192:2551–63. [DOI] [PMC free article] [PubMed] [Google Scholar]