

Summary
Type 2 diabetes mellitus(DM) is a major risk factor for the development of active pulmonary tuberculosis (TB), with development of DM pandemic in countries where TB is also endemic. Understanding the impact of DM on TB and the determinants of co‐morbidity is essential in responding to this growing public health problem with improved therapeutic approaches. Despite the clinical and public health significance posed by the dual burden of TB and DM, little is known about the immunological and biochemical mechanisms of susceptibility. One possible mechanism is that an impaired immune response in patients with DM facilitates either primary infection with Mycobacterium tuberculosis or reactivation of latent TB. Diabetes is associated with immune dysfunction and alterations in the components of the immune system, including altered levels of specific cytokines and chemokines. Some effects of DM on adaptive immunity that are potentially relevant to TB defence have been identified in humans. In this review, we summarize current findings regarding the alterations in the innate and adaptive immune responses and immunological mechanisms of susceptibility of patients with DM to M. tuberculosis infection and disease.
Keywords: B cells, diabetes mellitus, latent tuberculosis, monocytes and dendritic cells, T cells, tuberculosis
Introduction
The relationship between type 2 diabetes mellitus (DM) and tuberculosis (TB) and their combined role in causing human disease has been accepted for a long time but has only lately become a priority issue of clinical and fundamental research.1 Type 2 DM and pulmonary TB (PTB) are two of the most common co‐morbid conditions in many parts of the world, and the union of these diseases appears to pose a serious threat to health care worldwide. A variety of clinical and epidemiological studies have identified DM as a risk factor for the development of active TB.2 Besides, DM also appears to be associated with a greater severity of TB disease among the infected population and to have a harmful effect on both disease presentation and response to treatment.1, 3 A meta‐analysis of 13 observational studies on the risk for TB disease in patients with DM determined that diabetic patients were 3·1 times more likely to have TB than non‐diabetic individuals.2 Subsequently, over 40 different studies, including four prospective studies, 16 retrospective studies and 17 case–control studies, have confirmed the increased susceptibility of individuals with DM to TB disease.
In six high TB‐burden countries, India, Indonesia, China, Nigeria, Pakistan and South Africa, the burdens of DM are 18%, 14%, 22%, 5%, 15% and 15%, respectively. The spectrum of the TB and DM problem in India, the country with one of the highest burdens of both diseases, was the focus of a study in 2011 by Viswanathan et al.4 The authors of that study performed oral glucose‐tolerance tests on 827 patients newly diagnosed with TB in Chennai. In that cohort, 25·3% of patients with TB were confirmed to have DM and 24·5% had pre‐diabetes.4 Another study conducted in Kerala reported that nearly half of patients with TB in Kerala had DM, and approximately half of these patients were newly‐diagnosed during the study.5
The immunological source of susceptibility to TB among those with DM is not well understood. Enhanced susceptibility to TB in patients with DM has been attributed to several factors, including direct effects related to hyperglycaemia and insulin resistance and indirect effects related to macrophage and lymphocyte function.1, 6, 7 The impaired immune response in patients with DM, which facilitates either primary infection with TB or reactivation of latent TB, may be the possible reason for these defective immune responses.8 Studies probing the innate and adaptive immune response to microbial antigens in patients with DM suggest that these responses are compromised, particularly in patients with chronic hyperglycaemia.9, 10, 11 Whether this applies to TB infection remains unclear.
Innate immunity to TB in patients with DM
Blood monocytes also play a key role in TB and undergo prompt migration to the lung upon initial Mycobacterium tuberculosis infection, where they differentiate into macrophages and dendritic cells for antigen presentation and secretion of cytokines. Furthermore, M. tuberculosis can enter and replicate (or be contained) within monocytes.12 The role of monocytes in TB‐naive individuals was assessed by Gomez et al.13 The association of M. tuberculosis with monocytes was significantly lower in patients with DM than in those without. Multivariate analysis controlling for host socio‐demographics, DM characteristics and serum lipids indicated that male gender and poorly controlled DM were significantly associated with the lower interaction of M. tuberculosis with monocytes. Serum heat‐inactivation reduced the association of M. tuberculosis to similar levels in both study groups, suggesting alterations in the complement pathway of patients with DM.13 In addition, Kumar et al.14 reported that coincident DM resulted in significantly lower frequencies of classical and intermediate monocytes in individuals with PTB. However, after completion of anti‐TB treatment, examination of the phenotype of monocyte subsets revealed significantly increased frequencies of classical and intermediate monocytes, indicating that alterations in frequencies of monocytes in TB‐DM co‐morbidity is reversible following anti‐TB therapy.15 TB‐DM was also associated with increased CCR2 expression, which may restrain monocyte traffic to the lung, indicating that DM might also influence the migratory capacity of monocytes in patients with DM.16
The examination of alveolar macrophages in TB‐DM patients has revealed the presence of hypodense alveolar macrophages, which are less activated and are correlated with the severity of disease, implying that they might contribute to the increased susceptibility to M tuberculosis infection.17 In addition, Arce‐Mendoza et al.18 reported that DM also affects the expression of receptors like CD64, CD206 and RAGE in monocytes. Upon M. tuberculosis antigen stimulation, all three receptors were significantly diminished in TB‐DM compared with TB alone, whereas RAGE expression was increased in patients with TB as well as in those with DM compared with controls. In vitro studies, using human macrophages from healthy donors and stimulated with M. tuberculosis under hyperglycaemic conditions, have revealed increased production of cytokines, including tumour necrosis factor (TNF‐α), interleukin‐1β (IL‐1β), IL‐6 and IL‐10.19 However, examination of soluble markers of monocyte/macrophage activation, including sCD163 and sCD14, has not revealed any significant differences in the plasma levels between TB‐DM and TB.20 Hence, the role of monocyte/macrophages in TB‐DM co‐morbidity needs further exploration.
Dendritic cells (DC) are one of the crucial players in linking innate and adaptive immune responses through their role in capturing, processing and presenting antigens. Studies have reported that migration of DC to the draining lymph node is essential for the activation of naive T cells in TB infection21 and that at the initiation of the infection, DC are highly represented at sites of M. tuberculosis infection.22, 23 To elucidate the influence of DM on DC, Kumar et al.14 examined the ex vivo phenotypic profile of the DC subset in patients with TB with or without DM. TB‐DM individuals exhibited significantly lower frequencies of both myeloid DC and plasmacytoid DC compared with individuals with TB. However, their contribution in the pathogenesis of this co‐morbidity and the effect of anti‐TB treatment on the ex vivo phenotype of DC subsets are poorly understood. To address this, Kumar et al.24 examined the frequency of DC subsets in individuals with TB with DM or without coincident DM (NDM) at baseline and at 2 months and 6 months of anti‐TB treatment and found that individuals with TB‐DM were characterized by diminished frequencies of myeloid DC and plasmacytoid DC at baseline and after 2 months of treatment but not following 6 months of treatment in comparison with those with TB‐NDM. Therefore, the changes in the percentages of DC subsets in TB‐DM individuals are reversed by anti‐TB treatment.24 Hence, hyperglycaemia and its related factors potentially function as the primary influence driving alterations in the frequency of DC subsets in TB.
Neutrophils are the other innate cell type that play an important role in pathogenesis or protection against TB infection and disease. Neutrophils are a critical component of the innate immune response to TB and are believed to contribute to disease protection through oxidative killing of mycobacteria.25 These cells can also promote pathology in conditions of high bacterial load, which favours neutrophil accumulation,26, 27 and a neutrophil‐dominant interferon signature in whole blood has been shown to correlate with active TB disease.28 TB‐DM co‐morbidity is characterized by heightened levels of absolute neutrophil counts.20 However, recent studies have reported an impairment in the function of neutrophils in these individuals, with a decreased capacity to phagocytose M. tuberculosis or other M. tuberculosis‐related molecules.29, 30 Finally, neutrophil counts have been identified at the nexus between DM and TB using Bayesian Network modelling of transcriptional analysis of TB‐DM and TB patients. These data indicate that neutrophilic inflammation is a central feature of TB‐DM and that incident TB disease elevates levels of biomarkers associated with macrovascular complications above the levels found in DM without co‐morbid TB (unpublished data).
Natural killer (NK) cells are also effector cells of innate immunity. The effector functions of NK cells are regulated by a sequence of inhibitory or activating receptors.31 During early infection, NK cells are capable of activating phagocytic cells at the site of infection. NK cells, which are large granular circulating lymphocytes, are recruited to the sites of bacterial infections, where they specialize in recognizing and destroying infected host cells.32 NK cell production of interferon‐γ (IFN‐γ), IL‐17 and IL‐22 is thought to play an important role in host defence against mycobacterial infection.33 A recent study found that TB‐DM is characterized by expanded frequencies of TB antigen‐stimulated NK cells expressing type 1 (TNF‐α) and type 17 (IL‐17A and IL‐17F) cytokines. In contrast, NK cells were associated with significantly decreased antigen‐specific expression of CD107a in TB‐DM patients.34 In addition, Zhang et al.35 reported that NKT cells from peripheral blood mononuclear cells in TB patients with or without DM were significantly increased compared with levels in non‐TB diabetic patients and healthy controls.
Antimicrobial peptides (AMPs) are a key component of the innate immunity to pathogens and are present mainly in phagocytic cells of the immune system, where they act by killing engulfed pathogens.36 Studies have shown that AMPs have high anti‐mycobacterial activity but low immunogenicity and are therefore promising therapeutic agents.37, 38 Among the AMP family, four of the most prominent are cathelicidin (LL37), human β‐defensin 2 (HBD2), human neutrophil peptide 1–3 (HNP1–3) and granulysin.39 Our unpublished data report that heightened levels of cathelicidin, HBD2 and HNP1–3 and diminished levels of granulysin are present in individuals with TB‐DM and TB compared with individuals with latent TB (LTB) or non‐TB‐infected individuals (NTB). In addition, there was an association of cathelicidin and HBD2 with the extent and severity of lung disease and with bacterial burdens, as well as correlations of AMPs with glycaemic parameters. Finally, our unpublished data revealed that there was a major reversal in the systemic concentrations of these AMPs after anti‐TB treatment in both TB‐DM and TB individuals. In addition, Gonzalez‐Curiel et al.40 reported that AMP gene expression is increased during active TB compared with LTB but in contrast to our unpublished data they reported lower expression of AMPs in DM, in both the LTB and the TB groups.18 In summary, patients with DM appear to have alterations in innate immunity, with decreased M. tuberculosis phagocytosis and decreased expression of genes that contribute to M. tuberculosis containment.
Adaptive immunity to TB in DM patients
Immunity to M. tuberculosis requires T‐helper type 1 (Th1) responses and (to a lesser extent) Th17 responses.41, 42 Interleukin‐2, IFN‐γ and TNF‐α as well as IL‐17 and IL‐23, all play important roles in the induction and maintenance of protective immune responses against TB.43, 44, 45, 46, 47, 48 Cytokines of the innate and adaptive immune systems orchestrate the immune response to TB infection, with type 1, type 17 and the IL‐1 family of cytokines having been implicated in protection against TB disease.49 An increasing number of immunological studies in patients with DM who have developed TB indicate a paradoxical hyper‐inflammatory response. Restrepo et al.50 demonstrated that purified protein derivative stimulation of whole blood in TB‐DM patients resulted in higher production of IFN‐γ, IL‐2, TNF‐α and granulocyte–macrophage colony‐stimulating factor compared with non‐diabetic patients with TB. This finding was confirmed and extended by Kumar et al.51 To study the influence of DM on CD4+ T‐cell responses in active PTB, these authors examined baseline, M. tuberculosis antigen‐specific (CFP‐10 and ESAT‐6), and polyclonal induction of single, double and triple‐cytokine‐producing cells of the Th1 and Th17 subsets in individuals with active TB and coincident DM and compared them with individuals with active TB without DM. The patients with TB‐DM exhibited elevated frequencies of single‐ and double‐cytokine‐producing CD4+ Th1 cells, as well as increased frequencies of Th17 subsets following M. tuberculosis antigen stimulation, but lower frequencies of regulatory T (Treg) cells, in comparison with individuals with TB and without DM.51
A subsequent study of plasma cytokine levels in patients with DM by Kumar et al.52 confirmed this finding by studying the influence of type 2 DM on active PTB. The authors examined levels of a large panel of type 1, type 2, type 17, regulatory, and other pro‐inflammatory cytokines and chemokines in individuals with active TB and coincident DM and compared them with those in individuals with active TB but without DM. They also examined M. tuberculosis antigen‐stimulated levels of certain cytokines in the whole blood of individuals with TB and DM and in individuals with TB but without DM. TB‐DM is characterized by elevated circulating levels of type 1 (IFN‐γ, TNFα and IL‐2), type 2 (IL‐5) and type 17 (IL‐17A) cytokines but decreased circulating levels of IL‐22. This was also associated with increased systemic levels of other pro‐inflammatory cytokines (IL‐1β, IL‐6 and IL‐18) and an anti‐inflammatory cytokine (IL‐10) but not type 1 IFNs. Moreover, M. tuberculosis antigen‐stimulated whole blood also showed increased levels of pro‐inflammatory cytokines. The type 1 and type 17 cytokines in plasma exhibit a significant positive correlation with haemoglobin A1C levels, indicating that impaired control of DM is associated with this pro‐inflammatory milieu. Multivariate analysis revealed that the association of pro‐inflammatory cytokines with DM was not influenced by age, sex or other metabolic parameters.52 Other studies also have compared the IFN‐γ cytokine responses of TB patients with or without DM following in vitro stimulation of purified mycobacterial antigens. Walsh et al.53 reported that IFN‐γ secretion was significantly higher in TB‐DM when compared with patients with TB but no DM. However, not all studies have uniformly reported an increase in the type 1 or other pro‐inflammatory cytokines in TB‐DM. Gan et al.54 reported no significant differences in the levels of TB‐antigen‐specific IFN‐γ between diabetic and non‐diabetic patients with culture confirmed TB. Stalenhoef et al.55 in measuring the production of IFN‐γ and other pro‐inflammatory cytokines from whole blood of Indonesian TB patients with or without DM stimulated with M. tuberculosis sonicate, or Escherichia coli lipopolysaccharide, or phytohaemagglutinin, found no difference in the expression of pro‐inflammatory cytokines, including IFN‐γ. The only significant difference found in this study was diminished IL‐10 production in the diabetic group. Similarly, Faurholt‐Jepsen et al.56 also reported that DM is associated with reduced mycobacterial antigen‐specific IFN‐γ production in TB patients. These results contrast with data from Restrepo et al.50 and Kumar et al.,51, 52 probably reflecting differences in the populations studied or in methods such as the source of M. tuberculosis antigen. Individuals with DM have been shown to exhibit a characteristic deficiency in intracellular glutathione (GSH) levels, resulting in impaired production of IL‐12p70 and IFN‐γ in M. tuberculosis‐infected peripheral blood mononuclear cells.35 This impairment is reversible upon addition of GSH to the cell cultures. However, this study failed to examine the role of GSH in TB‐DM directly.
Both CD4+ and CD8+ T cells and their memory subsets like central memory and effector memory T cells have been shown to play important roles in protective immune responses in animal models of vaccination.57 To characterize the influence of DM on memory T‐cell subsets, Kumar et al.14 examined the ex vivo phenotypic profile of CD4+ and CD8+ memory T‐cell subsets in TB patients with or without DM. TB‐DM individuals exhibited significantly lower frequencies of naive but not central or effector memory in CD4+ memory T cells and lower frequency of naive and effector memory but significantly higher frequency of central memory in CD8+ memory T cells compared with PTB individuals.14 However, their involvement in the pathogenesis of this co‐morbidity and the effect of anti‐TB treatment on the phenotype of the T‐cell subsets is poorly understood. To address this, Kumar et al.24 examined the frequency of different T‐cell subsets in individuals with TB‐DM or without coincident DM (NDM) at baseline and at 2 months and 6 months of anti‐TB treatment and found that TB‐DM is characterized by enhanced frequencies of central memory CD4+ and CD8+ T cells and diminished frequencies of naive, effector memory and/or effector CD4+ and CD8+ T cells at baseline and after 2 months of treatment but not following 6 months of treatment, in comparison with TB‐NDM. Central memory CD4+ and CD8+ T‐cell frequencies displayed a positive correlation with fasting blood glucose and HbA1c levels. Hence, DM appears to exert a profound effect on the frequencies of central memory, effector memory and naive T cells, which normalizes following anti‐TB therapy.24
CD8+ T cells are also important producers of pro‐inflammatory cytokines, including type 1 and type 17 cytokines in TB,58 but their contribution to the cytokine environment in TB‐DM co‐morbidity is not known. Similarly, expression of cytotoxic granule release mediators – Perforin, Granzyme B and CD107a – is an important component of the cytotoxic function of these cells.59 CD8+ T cells are known to play a protective role in the immune response to murine TB and M. tuberculosis‐specific CD8+ T cells have also been found in humans.60 These cells have the capacity to activate macrophage defence mechanisms by secreting IFN‐γ and TNF‐α and also help in eliminating the bacteria by the granule exocytosis pathway.41 A recent study to determine the role of these lymphocytes in TB‐DM found elevated frequencies of mycobacterial antigen‐stimulated CD8+ T cells expressing type 1 (IFN‐γ and IL‐2) and type 17 (IL‐17F) cytokines in the TB‐DM group.34 In contrast, the authors also reported that CD8+ T cells were associated with significantly diminished expression of the cytotoxic markers Perforin, Granzyme B and CD107a, both at baseline and following antigen or anti‐CD3 stimulation. The data, therefore, reveal an important association of altered cytotoxic T‐cell potential with the pathogenesis of TB‐DM co‐morbidity.34
One of the major contributing factors for the exaggerated CD4+ and CD8+ T‐cell response in TB‐DM could potentially be due to decreased frequency and function of natural Treg cells. Indeed, Kumar et al.61 have reported a decrease in the frequency of Treg cells in TB‐DM patients compared with those with PTB alone. However, this study failed to address the function of the Treg cells in the periphery. In contrast, Treg cells were found to be increased in frequencies at the site of infection in TB‐DM individuals with enhanced IL‐10 and diminished IFN‐γ production.62 Hence, compartmentalization of Treg cells could potentially be an important driver of the enhanced T‐cell responses in TB‐DM. The overall adaptive immune response evidence suggests that the hyper‐reactive antigen‐specific T‐cell response in TB‐DM is significantly greater than the response of TB‐NDM patients and that this expanded population could possibly contribute to lung pathology in diabetic individuals. This difference from TB‐NDM patients provides indirect support for dysfunctional immunity in DM patients, which leads to TB susceptibility. The effect of DM on CD4+ and CD8+ T cells in PTB is summarized in Fig. 1.
Figure 1.
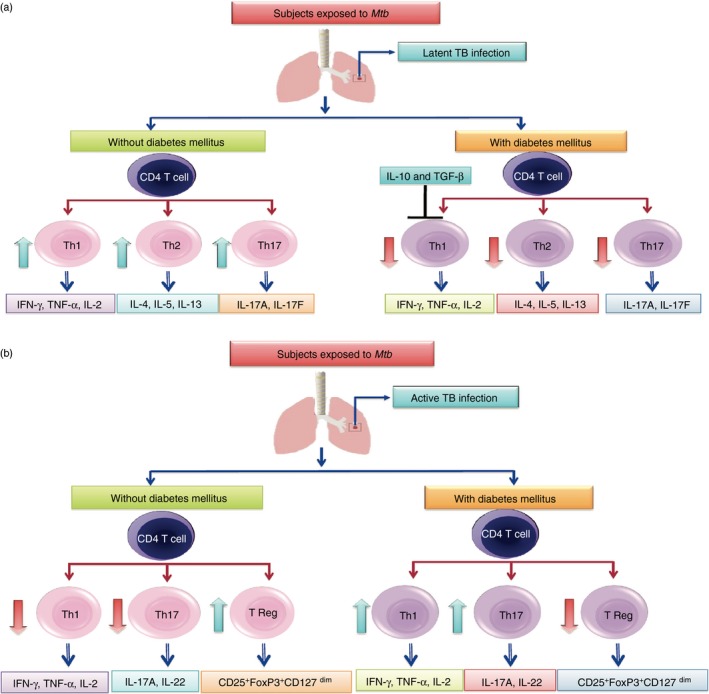
Influence of diabetes mellitus (DM) on latent and active tuberculosis (TB). The CD4+ T‐cell responses to mycobacterial antigens in individuals with latent TB with or without DM is summarized in terms of T helper type 1 (Th1), Th2 and Th17 profiles (a). The CD4+ T‐cell responses to mycobacterial antigens in individuals with active TB with or without DM is summarized in terms of Th1, Th17 and regulatory T (Treg) cell profiles (b).
Latent tuberculosis in DM patients
Type 1 and type 17 cytokines and the IL‐1 family of cytokines are known to influence susceptibility to TB in both humans and animal models.41, 58 Kumar et al.63 postulated that DM could alter the normal homeostatic levels of these cytokines in latent infection. To this end, the authors compared levels of a panel of type 1, type 17, IL‐1 family and other relevant pro‐inflammatory cytokines in individuals with latent infection and coincident DM levels in individuals with latent infection but without DM. They show that LTB‐DM individuals exhibit diminished circulating levels of type 1 (IFN‐γ, IL‐2 and TNF‐α) and type 17 (IL‐17F) cytokines. This was associated with decreased systemic levels of other pro‐inflammatory cytokines (IL‐1β and IL‐18) and the anti‐inflammatory cytokine IL‐10 but not with decreased systemic levels of type 2 cytokines. Moreover, latently infected individuals with DM had diminished levels of spontaneous and M. tuberculosis antigen‐specific levels of type 1 and type 17 cytokines when antigen‐stimulated whole blood was examined.63 Hence, these data on the diminution of pro‐inflammatory cytokine production both at steady state and following antigen stimulation in the context of latent infection potentially suggest a profound impact of DM on immune responses in LTB. This study also examines the important modulatory role played by poor glucose control in latent infection and offers important insights into the potential mechanism by which DM could influence the progression from latent infection to active TB.
A subsequent study of CD4+ cell frequencies in LTB‐DM patients by Kumar et al.64 examined mycobacteria‐induced immune responses in the whole blood of individuals with LTB‐DM and compared them with responses of individuals without DM (LTB‐NDM). Authors of the study show that baseline and antigen‐specific CD4+ T‐cell response from LTB‐DM are characterized by diminished frequencies of mono‐ and dual‐functional CD4+ Th1, Th2 and Th17 cell compared with LTB‐NDM. This alteration was at least partially related to IL‐10 and transforming growth factor‐β, as neutralization of either cytokine resulted in significantly augmented frequencies of Th1 and Th2 cells but not Th17 cells in LTB‐DM individuals. Although CD8+ T cells were originally considered to be less important in the immune response to M. tuberculosis infection, it is now clear that CD8+ T cells play a fundamental role in this immune response.65 Like CD4+ T cells, CD8+ T cells are able to produce IFN‐γ, TNF‐α and IL‐2, which are known to have critical functions during M. tuberculosis infection.65, 66 To explore the influence of DM on CD8+ T‐cell responses during LTB infection, Kumar et al.67 estimated the cytokine and cytotoxic marker expression pattern on CD8+ T cells in individuals with LTB‐DM and compared them with responses of individuals without DM (LTB‐NDM). Individuals with LTB‐DM had diminished frequencies of CD8+ Tc1, Tc2 and Tc17 cells following M. tuberculosis antigen stimulation. In contrast, enhanced frequencies of CD8+ T cells expressing cytotoxic markers were present in LTB‐DM compared with those without DM. In summary, DM alters the immune response in latent TB leading to a suboptimal induction of protective CD4+ and CD8+ T‐cell responses, thereby providing a possible mechanism for increased susceptibility to active disease.
To characterize the phenotypic profile of leucocyte subsets at homeostasis, Kumar et al.14 examined the ex vivo phenotypic profile of T‐cell, B‐cell, DC and monocyte subsets in individuals with LTB and non‐TB‐infected individuals with or without DM (Fig. 2). LTB‐DM individuals exhibited significantly lower frequencies of effector memory CD4+ T cells compared with LTB individuals, whereas NTB‐DM individuals exhibited significantly lower frequencies of naive and central memory CD4+ T cells compared with NTB individuals. In addition, LTB‐DM individuals exhibited significantly higher frequencies of activated memory and atypical B cells but significantly lower frequencies of naive B cells compared with LTB individuals. On the other hand, NTB‐DM individuals exhibited significantly lower frequencies of naive and immature B cells compared with NTB individuals. LTB‐DM and NTB‐DM individuals exhibited significantly lower frequencies of both myeloid DC and plasmacytoid DC compared with LTB and NTB individuals. Finally, both LTB‐DM and NTB‐DM exhibited significantly lower frequencies of classical and intermediate monocytes and significantly higher frequencies of non‐classical monocytes in comparison to LTB and NTB individuals. This suggests that although the effect of coincident DM on phenotypic profile of T‐cell and B‐cell subsets is only moderate, it profoundly alters the frequencies of monocyte and DC subsets in LTB.14
Figure 2.
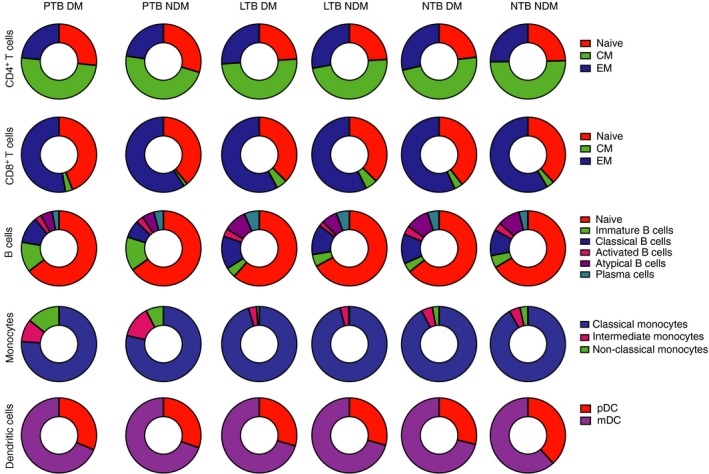
Alterations in the frequencies of CD4+ T‐cell, CD8+ T‐cell, B‐cell, monocyte and dendritic cell subsets in tuberculosis‐diabetes (TB‐DM) co‐morbidity. Frequency distribution of CD4+ naive, central memory (CM) or effector memory (EM) subsets in active pulmonary TB with DM (PTB‐DM) or without DM (PTB‐NDM); latent TB with DM (LTB‐DM) or without DM (LTB‐NDM) and no TB with DM (NTB‐DM) or without DM (NTB‐NDM) is depicted as pie‐charts. Similarly, frequency distributions of CD8+ T‐cell subsets, B‐cell subsets, monocyte subsets and dendritic cell subsets are also depicted.
In diabetic people, progression of freshly acquired infection to TB disease could result from impaired sentinel function of alveolar macrophages regardless of previous exposure. Although this mechanism has not yet been studied directly, evidence that 10–20% of patients with LTB have a peripheral blood transcriptional signature of active TB disease68 supports the idea that a subgroup of people with LTB may have clinically imperceptible but biologically active foci of infection at high risk for progression to clinically evident TB. It will be interesting to see if DM increases the occurrence of active TB peripheral blood transcriptional signatures in LTB.
Effect of pre‐diabetes in TB patients
Pre‐diabetes (PDM) or intermediate hyperglycaemia is a high risk state for DM that is defined by glucose values that are higher than normal, but lower than diabetic thresholds.69 The prevalence of PDM is increasing worldwide, and it is estimated that over 470 million people will have PDM by 2030.70 PDM is linked with the coexisting insulin resistance and pancreatic β‐cell dysfunction – with both abnormalities apparent before changes in glycaemic control are detectable.69, 71 An association of PDM with TB risk is not understood but would not be surprising in the light of clinical evidence linking susceptibility to poor glycaemic control.72 TB disease might promote insulin resistance and induce PDM as a consequence of inflammatory stress. In that scenario, TB would represent a significant factor contributing to disordered glucose metabolism with implications for bi‐directional screening.73, 74 Pre‐diabetes could develop as an effect rather than a cause of TB, or TB risk might be increased in individuals with PDM by a factor other than hyperglycaemia, such as dyslipidaemia. Pre‐DM is also associated with the presence of insulin resistance and B‐cell dysfunction – abnormalities that start before changes in blood glucose levels become detectable.75 To understand the impact of PDM in active PTB, Kumar et al.76 examined levels of a large panel of type 1, type 2, type 17, regulatory and other pro‐inflammatory cytokines in individuals with active TB and coincident PDM, and compared them with those in individuals with active TB but without DM. The authors found that TB with PDM is characterized by elevated circulating levels of type 1 and type 17 and other pro‐inflammatory and anti‐inflammatory cytokines, indicating that a balanced pro‐ and anti‐inflammatory cytokine milieu is a feature of PDM‐TB co‐morbidity.76
To further characterize the role of CD4+ and CD8+ T‐cell cytokines in LTB with coincident PDM, Kumar et al.77 studied the baseline, mycobacterial antigen and mitogen‐stimulated T‐cell cytokine responses in LTB individuals with (LTB‐PDM) or without (LTB‐NDM) concomitant PDM. The authors found that LTB‐PDM is characterized by diminished frequencies of mono‐ and dual functional CD4+ Th1, Th2 and Th17 cells at baseline and following mycobacterial antigen stimulation in comparison with LTB‐NDM. LTB‐PDM is also characterized by diminished frequencies of single producing CD8+ Tc1, Tc2 and Tc17 cells at baseline and following M. tuberculosis antigen stimulation in comparison with LTB‐NDM. LTB‐PDM is therefore characterized by diminished frequencies of Th1/Tc1, Th2/Tc2 and Th17/Tc17 cells, indicating that PDM is associated with alterations of the immune response in latent TB leading to compromised CD4+ and CD8+ T‐cell function. Our data also suggest that this interaction might also have an effect on TB disease, potentially shifting the balance of metabolic regulation from PDM to overt DM.
Biomarkers associated with TB‐DM co‐morbidity
To understand the pathogenesis in TB with DM, Andrade et al.,78 performed an exploratory study assessing a series of biological parameters like haem oxygenase‐1 (HO‐1), acute phase proteins, tissue metalloproteinases and tissue inhibitors of metalloproteinase (TIMPs) as well as cytokines and chemokines. Cross‐sectional analyses were performed in plasma samples from individuals with active PTB or with coincident TB and DM from South India. Compared with patients with TB without DM, those with coincident DM exhibited increased M. tuberculosis bacillary loads in sputum. Plasma levels of HO‐1 but not of other acute phase proteins were higher in patients with TB and DM than in patients without DM, independent of bacillary sputum loads. HO‐1 concentrations also positively correlated with random plasma glucose, circulating glycosylated haemoglobin and low‐density lipoprotein levels. Moreover, patients with coincident TB and DM exhibited increased plasma levels of tissue inhibitor of metalloproteinase (TIMP‐4) and elevated peripheral blood neutrophil counts, which, when considered together with HO‐1, resulted in increased power to discriminate individuals with active TB with and without DM. The authors conclude that elevated plasma levels of HO‐1 and TIMP‐4, in addition to increased absolute neutrophil counts in the blood, are potential markers of pathogenesis in TB with DM.78
TB‐DM co‐morbidity is characterized by increased inflammation with elevated circulating levels of inflammatory cytokines and other angiogenic factors are also intricately involved in the angiogenesis‐inflammation nexus. To study the association of angiogenic factors with TB‐DM, Kumar et al.79 examined the systemic levels of angiogenic factors like vascular endothelial growth factor A (VEGF‐A), VEGF‐C, VEGF‐D, VEGF‐R1, VEGF‐R2 and VEGF‐R3 and angiopoietins like angiopoietin 1, angiopoietin 2 and Tie 2 receptor (unpublished data) in individuals with either TB‐DM or TB alone. All the angiogenic factors were significantly higher in TB‐DM compared with TB individuals, whereas in contrast angiopoietins like angiopoietin 1 and angiopoietin 2 were significantly diminished in TB‐DM compared with TB individuals (unpublished data). Moreover, the levels of VEGF‐A, ‐C, ‐R2 and/or ‐R3 were significantly enhanced in TB‐DM with bilateral or cavitary disease or with haemoptysis, suggesting an involvement with both disease severity and adverse clinical presentation. The levels of these angiogenic factors also revealed a significant positive relationship with bacterial burdens and HbA1c levels. Finally, the circulating levels of angiogenic factors were significantly diminished and in contrast angiopoietins were increased (unpublished data) following successful anti‐TB treatment at 6 months. The authors suggest that the factors mentioned above could serve as accurate biomarkers for monitoring therapeutic responses in TB‐DM co‐morbidity.79
The term adipocytokine is used to describe cytokines that are mostly produced by adipose tissue. The adipocytokines, adiponectin and leptin have been defined as the most essential adipocyte products, thereby redefining adipose tissue as a key element not only of the endocrine system, but also of the immune system.80 Adipose tissue is a central inflammatory source in obesity and type 2 DM, not only because of cytokines produced from the adipocyte itself, but also because of infiltration by pro‐inflammatory macrophages.80, 81 To study the influence of DM on active PTB and LTB, Kumar et al.82 examined circulating levels of adipocytokines in the plasma of individuals with PTB‐DM or LTB‐DM and compared them with those without DM (PTB or LTB). PTB‐DM or LTB‐DM is characterized by diminished circulating levels of adiponectin and adipsin and/or heightened circulating levels of leptin, visfatin and PAI‐1. In addition, adiponectin and adipsin display a significant negative correlation, whereas leptin, visfatin and plasminogen activator inhibitor‐1 (PAI‐1) show a significant positive correlation with HbA1C levels and random blood glucose levels. The authors suggest that alterations in the systemic levels of adipocytokines indicate that altered adipose tissue inflammation underlying type 2 DM potentially contributes to the pathogenesis of TB disease.82
The IL‐20 subfamily of cytokines consists of five members: IL‐19, IL‐20, IL‐22, IL‐24 and IL‐26 and they play an important role in both host defence mechanisms and glucose metabolism. The IL‐20 subfamily of cytokines exerts profound effects on host innate immune responses, including promoting the production of antimicrobial peptides, strengthening barrier function at epithelial and mucosal surfaces and facilitating recruitment of leucocytes and their activation at the site of inflammation.83, 84, 85 Since the interface between TB and DM involves both of the above processes, Kumar et al.86 examined the relationship of the IL‐20 subfamily of cytokines in TB‐DM co‐morbidity. They examined circulating plasma cytokine levels in individuals with PTB‐DM or LTB‐DM and compared them with those without DM (PTB or LTB). PTB‐DM is characterized by diminished circulating levels of IL‐19, IL‐20, IL‐22 and IL‐24 but increased levels of IL‐10. Similarly, LTB‐DM was also characterized by diminished circulating levels of IL‐10, IL‐19, IL‐20 and IL‐24 but increased levels of IL‐22. Moreover, there was a significant negative correlation of IL‐10, IL‐19, IL‐20, IL‐22 and IL‐24 levels with haemoglobin A1C (HbA1c) levels in both PTB and/or LTB individuals. Coincident DM in either PTB or LTB was characterized by diminished production of the IL‐20 subfamily of cytokines, which suggests that the IL‐20 subfamily of cytokines is associated with the regulation of both host immunity and metabolic processes in the context of co‐morbidity.86
The blood transcriptome offers a glimpse of immunological events in the lung and a consensus gene expression signature of active TB is evolving from observational studies in non‐diabetic TB patients in Africa, China, Europe and Indonesia.87 To gain insights into mechanisms of TB susceptibility in human DM and to assess the impact of TB disease on diabetic complications, we leveraged data and blood samples from TB‐DM and TB‐NDM patients. The authors performed an integrative analysis of whole blood gene expression and plasma analytes, comparing South Indian TB patients with and without DM to diabetic and non‐diabetic individuals without TB. Integrative analysis showed a high degree of comparability in the blood transcriptional response to TB between diabetic and non‐diabetic participants but a distinct signature of plasma cytokine and growth factor levels and an association of TB‐DM with neutrophilic inflammation.88 The data further show that co‐morbid TB activates a range of pathways associated with diabetic complications, above the levels observed with DM alone. Hence, neutrophilic inflammation and diabetic complication pathways may be useful targets for host‐directed therapies to improve TB treatment and outcomes in this growing patient population.88
Immunological mechanisms of susceptibility in animal models
Several studies have shown increased susceptibility to TB in animal models of TB‐DM co‐morbidity. Saiki et al.89 used streptozotocin to exhaust insulin‐producing cells and cause hyperglycaemia. High doses of M. tuberculosis Schacht were administered intravenously to hyperglycaemic mice and untreated controls and after 3 months post infection, > 90% of hyperglycaemic mice had died versus < 10% of the euglycaemic controls.89 To examine the TB susceptibility, Martens et al.90 used streptozotocin‐treated C57BL/6 mice that were hyperglycaemic for < 4 weeks (acute) or > 12 weeks (chronic) before low‐dose aerosol challenge with M. tuberculosis Erdman. Chronic diabetic mice displayed >1 log higher bacterial burden and more inflammation in the lung compared with euglycaemic mice. The adaptive immunity was delayed in mice with chronic DM and showed a reduced expression of IFN‐γ in the lung and fewer M. tuberculosis antigen‐specific (ESAT‐6) T‐cell responses compared with euglycaemic mice during the first month of infection. However, after 2 months of TB disease, pro‐inflammatory cytokine levels were significantly enhanced in chronic diabetic mice compared with euglycaemic mice. Also, hyperglycaemic mice displayed enhanced absolute numbers of CD4+ and CD8+ T cells, macrophages and neutrophils in the lung during 16 weeks post infection compared with euglycaemic controls.90 Vallerskog et al.91 tested the hypothesis that DM leads to delayed priming of adaptive immunity in the lung‐draining lymph nodes following low‐dose aerosol challenge with virulent M. tuberculosis. The authors demonstrated that M. tuberculosis antigen‐specific IFN‐γ production by T cells takes place at a later stage with a delay in recruitment of these cells to the lung in the lymph nodes of diabetic mice compared with control mice. Dissemination of M. tuberculosis from lung to lymph nodes was also delayed in diabetic mice, although they showed no defect in DC trafficking from lung to lymph nodes after lipopolysaccharide stimulation. Hence, authors concluded that late delivery of antigen‐bearing antigen‐presenting cells to the lung‐draining lymph nodes and delayed priming of the adaptive immune response occur in the presence of DM and this results in delayed initiation of the immune responses necessary to confine M. tuberculosis replication.91
As DM is associated with increased inflammation and susceptibility to TB and overproduction of several T‐cell‐associated cytokines has been reported both in animal and human experiments, Martinez et al.92 investigated the effects of hyperglycaemia on T‐cell responses upon T‐cell receptor stimulation in the absence of infection. The authors of the study report that T cells from hyperglycaemia have heightened proliferation and cytokine production in response to anti‐CD3e monoclonal antibody or antigen stimulation and they also report that naive T cells from mice with chronic hyperglycaemia have a significantly increased frequency of decondensed nuclei, after primary activation on initial encounter with antigen. They therefore, propose that chronic hyperglycaemia causes epigenetic modification of naive T cells by a p38 mitogen‐activated protein kinase‐dependent chromatin decondensation and that this mechanism may contribute to pathological inflammation associated with DM.92 Subsequently, Martinez et al.93 also tested whether alveolar macrophages from diabetic mice would phagocytose M. tuberculosis ex vivo. Alveolar macrophages from diabetic mice had diminished expression of CD14 and also displayed reduced phagocytosis of M. tuberculosis.93 Similarly, in a diet‐induced model of type 2 DM, the authors observed that macrophages from diabetic mice exhibited reduced phagocytosis of mycolic‐acid‐coated beads, reduced internalization and killing of mycobacteria and altered cytokine responses.94
Cheekatla et al.95 developed a mouse model of DM using streptozotocin and nicotinamide factors, which increase the susceptibility of diabetic mice during M. tuberculosis challenge. Using this model, the authors report that NK and CD11c+ cell interactions in M. tuberculosis‐infected diabetic mice displayed augmented IL‐6 production and reduced survival of M. tuberculosis ‐infected diabetic mice.95 In another study, Podell et al.96 developed a guinea pig model of type 2 DM‐TB co‐morbidity to study TB‐DM interactions because unlike murine models, lipid metabolism in the guinea pig more closely resembles that of humans, making it ideal for studying M. tuberculosis infection. The authors report that M. tuberculosis infection of diabetic guinea pigs resulted in severe TB with reduced survival and a higher bacterial burden compared with non‐diabetic controls and also displayed an exacerbated pro‐inflammatory cytokine and chemokine response in the lung and spleen. These results suggest that a guinea pig model of type 2 DM‐TB co‐morbidity will be helpful in understanding the complex pathogenesis of TB in patients with DM.96
Conclusions
The human data from TB‐DM studies suggest an impaired innate immune response to M. tuberculosis, followed by hyper‐reactive adaptive immune responses. Our review has summarized the immunological alterations in PTB‐DM and LTB‐DM (Fig. 3). The severity of TB disease increasing the risk of DM creates a significant negative impact on public health, especially in the countries where both diseases are highly endemic. Very few human studies have been performed in this area and the few that have been done provide important insights into the influence of poorly controlled type 2 DM on the pathogenesis of TB, supporting the effects of an excessive but otherwise intact adaptive immune response to M. tuberculosis during DM. These studies provide a rational basis for testing combined antimicrobial and anti‐inflammatory therapies in diabetic patients with TB. A better understanding of the immunological basis of TB susceptibility in DM will help in the rational development of therapeutic strategies to alleviate the dual burden of these diseases.
Figure 3.
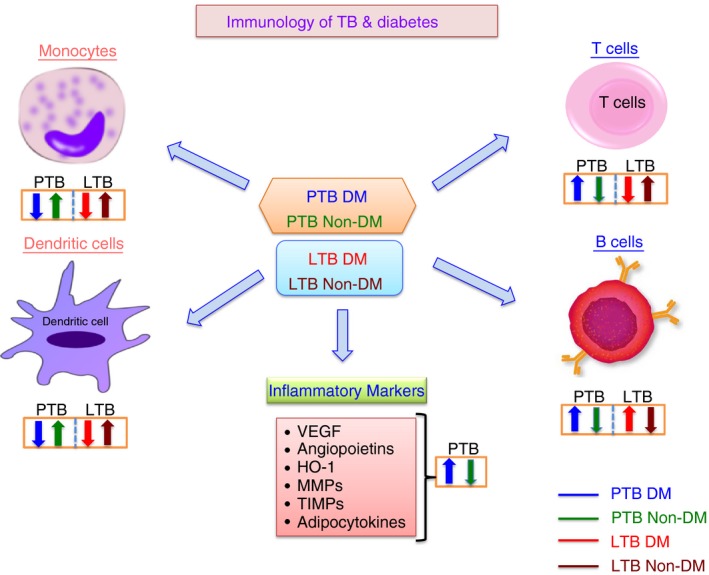
Summary of the immunological interactions between tuberculosis (TB) and diabetes (DM). The effects of DM on the different arms of the innate and adaptive immune systems is represented by arrows indicating increased or decreased function compared with healthy control individuals.
Disclosures
There are no competing interests.
Acknowledgements
We would like to thank Dr Thomas Nutman of LPD, NIAID, NIH for his continued support. We would also like to thank the members of the Chennai ICER programme for their contributions towards this work.
References
- 1. Dooley KE, Chaisson RE. Tuberculosis and diabetes mellitus: convergence of two epidemics. Lancet Infect Dis 2009; 9:737–46. [DOI] [PMC free article] [PubMed] [Google Scholar]
- 2. Jeon CY, Murray MB. Diabetes mellitus increases the risk of active tuberculosis: a systematic review of 13 observational studies. PLoS Med 2008; 5:e152. [DOI] [PMC free article] [PubMed] [Google Scholar]
- 3. Baker MA, Harries AD, Jeon CY, Hart JE, Kapur A, Lönnroth K et al The impact of diabetes on tuberculosis treatment outcomes: a systematic review. BMC Med 2011; 9:81. [DOI] [PMC free article] [PubMed] [Google Scholar]
- 4. Viswanathan V, Kumpatla S, Aravindalochanan V, Rajan R, Chinnasamy C, Srinivasan R et al Prevalence of diabetes and pre‐diabetes and associated risk factors among tuberculosis patients in India. PLoS One 2012; 7:e41367. [DOI] [PMC free article] [PubMed] [Google Scholar]
- 5. Balakrishnan S, Vijayan S, Nair S, Subramoniapillai J, Mrithyunjayan S, Wilson N et al High diabetes prevalence among tuberculosis cases in Kerala, India. PLoS One 2012; 7:e46502. [DOI] [PMC free article] [PubMed] [Google Scholar]
- 6. Martinez N, Kornfeld H. Diabetes and immunity to tuberculosis. Eur J Immunol 2014; 44:617–26. [DOI] [PMC free article] [PubMed] [Google Scholar]
- 7. Restrepo BI, Schlesinger LS. Host–pathogen interactions in tuberculosis patients with type 2 diabetes mellitus. Tuberculosis 2013; 93 Suppl:S10–4. [DOI] [PMC free article] [PubMed] [Google Scholar]
- 8. Ponce‐De‐Leon A, Garcia‐Garcia Md Mde L, Garcia‐Sancho MC, Gomez‐Perez FJ, Valdespino‐Gomez JL, Olaiz‐Fernandez G et al Tuberculosis and diabetes in southern Mexico. Diabetes Care 2004; 27:1584–90. [DOI] [PubMed] [Google Scholar]
- 9. Geerlings SE, Hoepelman AI. Immune dysfunction in patients with diabetes mellitus (DM). FEMS Immunol Med Microbiol 1999; 26:259–65. [DOI] [PubMed] [Google Scholar]
- 10. Nikolajczyk BS, Jagannathan‐Bogdan M, Shin H, Gyurko R. State of the union between metabolism and the immune system in type 2 diabetes. Genes Immun 2011; 12:239–50. [DOI] [PMC free article] [PubMed] [Google Scholar]
- 11. Pickup JC, Crook MA. Is type II diabetes mellitus a disease of the innate immune system? Diabetologia 1998; 41:1241–8. [DOI] [PubMed] [Google Scholar]
- 12. Schlesinger LS, Bellinger‐Kawahara CG, Payne NR, Horwitz MA. Phagocytosis of Mycobacterium tuberculosis is mediated by human monocyte complement receptors and complement component C3. J Immunol 1990; 144:2771–80. [PubMed] [Google Scholar]
- 13. Gomez DI, Twahirwa M, Schlesinger LS, Restrepo BI. Reduced Mycobacterium tuberculosis association with monocytes from diabetes patients that have poor glucose control. Tuberculosis 2013; 93:192–7. [DOI] [PMC free article] [PubMed] [Google Scholar]
- 14. Kumar NP, Moideen K, Dhakshinraj SD, Banurekha VV, Nair D, Dolla C et al Profiling leucocyte subsets in tuberculosis‐diabetes co‐morbidity. Immunology 2015; 146:243–50. [DOI] [PMC free article] [PubMed] [Google Scholar]
- 15. Kumar NP, Moideen K, Sivakumar S, Menon PA, Viswanathan V, Kornfeld H et al Modulation of dendritic cell and monocyte subsets in tuberculosis‐diabetes co‐morbidity upon standard tuberculosis treatment. Tuberculosis 2016; 101:191–200. [DOI] [PMC free article] [PubMed] [Google Scholar]
- 16. Stew SS, Martinez PJ, Schlesinger LS, Restrepo BI. Differential expression of monocyte surface markers among TB patients with diabetes co‐morbidity. Tuberculosis 2013; 93 Suppl:S78–82. [DOI] [PMC free article] [PubMed] [Google Scholar]
- 17. Wang CH, Yu CT, Lin HC, Liu CY, Kuo HP. Hypodense alveolar macrophages in patients with diabetes mellitus and active pulmonary tuberculosis. Tuber Lung Dis 1999; 79:235–42. [DOI] [PubMed] [Google Scholar]
- 18. Arce‐Mendoza A, Rodriguez‐de Ita J, Salinas‐Carmona MC, Rosas‐Taraco AG. Expression of CD64, CD206, and RAGE in adherent cells of diabetic patients infected with Mycobacterium tuberculosis . Arch Med Res 2008; 39:306–11. [DOI] [PubMed] [Google Scholar]
- 19. Lachmandas E, Vrieling F, Wilson LG, Joosten SA, Netea MG, Ottenhoff TH et al The effect of hyperglycaemia on in vitro cytokine production and macrophage infection with Mycobacterium tuberculosis . PLoS One 2015; 10:e0117941. [DOI] [PMC free article] [PubMed] [Google Scholar]
- 20. Andrade BB, Kumar NP, Sridhar R, Banurekha VV, Jawahar MS, Nutman TB et al Heightened plasma levels of heme oxygenase‐1 and tissue inhibitor of metalloproteinase‐4 as well as elevated peripheral neutrophil counts are associated with TB‐diabetes comorbidity. Chest 2014; 145:1244–54. [DOI] [PMC free article] [PubMed] [Google Scholar]
- 21. Khader SA, Partida‐Sanchez S, Bell G, Jelley‐Gibbs DM, Swain S, Pearl JE et al Interleukin 12p40 is required for dendritic cell migration and T cell priming after Mycobacterium tuberculosis infection. J Exp Med 2006; 203:1805–15. [DOI] [PMC free article] [PubMed] [Google Scholar]
- 22. Holt PG, Schon‐Hegrad MA. Localization of T cells, macrophages and dendritic cells in rat respiratory tract tissue: implications for immune function studies. Immunology 1987; 62:349–56. [PMC free article] [PubMed] [Google Scholar]
- 23. Sertl K, Takemura T, Tschachler E, Ferrans VJ, Kaliner MA, Shevach EM. Dendritic cells with antigen‐presenting capability reside in airway epithelium, lung parenchyma, and visceral pleura. J Exp Med 1986; 163:436–51. [DOI] [PMC free article] [PubMed] [Google Scholar]
- 24. Kumar NP, Moideen K, Viswanathan V, Kornfeld H, Babu S. Effect of standard tuberculosis treatment on naive, memory and regulatory T‐cell homeostasis in tuberculosis‐diabetes co‐morbidity. Immunology 2016; 149:87–97. [DOI] [PMC free article] [PubMed] [Google Scholar]
- 25. Lowe DM, Redford PS, Wilkinson RJ, O'Garra A, Martineau AR. Neutrophils in tuberculosis: friend or foe? Trends Immunol 2012; 33:14–25. [DOI] [PubMed] [Google Scholar]
- 26. Eruslanov EB, Lyadova IV, Kondratieva TK, Majorov KB, Scheglov IV, Orlova MO et al Neutrophil responses to Mycobacterium tuberculosis infection in genetically susceptible and resistant mice. Infect Immun 2005; 73:1744–53. [DOI] [PMC free article] [PubMed] [Google Scholar]
- 27. Nandi B, Behar SM. Regulation of neutrophils by interferon‐γ limits lung inflammation during tuberculosis infection. J Exp Med 2011; 208:2251–62. [DOI] [PMC free article] [PubMed] [Google Scholar]
- 28. Berry MP, Graham CM, McNab FW, Xu Z, Bloch SA, Oni T et al An interferon‐inducible neutrophil‐driven blood transcriptional signature in human tuberculosis. Nature 2010; 466:973–7. [DOI] [PMC free article] [PubMed] [Google Scholar]
- 29. Raposo‐Garcia S, Guerra‐Laso JM, García‐García S, Juan‐García J, López‐Fidalgo E, Diez‐Tascón C et al Immunological response to Mycobacterium tuberculosis infection in blood from type 2 diabetes patients. Immunol Lett 2017; 186:41–5. [DOI] [PubMed] [Google Scholar]
- 30. Mendoza‐Aguilar M, Garcia‐Elorriaga G, Arce‐Paredes P, Gonzalez‐Bonilla C, Del Rey‐Pineda G, Rojas‐Espinosa O. Functional state analysis of phagocytic cells of patients with type 2 diabetes and pulmonary tuberculosis. Clin Lab 2012; 58:299–305. [PubMed] [Google Scholar]
- 31. Moretta L, Moretta A. Unravelling natural killer cell function: triggering and inhibitory human NK receptors. EMBO J 2004; 23:255–9. [DOI] [PMC free article] [PubMed] [Google Scholar]
- 32. Gupta A, Kaul A, Tsolaki AG, Kishore U, Bhakta S. Mycobacterium tuberculosis: immune evasion, latency and reactivation. Immunobiology 2012; 217:363–74. [DOI] [PubMed] [Google Scholar]
- 33. Vankayalapati R, Barnes PF. Innate and adaptive immune responses to human Mycobacterium tuberculosis infection. Tuberculosis 2009; 89(Suppl 1):S77–80. [DOI] [PubMed] [Google Scholar]
- 34. Kumar NP, Sridhar R, Nair D, Banurekha VV, Nutman TB, Babu S. Type 2 diabetes mellitus is associated with altered CD8 T and NK cell function in pulmonary tuberculosis. Immunology 2015; 144:677–86. [DOI] [PMC free article] [PubMed] [Google Scholar]
- 35. Zhang C, Song X, Zhao Y, Zhang H, Zhao S, Mao F et al Mycobacterium tuberculosis secreted proteins as potential biomarkers for the diagnosis of active tuberculosis and latent tuberculosis infection. J Clin Lab Anal 2015; 29:375–82. [DOI] [PMC free article] [PubMed] [Google Scholar]
- 36. Rivas‐Santiago B, Serrano CJ, Enciso‐Moreno JA. Susceptibility to infectious diseases based on antimicrobial peptide production. Infect Immun 2009; 77:4690–5. [DOI] [PMC free article] [PubMed] [Google Scholar]
- 37. Hancock RE, Sahl HG. Antimicrobial and host‐defense peptides as new anti‐infective therapeutic strategies. Nat Biotechnol 2006; 24:1551–7. [DOI] [PubMed] [Google Scholar]
- 38. Silva JP, Appelberg R, Gama FM. Antimicrobial peptides as novel anti‐tuberculosis therapeutics. Biotechnol Adv 2016; 34:924–40. [DOI] [PubMed] [Google Scholar]
- 39. Hancock RE, Haney EF, Gill EE. The immunology of host defence peptides: beyond antimicrobial activity. Nat Rev Immunol 2016; 16:321–34. [DOI] [PubMed] [Google Scholar]
- 40. Gonzalez‐Curiel I, Castañeda‐Delgado J, Lopez‐Lopez N, Araujo Z, Hernandez‐Pando R, Gandara‐Jasso B et al Differential expression of antimicrobial peptides in active and latent tuberculosis and its relationship with diabetes mellitus. Hum Immunol 2011; 72:656–62. [DOI] [PubMed] [Google Scholar]
- 41. Cooper AM. Cell‐mediated immune responses in tuberculosis. Annu Rev Immunol 2009; 27:393–422. [DOI] [PMC free article] [PubMed] [Google Scholar]
- 42. Cooper AM, Khader SA. The role of cytokines in the initiation, expansion, and control of cellular immunity to tuberculosis. Immunol Rev 2008; 226:191–204. [DOI] [PMC free article] [PubMed] [Google Scholar]
- 43. Cooper AM, Dalton DK, Stewart TA, Griffin JP, Russell DG, Orme IM. Disseminated tuberculosis in interferon γ gene‐disrupted mice. J Exp Med 1993; 178:2243–7. [DOI] [PMC free article] [PubMed] [Google Scholar]
- 44. Cooper AM, Magram J, Ferrante J, Orme IM. Interleukin 12 (IL‐12) is crucial to the development of protective immunity in mice intravenously infected with mycobacterium tuberculosis. J Exp Med 1997; 186:39–45. [DOI] [PMC free article] [PubMed] [Google Scholar]
- 45. Flynn JL, Chan J, Triebold KJ, Dalton DK, Stewart TA, Bloom BR. An essential role for interferon γ in resistance to Mycobacterium tuberculosis infection. J Exp Med 1993; 178:2249–54. [DOI] [PMC free article] [PubMed] [Google Scholar]
- 46. Keane J, Gershon S, Wise RP, Mirabile‐Levens E, Kasznica J, Schwieterman WD et al Tuberculosis associated with infliximab, a tumor necrosis factor α‐neutralizing agent. N Engl J Med 2001; 345:1098–104. [DOI] [PubMed] [Google Scholar]
- 47. Khader SA, Bell GK, Pearl JE, Fountain JJ, Rangel‐Moreno J, Cilley GE et al IL‐23 and IL‐17 in the establishment of protective pulmonary CD4+ T cell responses after vaccination and during Mycobacterium tuberculosis challenge. Nat Immunol 2007; 8:369–77. [DOI] [PubMed] [Google Scholar]
- 48. Khader SA, Guglani L, Rangel‐Moreno J, Gopal R, Junecko BA, Fountain JJ et al IL‐23 is required for long‐term control of Mycobacterium tuberculosis and B cell follicle formation in the infected lung. J Immunol 2011; 187:5402–7. [DOI] [PMC free article] [PubMed] [Google Scholar]
- 49. Cooper AM, Mayer‐Barber KD, Sher A. Role of innate cytokines in mycobacterial infection. Mucosal Immunol 2011; 4:252–60. [DOI] [PMC free article] [PubMed] [Google Scholar]
- 50. Restrepo BI, Fisher‐Hoch SP, Pino PA, Salinas A, Rahbar MH, Mora F et al Tuberculosis in poorly controlled type 2 diabetes: altered cytokine expression in peripheral white blood cells. Clin Infect Dis 2008; 47:634–41. [DOI] [PMC free article] [PubMed] [Google Scholar]
- 51. Kumar NP, Sridhar R, Banurekha VV, Jawahar MS, Nutman TB, Babu S. Expansion of pathogen‐specific T‐helper 1 and T‐helper 17 cells in pulmonary tuberculosis with coincident type 2 diabetes mellitus. J Infect Dis 2013; 208:739–48. [DOI] [PMC free article] [PubMed] [Google Scholar]
- 52. Kumar NP, Sridhar R, Banurekha VV, Jawahar MS, Fay MP, Nutman TB et al Type 2 diabetes mellitus coincident with pulmonary tuberculosis is associated with heightened systemic type 1, type 17, and other proinflammatory cytokines. Ann Am Thorac Soc 2013; 10:441–9. [DOI] [PMC free article] [PubMed] [Google Scholar]
- 53. Walsh MC, Camerlin AJ, Miles R, Pino P, Martinez P, Mora‐Guzmán F et al The sensitivity of interferon‐gamma release assays is not compromised in tuberculosis patients with diabetes. Int J Tuberc Lung Dis 2011; 15:179–84, i–iii. [PMC free article] [PubMed] [Google Scholar]
- 54. Gan SH, KhinMar KW, Barkham TM, Koh CK, Shen L, Wang YT et al Interferon‐γ responses to Mycobacterium tuberculosis‐specific antigens in diabetes mellitus. Eur Respir J 2014; 44:805–8. [DOI] [PubMed] [Google Scholar]
- 55. Stalenhoef JE, Alisjahbana B, Nelwan EJ, van der Ven‐Jongekrijg J, Ottenhoff TH, van der Meer JW et al The role of interferon‐γ in the increased tuberculosis risk in type 2 diabetes mellitus. Eur J Clin Microbiol Infect Dis 2008; 27:97–103. [DOI] [PubMed] [Google Scholar]
- 56. Faurholt‐Jepsen D, Aabye MG, Jensen AV, Range N, Praygod G, Jeremiah K et al Diabetes is associated with lower tuberculosis antigen‐specific interferon gamma release in Tanzanian tuberculosis patients and non‐tuberculosis controls. Scand J Infect Dis 2014; 46:384–91. [DOI] [PubMed] [Google Scholar]
- 57. Seder RA, Darrah PA, Roederer M. T‐cell quality in memory and protection: implications for vaccine design. Nat Rev Immunol 2008; 8:247–58. [DOI] [PubMed] [Google Scholar]
- 58. O'Garra A, Redford PS, McNab FW, Bloom CI, Wilkinson RJ, Berry MP. The immune response in tuberculosis. Annu Rev Immunol 2013; 31:475–527. [DOI] [PubMed] [Google Scholar]
- 59. Cullen SP, Martin SJ. Mechanisms of granule‐dependent killing. Cell Death Differ 2008; 15:251–62. [DOI] [PubMed] [Google Scholar]
- 60. North RJ, Jung YJ. Immunity to tuberculosis. Annu Rev Immunol 2004; 22:599–623. [DOI] [PubMed] [Google Scholar]
- 61. Kumar NP, Sridhar R, Banurekha VV, Jawahar MS, Nutman TB, Babu S. Expansion of pathogen‐specific T‐helper 1 and T‐helper 17 cells in pulmonary tuberculosis with coincident type 2 diabetes mellitus. J Infect Dis 2013; 208:739–48. [DOI] [PMC free article] [PubMed] [Google Scholar]
- 62. Sun Q, Zhang Q, Xiao H, Cui H, Su B. Significance of the frequency of CD4+ CD25+ CD127– T‐cells in patients with pulmonary tuberculosis and diabetes mellitus. Respirology 2012; 17:876–82. [DOI] [PubMed] [Google Scholar]
- 63. Kumar NP, George PJ, Kumaran P, Dolla CK, Nutman TB, Babu S. Diminished systemic and antigen‐specific type 1, type 17, and other proinflammatory cytokines in diabetic and prediabetic individuals with latent Mycobacterium tuberculosis infection. J Infect Dis 2014; 210:1670–8. [DOI] [PMC free article] [PubMed] [Google Scholar]
- 64. Kumar NP, Moideen K, George PJ, Dolla C, Kumaran P, Babu S. Coincident diabetes mellitus modulates Th1‐, Th2‐, and Th17‐cell responses in latent tuberculosis in an IL‐10‐ and TGF‐β‐dependent manner. Eur J Immunol 2016; 46:390–9. [DOI] [PMC free article] [PubMed] [Google Scholar]
- 65. Lin PL, Flynn JL. CD8 T cells and Mycobacterium tuberculosis infection. Semin Immunopathol 2015; 37:239–49. [DOI] [PMC free article] [PubMed] [Google Scholar]
- 66. Grotzke JE, Lewinsohn DM. Role of CD8+ T lymphocytes in control of Mycobacterium tuberculosis infection. Microbes Infect 2005; 7:776–88. [DOI] [PubMed] [Google Scholar]
- 67. Kumar NP, Moideen K, George PJ, Dolla C, Kumaran P, Babu S. Impaired cytokine but enhanced cytotoxic marker expression in Mycobacterium tuberculosis‐induced CD8+ T cells in individuals with type 2 diabetes and latent Mycobacterium tuberculosis infection. J Infect Dis 2016; 213:866–70. [DOI] [PMC free article] [PubMed] [Google Scholar]
- 68. Berry MP, Graham CM, McNab FW, Xu Z, Bloch SA, Oni T et al An interferon‐inducible neutrophil‐driven blood transcriptional signature in human tuberculosis. Nature 2010; 466:973–7. [DOI] [PMC free article] [PubMed] [Google Scholar]
- 69. Tabak AG, Herder C, Rathmann W, Brunner EJ, Kivimaki M. Prediabetes: a high‐risk state for diabetes development. Lancet 2013; 379:2279–90. [DOI] [PMC free article] [PubMed] [Google Scholar]
- 70. Whiting DR, Guariguata L, Weil C, Shaw J. IDF diabetes atlas: global estimates of the prevalence of diabetes for 2011 and 2030. Diabetes Res Clin Pract 2011; 94:311–21. [DOI] [PubMed] [Google Scholar]
- 71. Abdul‐Ghani MA, DeFronzo RA. Pathophysiology of prediabetes. Curr Diab Rep 2009; 9:193–9. [DOI] [PubMed] [Google Scholar]
- 72. Baker MA, Lin HH, Chang HY, Murray MB. The risk of tuberculosis disease among persons with diabetes mellitus: a prospective cohort study. Clin Infect Dis 2012; 54:818–25. [DOI] [PubMed] [Google Scholar]
- 73. Marais BJ, Lönnroth K, Lawn SD, Migliori GB, Mwaba P, Glaziou P et al Tuberculosis comorbidity with communicable and non‐communicable diseases: integrating health services and control efforts. Lancet Infect Dis 2013; 13:436–48. [DOI] [PubMed] [Google Scholar]
- 74. Sullivan T, Ben Amor Y. The co‐management of tuberculosis and diabetes: challenges and opportunities in the developing world. PLoS Med 2012; 9:e1001269. [DOI] [PMC free article] [PubMed] [Google Scholar]
- 75. Tabak AG, Herder C, Rathmann W, Brunner EJ, Kivimaki M. Prediabetes: a high‐risk state for diabetes development. Lancet 2012; 379:2279–90. [DOI] [PMC free article] [PubMed] [Google Scholar]
- 76. Kumar NP, Banurekha VV, Nair D, Sridhar R, Kornfeld H, Nutman TB et al Coincident pre‐diabetes is associated with dysregulated cytokine responses in pulmonary tuberculosis. PLoS One 2014; 9:e112108. [DOI] [PMC free article] [PubMed] [Google Scholar]
- 77. Kumar NP, Moideen K, Dolla C, Kumaran P, Babu S. Prediabetes is associated with the modulation of antigen‐specific Th1/Tc1 and Th17/Tc17 responses in latent Mycobacterium tuberculosis infection. PLoS One 2017; 12:e0178000. [DOI] [PMC free article] [PubMed] [Google Scholar]
- 78. Andrade BB, Kumar NP, Sridhar R, Banurekha VV, Jawahar MS, Nutman TB et al Heightened plasma levels of heme oxygenase‐1 and tissue inhibitor of metalloproteinase‐4 as well as elevated peripheral neutrophil counts are associated with TB‐diabetes comorbidity. Chest 2014; 145:1244–54. [DOI] [PMC free article] [PubMed] [Google Scholar]
- 79. Kumar NP, Moideen K, Sivakumar S, Menon PA, Viswanathan V, Kornfeld H et al Tuberculosis‐diabetes co‐morbidity is characterized by heightened systemic levels of circulating angiogenic factors. J Infect 2017; 74:10–21. [DOI] [PMC free article] [PubMed] [Google Scholar]
- 80. Tilg H, Moschen AR. Adipocytokines: mediators linking adipose tissue, inflammation and immunity. Nat Rev Immunol 2006; 6:772–83. [DOI] [PubMed] [Google Scholar]
- 81. Pittas AG, Joseph NA, Greenberg AS. Adipocytokines and insulin resistance. J Clin Endocrinol Metab 2004; 89:447–52. [DOI] [PubMed] [Google Scholar]
- 82. Pavan Kumar N, Nair D, Banurekha VV, Dolla C, Kumaran P, Sridhar R et al Type 2 diabetes mellitus coincident with pulmonary or latent tuberculosis results in modulation of adipocytokines. Cytokine 2016; 79:74–81. [DOI] [PMC free article] [PubMed] [Google Scholar]
- 83. Boniface K, Bernard FX, Garcia M, Gurney AL, Lecron JC, Morel F. IL‐22 inhibits epidermal differentiation and induces proinflammatory gene expression and migration of human keratinocytes. J Immunol 2005; 174:3695–702. [DOI] [PubMed] [Google Scholar]
- 84. Eidenschenk C, Rutz S, Liesenfeld O, Ouyang W. Role of IL‐22 in microbial host defense. Curr Top Microbiol Immunol 2014; 380:213–36. [DOI] [PubMed] [Google Scholar]
- 85. Wolk K, Kunz S, Witte E, Friedrich M, Asadullah K, Sabat R. IL‐22 increases the innate immunity of tissues. Immunity 2004; 21:241–54. [DOI] [PubMed] [Google Scholar]
- 86. Kumar NP, Banurekha VV, Nair D, Kumaran P, Dolla CK, Babu S. Type 2 diabetes – tuberculosis co‐morbidity is associated with diminished circulating levels of IL‐20 subfamily of cytokines. Tuberculosis 2015; 95:707–12. [DOI] [PMC free article] [PubMed] [Google Scholar]
- 87. Blankley S, Berry MP, Graham CM, Bloom CI, Lipman M, O'Garra A. The application of transcriptional blood signatures to enhance our understanding of the host response to infection: the example of tuberculosis. Philos Trans R Soc Lond B Biol Sci 2014; 369:20130427. [DOI] [PMC free article] [PubMed] [Google Scholar]
- 88. Prada‐Medina CA, Fukutani KF, Pavan Kumar N, Gil‐Santana L, Babu S, Lichtenstein F et al Systems immunology of diabetes‐tuberculosis comorbidity reveals signatures of disease complications. Sci Rep 2017; 7:1999. [DOI] [PMC free article] [PubMed] [Google Scholar]
- 89. Saiki O, Negoro S, Tsuyuguchi I, Yamamura Y. Depressed immunological defence mechanisms in mice with experimentally induced diabetes. Infect Immun 1980; 28:127–31. [DOI] [PMC free article] [PubMed] [Google Scholar]
- 90. Martens GW, Arikan MC, Lee J, Ren F, Greiner D, Kornfeld H. Tuberculosis susceptibility of diabetic mice. Am J Respir Cell Mol Biol 2007; 37:518–24. [DOI] [PMC free article] [PubMed] [Google Scholar]
- 91. Vallerskog T, Martens GW, Kornfeld H. Diabetic mice display a delayed adaptive immune response to Mycobacterium tuberculosis . J Immunol 2010; 184:6275–82. [DOI] [PMC free article] [PubMed] [Google Scholar]
- 92. Martinez N, Vallerskog T, West K, Nunes‐Alves C, Lee J, Martens GW et al Chromatin decondensation and T cell hyperresponsiveness in diabetes‐associated hyperglycemia. J Immunol 2014; 193:4457–68. [DOI] [PMC free article] [PubMed] [Google Scholar]
- 93. Martinez N, Ketheesan N, West K, Vallerskog T, Kornfeld H. Impaired recognition of Mycobacterium tuberculosis by alveolar macrophages from diabetic mice. J Infect Dis 2016; 214:1629–37. [DOI] [PMC free article] [PubMed] [Google Scholar]
- 94. Alim MA, Sikder S, Bridson TL, Rush CM, Govan BL, Ketheesan N. Anti‐mycobacterial function of macrophages is impaired in a diet induced model of type 2 diabetes. Tuberculosis 2017; 102:47–54. [DOI] [PubMed] [Google Scholar]
- 95. Cheekatla SS, Tripathi D, Venkatasubramanian S, Nathella PK, Paidipally P, Ishibashi M et al NK‐CD11c+ cell crosstalk in diabetes enhances IL‐6‐mediated inflammation during Mycobacterium tuberculosis infection. PLoS Pathog 2016; 12:e1005972. [DOI] [PMC free article] [PubMed] [Google Scholar]
- 96. Podell BK, Ackart DF, Obregon‐Henao A, Eck SP, Henao‐Tamayo M, Richardson M et al Increased severity of tuberculosis in guinea pigs with type 2 diabetes: a model of diabetes‐tuberculosis comorbidity. Am J Pathol 2014; 184:1104–18. [DOI] [PMC free article] [PubMed] [Google Scholar]