

Abstract
Transforming growth factor β (TGF‐β) suppresses epithelial cell growth. We have identified a new target gene of the TGF‐β/Smad pathway, Meox2, encoding the homeodomain transcription factor that is known to regulate endothelial cell proliferation and muscle development. Knockdown of endogenous Meox2 by RNA interference prevented the TGF‐β1‐induced cytostatic response. Moreover, ectopic Meox2 suppressed epithelial cell proliferation in cooperation with TGF‐β1, and mediated induction of the cell cycle inhibitor gene p21. Transcriptional induction of p21 by Meox2 required a distal region of the p21 promoter that spans the p53‐binding site. We show that Meox2 can form protein complexes with Smads leading to cooperative regulation of p21 gene expression. Finally, we found that in cell models that undergo both cell cycle arrest and epithelial–mesenchymal transition (EMT), ectopic Meox2 failed to induce EMT and inhibited the proper EMT response to TGF‐β. Thus, Meox2 is primarily involved in the TGF‐β tumor suppressor pathway.
Keywords: Cell cycle, Epithelial‐mesenchymal transition, Homeobox, p21Cip1/Waf1, Signal transduction, Smad, Transcription, Transforming growth factor β, Tumor suppressor
1. Introduction
Transforming growth factor β (TGF‐β) inhibits the proliferation of epithelial, endothelial and hematopoetic cells (Siegel and Massagué, 2003; ten Dijke et al., 2002). Components of the TGF‐β signaling pathway are often mutated in human cancers of diverse tissue origins, revealing their roles as tumor suppressors (Pardali and Moustakas, 2007). On the other hand, TGF‐β promotes advanced tumor progression and metastasis (Pardali and Moustakas, 2007), at least in part by facilitating the process of epithelial–mesenchymal transition (EMT), which is linked to carcinoma cell invasiveness and intravasation (Huber et al., 2005). TGF‐β binds to receptor serine/threonine kinases that phosphorylate Smad proteins, which move to the nucleus and regulate gene transcription (Shi and Massagué, 2003; ten Dijke and Hill, 2004). Smad signaling mediates both the tumor suppressor and pro‐metastatic actions of TGF‐β (Pardali and Moustakas, 2007).
Epithelial cell cycle arrest or cytostasis is mediated by a relatively small group of genes whose expression is directly regulated by the Smad pathway. Accordingly, TGF‐β induces the cell cycle inhibitors p15 and p21, and represses the proto‐oncogene Myc, and the inhibitors of differentiation, Id1, Id2 and Id3 (Massagué, 2004). Among these six genes, p21 induction by TGF‐β, or its family members, has been correlated in many cell types with epithelial cytostasis (Pardali and Moustakas, 2007). In addition, loss of p21 is causally linked to a switch of TGF‐β from a cytostatic cytokine to one promoting proliferation (Bachman et al., 2004). TGF‐β rapidly induces epithelial p21 mRNA and protein, but also maintains sustained p21 levels for prolonged periods of time (Datto et al., 1995a; Nicolas and Hill, 2003; Pardali et al., 2005; Seoane et al., 2004). Prolonged p21 gene regulation by TGF‐β is proposed to play critical roles during epithelial cytostasis (Nicolas and Hill, 2003). Sustained p21 expression may require multiple cycles of Smad signaling from the active receptors to the nucleus (Inman et al., 2002; Nicolas and Hill, 2003). Alternatively, sustained p21 expression could be achieved by an initial nuclear Smad input, followed by a secondary transcriptional input mediated by an independent transcription factor. Such a factor could itself be induced by the primary Smad input downstream of TGF‐β. This pattern has already been documented in the TGF‐β pathway, as Smads induce expression of transcription factors that then bind directly to Smads and together regulate new gene targets (Massagué, 2000).
Meox2 (mesenchyme homeobox 2) is a vertebrate homeobox containing transcription factor originally cloned from mice (Mox‐2) or rats (growth arrest homeobox, Gax) (Candia et al., 1992; Gorski et al., 1993). Meox2 specifies mesodermal tissues, including all three muscle lineages, and is also expressed at distinct tissue interphases exhibiting epithelial–mesenchymal interactions, such as the developing heart cushions and placental cell trophoblasts (Candia et al., 1992; Quinn et al., 2000; Skopicki et al., 1997). Knockout of Meox2 in the mouse leads to reduction of muscle mass and loss of specific muscle types primarily from the limbs (Mankoo et al., 1999), while also exhibiting a characteristic cleft palate phenotype due to loss of mesenchymal cells in the developing palatal fusion (Jin and Ding, 2006). Meox2 inhibits in vitro proliferation of vascular smooth muscle and endothelial cells by inducing expression of p21 (Gorski and Leal, 2003; Smith et al., 1997). Meox2 also inhibits smooth muscle cell migration in vitro, in a p21‐dependent manner, by downregulating expression of integrin receptors (Witzenbichler et al., 1999). In vivo, during pathogenic stimulation of vascular cell proliferation, such as arterial cell wall injury, Meox2 limits the proliferative capacity of smooth muscle cells (Maillard et al., 1997). Meox2 can additionally induce the pro‐apoptotic protein Bax, which leads to suppression of Bcl‐2 function and apoptosis of smooth muscle cells or fibroblasts (Perlman et al., 1998). Little is known about factors or signaling pathways that regulate tissue‐specific Meox2 expression. During myogenesis, regulation of Meox2 expression by myocyte‐specific enhancer factor 2 (MEF2) is a critical event (Andrés et al., 1995), but the regulation of Meox2 gene expression in other cell types remains unexplored. Finally, Meox2 negatively regulates various targets of transcription factor NF‐κB, at least in endothelial cells, and regulates expression of members of the TGF‐β/bone morphogenetic protein (BMP) signaling families (Patel et al., 2005).
Here, we identified Meox2 as a gene target of the TGF‐β pathway using transcriptomic analysis of mammary epithelial cells. Despite previous reports, we found Meox2 to be expressed in epithelial cells of mammary, lung or skin origin, albeit at very low levels. Epithelial Meox2 mRNA expression is regulated by TGF‐β1 in a biphasic manner. TGF‐β1 initially weakly repressed and later induced robust Meox2 mRNA expression. Late Meox2 mRNA induction coincides with epithelial cell commitment to cell cycle arrest. We provide physiological and transcriptional evidence for a role of this important homeobox transcription factor in the TGF‐β signaling network that mediates the cytostatic response of normal and tumor epithelial cells.
2. Results
2.1. TGF‐β regulates Meox2 expression in epithelial cells via Smad signaling
We have recently described transcriptomic analyses of the TGF‐β pathway in mammary epithelial cells that aimed at identifying novel gene targets of the pathway involved in the cytostatic and epithelial–mesenchymal transition (EMT) responses (Kowanetz et al., 2004; Valcourt et al., 2005). During these gene screens, we identified the mouse gene Meox2 to be regulated by TGF‐β1 in a time course experiment in normal mammary epithelial NMuMG cells (data not shown). The microarray data were independently verified using semi‐quantitative RT‐PCR in NMuMG cells, exhibiting a transient two‐ to threefold repression of Meox2 levels after 2 and 8h of TGF‐β1 stimulation and recovery of normal Meox2 expression at 16–24h of stimulation (Figure 1A). We measured a similar profile of transient and gradual two‐ to eightfold repression during the first 1–4h of TGF‐β1 stimulation, recovery of control levels by 8h, followed by a more dramatic induction during 16–24h of stimulation in normal immortalized HaCaT keratinocytes (Figure 1B). Stimulation of NMuMG cells with TGF‐β1 in the presence of the protein synthesis inhibitor cycloheximide indicated that Meox2 is a direct gene target of the TGF‐β pathway at both early and late phases of its response (data not shown).
Figure 1.
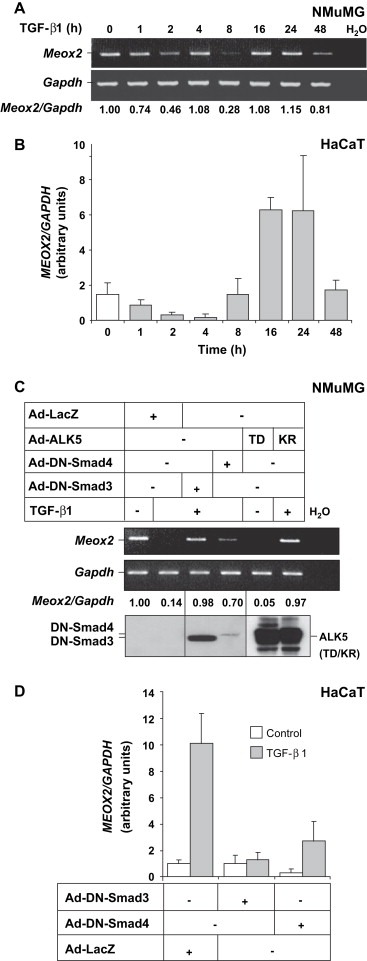
Expression profile of Meox2 in response to TGF‐β1. (A) Semi‐quantitative RT‐PCR analysis of Meox2 and Gapdh from NMuMG cells during a time course experiment with 5ng/ml TGF‐β1. Normalized Meox2 mRNA expression values are listed. (B) Quantitative real time RT‐PCR of MEOX2 and GAPDH from HaCaT cells stimulated with 5ng/ml TGF‐β1 for the indicated time periods. (C) Semi‐quantitative RT‐PCR analysis of Meox2 and Gapdh mRNA expression in NMuMG cells infected with adenoviruses (MOI 100) expressing the indicated proteins and stimulated with 5ng/ml TGF‐β1 for 2h. Normalized Meox2 mRNA expression values are listed. Immunoblots with anti‐Flag or anti‐HA antibodies of duplicate cell cultures treated under identical conditions demonstrate expression of the infected proteins (Smads, anti‐FLAG and ALK5, anti‐HA). (D) Quantitative real time RT‐PCR of MEOX2 and GAPDH from HaCaT cells infected with adenoviruses (MOI 100) expressing the indicated proteins and stimulated with 5ng/ml TGF‐β1 for 16h.
Using dominant‐negative mutants of Smad3 and Smad4 that block endogenous Smad signaling, we further demonstrated that the Smad pathway mediates Meox2 gene regulation by TGF‐β1. In NMuMG cells, the early repression of Meox2 mRNA levels was fully reversed to control levels after adenoviral expression of dominant‐negative Smad3, while dominant‐negative Smad4 only partially restored the repressed Meox2 mRNA levels (Figure 1C). The latter difference between the two dominant‐negative Smads reflects their expression levels (Figure 1C). Dominant‐negative Smad4 is an unstable mutant protein with rapid turnover as previously established (Valcourt et al., 2005). In HaCaT cells, the dramatic late induction of Meox2 mRNA levels was also substantially blocked by dominant‐negative Smad3 and to a lesser extent by the unstable dominant‐negative Smad4 mutant (Figure 1D). In addition to using the two Smad mutants, we confirmed the Meox2 expression profile by testing two additional mutants of the TGF‐β type I receptor (also known as activin receptor‐like kinase 5, ALK5) (Figure 1C). The ALK5 point mutant TD that exhibits constitutive activity and bypasses the need of stimulation by ligand, reproduced the robust repression of Meox2 mRNA levels. In contrast, the ALK5 point mutant KR that is catalytically inactive and acts as a dominant negative, completely blocked the TGF‐β1‐mediated repression of Meox2 mRNA expression. We therefore conclude that Meox2 is weakly expressed in epithelial cells and its levels are repressed at early time points of TGF‐β1 stimulation of mammary epithelial cells and keratinocytes, while Meox2 expression is considerably increased by TGF‐β1 upon long term stimulation at least in keratinocytes. The latter observation clearly reflects cell type specificity.
2.2. Endogenous Meox2 synergizes with TGF‐β1 to arrest proliferation of epithelial cells
Based on the previously established role of Meox2 as an inhibitor of endothelial and smooth muscle cell growth (see Section 1), we examined whether this protein could elicit similar responses in epithelial cells. Due to the biphasic regulation of endogenous Meox2 gene expression, we targeted the late and robust induction phase of Meox2 in epithelial cells responding to TGF‐β1. For this reason, we examined HaCaT keratinocytes using two complementary approaches: (i) knockdown of endogenously induced Meox2 using a specific short interfering (si) RNA oligonucleotide pool, and (ii) ectopic expression of Meox2 using an adenoviral vector. After efficient knockdown (90%) of endogenously induced Meox2 by siRNA transfection (Figure 2A), the ability of cells to enter S‐phase of their cell cycle was measured using thymidine incorporation assays after stimulation with TGF‐β1 (Figure 2B). Knocking down endogenous Meox2 with siRNA clearly affected the cytostatic response of HaCaT cells, as the degree of suppression of thymidine incorporation seen in cells transfected with control siRNA and TGF‐β1 stimulation (55%) was compromised in those transfected with the Meox2‐specific siRNA (20%).
Figure 2.
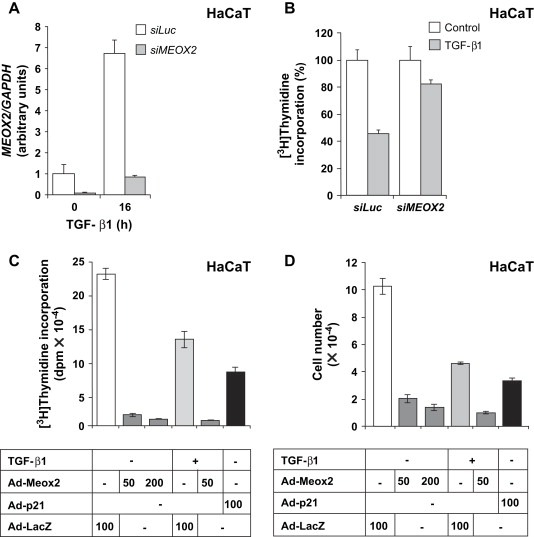
Meox2 mediates HaCaT cytostasis in response to TGF‐β1. (A) Quantitative real time RT‐PCR analysis of MEOX2 and GAPDH mRNA levels in HaCaT cells transiently transfected with control (siLuc) and specific (siMEOX2) siRNAs prior to stimulation with 5ng/ml TGF‐β1 for the indicated time periods. (B) Thymidine incorporation assay in HaCaT cells transiently transfected with siRNAs as in panel A, and stimulated with 5ng/ml TGF‐β1 for 18h. The control conditions have been normalized to 100%. (C) Thymidine incorporation assay in HaCaT cells transiently infected with the indicated adenoviral MOI and stimulated with 5ng/ml TGF‐β1 for 20h. (D) Cell proliferation assay in HaCaT cells infected as in panel C and stimulated with TGF‐β1 for 72h.
Conversely, ectopic expression of Meox2 led to a dramatic suppression of thymidine incorporation, which was much stronger than that obtained after infection of cells with the control virus Ad‐LacZ and stimulation with TGF‐β1 or after infection with a virus expressing wild type p21 in the absence of TGF‐β1 (Figure 2C). The strong cytostatic effect of Meox2 reflects the expression level of this protein after adenoviral expression (see below). When TGF‐β1 and ectopic Meox2 were combined, the cytostatic effect measured was even stronger. The ability of ectopic Meox2 to suppress entry into S‐phase was also reflected at the level of overall cell proliferation as depicted in Figure 2D. Ectopic Meox2 expression suppressed HaCaT cell proliferation, TGF‐β1 or ectopic p21 had a similar but weaker effect, and combination of Meox2 with TGF‐β1 led to a dramatic cytostatic effect. We therefore conclude that Meox2 controls the cytostatic response of epithelial cells to TGF‐β, and when ectopically expressed, it is a very potent inducer of proliferation arrest.
2.3. Meox2 regulates expression of the cell cycle inhibitor p21 in epithelial cells
The above findings on the role of Meox2 during epithelial cell growth inhibition, suggested regulation of the cell cycle inhibitor p21 by Meox2, as a possible mechanism mediating this response. Alternatively, Meox2 might regulate additional genes with important roles in cell cycle control. To examine these possibilities, we infected various epithelial cell lines with the Meox2 adenovirus and measured regulation of endogenous gene expression at the mRNA and protein level. Ectopic Meox2 induced very high (22‐fold) p21 mRNA levels in HaCaT cells (Figure 3A), relatively high levels (4.5‐fold) of p21 mRNA in human mammary carcinoma MCF‐7 cells (Figure 3B) and moderate levels (3.5‐fold) of p21 mRNA in NMuMG cells (Figure 3C). This was also the case for p21 protein levels in HaCaT and MCF‐7 cells (Figure 3D, E), but we failed to measure p21 protein levels in NMuMG cells (Figure 3F and data not shown). In HaCaT cells, endogenous p21 protein levels dose‐dependently increased in response to increasing Meox2 levels (Figure 3G). We conclude that p21 is a major target of Meox2 with functional links to cell cycle arrest in normal and tumor epithelial cells of diverse tissue origins.
Figure 3.
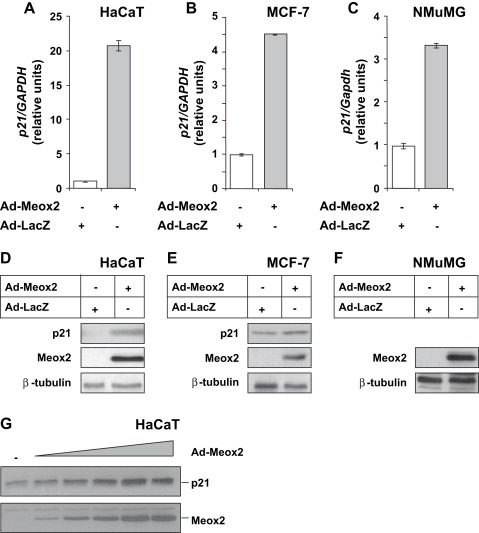
Meox2 induces expression of the cell cycle inhibitor p21 in epithelial cells. (A–C) Quantitative real time RT‐PCR analysis of P21 and GAPDH mRNA levels in HaCaT (A), MCF‐7 (B) and NMuMG (C) cells transiently infected with Ad‐LacZ or Ad‐Meox2 (MOI 100) for 48h. (D–F) Immunoblots with anti‐HA, anti‐p21 or anti‐β‐tubulin (control) antibodies of duplicate cell cultures treated under identical conditions demonstrate expression of ectopic Meox2 and endogenous p21 and β‐tubulin proteins, the latter serving as protein loading control. (G) Immunoblot analysis of endogenous p21 protein expression in HaCaT cells infected with increasing MOI (10, 20, 40, 80, 100; triangle) of Meox2 or LacZ (MOI 100, ‐) adenoviruses for 48h. Anti‐HA immunoblots show the expression of ectopic Meox2.
For this reason, we attempted to demonstrate a critical role of Meox2 in the induction profile of p21 by TGF‐β, by reducing endogenous Meox2 levels by siRNA‐mediated knockdown. Transfection with siRNA downregulated the induced levels of Meox2 16h after TGF‐β1 stimulation by 6.8‐fold (Figure 4A). In the same transfected cells, endogenous p21 mRNA and protein responded to TGF‐β1 (Figure 4B, C), but the absolute basal and inducible levels decreased by 40–50%, suggesting that Meox2 is critical for the maintenance of optimal levels of p21 in response to TGF‐β. Since p21 mRNA levels are inducible by TGF‐β1 in the presence of the Meox2 siRNA (Figure 4B), we conclude that Meox2 may not participate in the primary p21 response by the first incoming Smad signal, but it may be required for sustained expression of this gene during prolonged TGF‐β stimulation.
Figure 4.
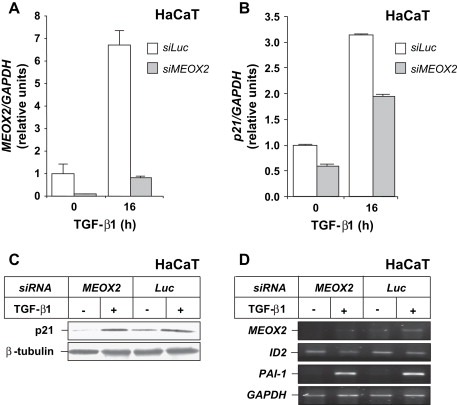
Meox2 is required for optimal p21 levels after TGF‐β stimulation. (A) Quantitative real time RT‐PCR analysis of MEOX2 and GAPDH mRNA expression in HaCaT cells transfected with the indicated siRNAs and stimulated with 5ng/ml TGF‐β1 for 0 or 16h. (B) Quantitative real time RT‐PCR analysis of p21 and GAPDH mRNA expression in the same HaCaT cells of panel A. (C) Immunoblot analysis of endogenous p21 and β‐tubulin protein expression in HaCaT cells transfected and stimulated under identical conditions as in panel A. (D) Semi‐quantitative RT‐PCR analysis of endogenous MEOX2, ID2, PAI‐1 and GAPDH levels in HaCaT cells transfected and stimulated under identical conditions as in panel A.
As specificity controls, we measured effects of Meox2 knockdown on mRNA expression of two other well‐established TGF‐β gene targets, the repressible Id2 and the inducible plasminogen activator inhibitor 1 (PAI‐1) (Figure 4D). Neither repression of Id2 by TGF‐β1 nor induction of PAI‐1 was significantly affected by reducing the Meox2 levels. This suggests that endogenous Meox2 does not control expression of all TGF‐β‐regulated gene targets, but rather seems to show specificity towards regulation of p21. Suppression of endogenous Meox2 by siRNA shows that Meox2 is important for p21 gene induction (Figure 4B, C) and inhibition of cell proliferation (Figure 2B), and these data place Meox2 in the cytostatic gene repertoire of epithelial cells.
We additionally measured mRNA and protein expression of other TGF‐β‐responsive genes, including genes of the cytostatic program such as p15Ink4B (p15), c‐MYC and ID2, in immortalized normal HaCaT keratinocytes and breast carcinoma MCF‐7 cells. In HaCaT cells, while p21 mRNA levels were potently induced by ectopic Meox2, and TGF‐β1 further enhanced this response (Figure 5A), the mRNA expression profile of the functionally similar cell cycle inhibitor p15 was dramatically different (Figure 5B). In contrast to the time‐dependent accumulation of p15 mRNA levels in response to TGF‐β1, ectopic Meox2 weakly repressed p15 gene expression, and further exhibited a dramatic inhibition of the TGF‐β‐inducible p15 mRNA levels (Figure 5B). Ectopic Meox2 also strongly reduced c‐MYC mRNA levels in HaCaT cells, and TGF‐β1 could not further repress c‐MYC when combined with ectopic Meox2 (Figure 5C). Finally, the biphasic regulation of ID2 mRNA by TGF‐β1 was slightly perturbed by ectopic Meox2 as the late repression of this gene was partially compromised (Figure 5D) by the presence of relatively high Meox2 levels (Figure 5E). On the other hand, in mammary carcinoma MCF‐7 cells, Meox2 induced p21 mRNA by 2.8‐fold, while p15, c‐MYC and ID2 mRNA levels were not appreciable affected by the presence of Meox2 (Figure 5F). We also confirmed the relative unresponsiveness of ID2 gene expression to ectopic Meox2 at the protein level (Figure 5G), while we failed to detect measurable levels of c‐MYC or p15 proteins in the same cell type (data not shown). Based on this comparative analysis of expression of genes involved in the epithelial cytostatic response, we conclude that among the four TGF‐β‐responsive genes that we tested, only p21 showed reproducible, robust and cell type‐independent regulation by Meox2. The other genes exhibited either insensitivity or even the inverse response to the Meox2 levels, which was cell type‐specific and possibly indirect.
Figure 5.
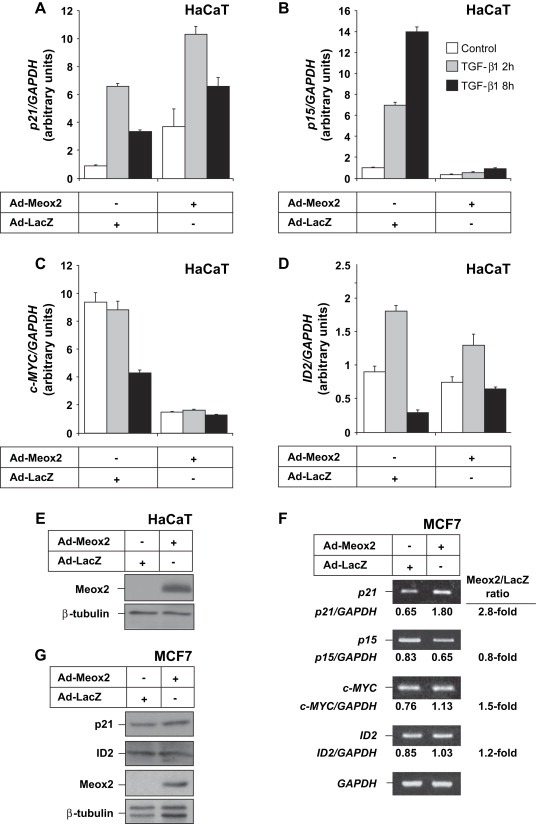
Regulation of other genes of the TGF‐β‐dependent cytostatic program by Meox2. Quantitative real time RT‐PCR analysis of (A) p21, (B) p15, (C) c‐Myc and (D) Id2 mRNA normalized over GAPDH mRNA expression in HaCaT cells infected with the indicated adenoviruses (MOI 100) and stimulated with 5ng/ml TGF‐β1 for 0, 2 and 8h. (E) Immunoblots with anti‐HA or anti‐β‐tubulin (control) antibodies of duplicate cell cultures treated under identical conditions demonstrate expression of ectopic Meox2. (F) Semi‐quantitative RT‐PCR analysis of p21, p15, c‐MYC, ID2 and GAPDH mRNA expression in MCF‐7 cells infected with adenoviruses (MOI 100) expressing the indicated proteins for 48h. Normalized mRNA expression values are listed and fold‐differences between control and Meox2 expression are tabulated on the right hand side. (G) Immunoblot analysis of p21 and Id2 protein expression in MCF‐7 cells infected with the indicated adenoviruses (MOI 100) for 48h. Anti‐HA immunoblots show the expression of the infected Meox2 and β‐tubulin serves as loading control.
2.4. Mechanism of transcriptional regulation of the p21 gene by Meox2
We then studied the regulation of the p21 promoter–enhancer by Meox2 and Smad proteins. We first established that an upstream fragment of the human p21 promoter spanning 2.4kbp (el‐Deiry et al., 1995), was transactivated by co‐transfection of Meox2 in epithelial cells, such as NMuMG and HaCaT, as it has been previously shown in vascular smooth muscle cells (Smith et al., 1997) (Figure 6A). We then analyzed the same promoter fragment and various deletion mutants from its 5′ end in order to map a responsive sequence element that was sensitive to the action of Meox2 (Figure 6B). Co‐transfection experiments in human hepatoma HepG2 and human embryonic kidney HEK‐293 cells indicated that the distal 400bp of the human p21 genomic fragment were critical for transactivation by Meox2; constructs with this fragment deleted, or a proximal p21 promoter (−143/+8p21P) that is sensitive to TGF‐β/Smad signals (Pardali et al., 2000), could not be transactivated by Meox2 (Figure 6B). Furthermore, p21 promoter activation by Meox2 required the conserved homeodomain of this protein, as a deletion mutant lacking this domain failed to activate any of the p21 promoter constructs tested (Figure 6B), although this mutant was well expressed (Figure 6C).
Figure 6.
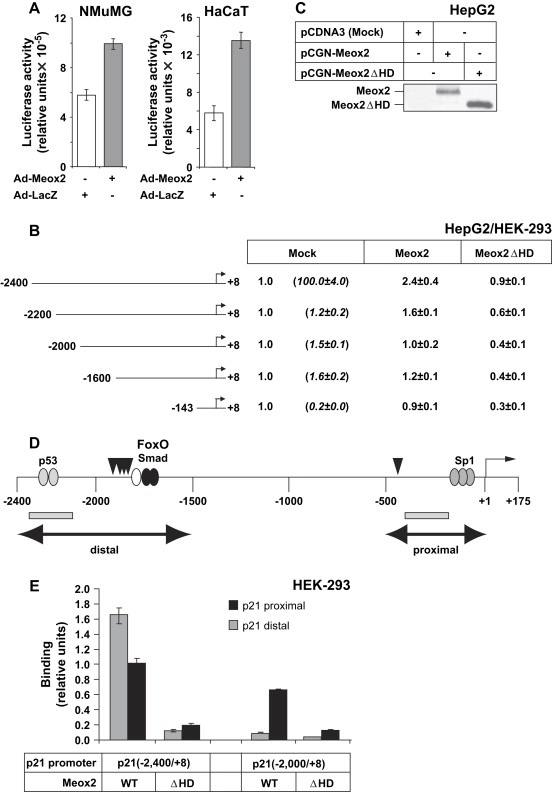
Meox2 induces the p21 promoter–enhancer via its distal region. (A) Transactivation of the −2400/+8p21 promoter in NMuMG and HaCaT cells transiently infected with Ad‐Meox2 or Ad‐LacZ (MOI 100) for 24h. Normalized relative luciferase activity is shown in arbitrary units. (B) Luciferase p21 promoter assays of the indicated promoter deletion constructs in HepG2 and HEK‐293 cells transfected with mock vector (pcDNA3) or specific Meox2‐expressing vectors (wild type, Meox2, and homeodomain deletion mutant, Meox2ΔHD). Values express average normalized relative luciferase activity and standard deviations from triplicate determinations. Similar data were obtained from both cell lines. All basal promoter activities (Mock) are shown as 1, relative to which the promoter activities obtained after Meox2 transfections are calculated. The differences in basal promoter activity between the various deletion constructs are shown in parenthesis under Mock. (C) Immunoblot analysis of transfected wild type Meox2 and mutant lacking its homeodomain (ΔHD) in cell lysates used for the luciferase assay of panel B, using the anti‐HA antibody. (D) Diagram of the human p21 promoter–enhancer indicating the distal and proximal regions (double‐headed arrows) with the corresponding p53, FoxO3a‐Smad and Sp1 binding elements, and the transcriptional initiation (+1) site. Vertical arrowheads indicate the putative Meox2‐binding sites and the PCR fragments amplified during ChIP analysis are shown as grey rectangles. (E) ChIP analysis of the human p21 promoter–enhancer in transfected HEK‐293 cells with the two indicated p21 genomic fragments and wild type (WT) Meox2 expression vector. The homeodomain deletion mutant Meox2(ΔHD) serves as negative control. Q‐PCR assays measure genomic sequences corresponding to a distal and a proximal p21 genomic fragment as illustrated in panel D (grey rectangles).
The distal fragment of the 2.4kbp p21 promoter–enhancer contains the site recognized by p53 (Figure 6D), a classic transcriptional inducer of p21 (el‐Deiry et al., 1995; el‐Deiry et al., 1993). p53 and its relatives, p63 and p73, cooperate with Smad proteins to induce p21 gene expression in response to TGF‐β (Cordenonsi et al., 2003). Further downstream, around position −1.7kbp from the transcriptional initiation start site, maps a second enhancer element that recruits Smad proteins and the transcription factor FoxO3a (Figure 6D), and which is critical for responsiveness of p21 to TGF‐β (Seoane et al., 2004). Recent studies on the close relative of Meox2, the Meox1 protein, have identified an A/T‐rich sequence motif that is recognized by the homeodomain of Meox1 on its target gene Bapx1 (Rodrigo et al., 2004). Inspection of the p21 promoter sequence indicated several A/T‐rich motifs that could possibly mediate transactivation of the p21 promoter by Meox2 (Figure 6D, arrowheads). Interestingly, four of these motifs cluster very close to the FoxO3a‐Smad enhancer element, while a single motif resides closer to the proximal promoter.
Chromatin immunoprecipitation (ChIP) assays performed in transfected HEK‐293 cells using two variants of the human p21 promoter–enhancer confirmed that indeed, under in vivo conditions, Meox2 could associate with the distal part of the p21 enhancer (Figure 6E). Interestingly, when the −2400/+8 p21 promoter–enhancer was tested, Meox2 was recruited to both the distal and the proximal regions of this fragment (Figure 6E). Meox2 recruitment to the proximal p21 promoter may be due to either the presence of a single putative Meox2‐binding site that lies within the proximal 500bp of this promoter (Figure 6D), or to chromatin looping, whereby the distal enhancer that binds Meox2 makes physical contacts with the proximal promoter region (Moustakas et al., 2002). Our evidence though suggests that recruitment of Meox2 to the proximal p21 promoter may not necessarily correlate with transcriptional activation of this promoter by Meox2 (Figure 6B, E). Recruitment of Meox2 to the p21 promoter–enhancer is critically dependent on the homeobox domain (HD) of this transcription factor, suggesting a direct interaction between Meox2 and the A/T‐rich sequence of the distal enhancer. The ChIP experiment also verified the importance of the distal enhancer sequence as deletion of the most distal 400bp (−2000/+8p21P fragment) decreased significantly Meox2 recruitment to this promoter (Figure 6E). These assays were optimized for detection of transcription factor recruitment to the transfected p21 promoter chromatin but not to the endogenous p21 chromatin. This is verified by amplifying the distal p21 enhancer element in construct −2000/+8p21P which lacks the sequences amplified by the PCR primers. Additional specificity of the ChIP assays was tested by precipitating the ALK5 receptor, as an unrelated protein with the same epitope‐tag (hemagglutinin, HA), or with HA antibody alone, which set the background signal in these assays (data not shown).
The ability of Meox2 to cooperate with TGF‐β1 in regulating epithelial cytostasis (Figure 2) and p21 induction (Figure 3), suggested the possibility that during the late phase of the TGF‐β response, Meox2 might be recruited to the distal p21 enhancer and might cooperate with Smad proteins bound to distinct DNA sites lying not far away from the Meox2‐binding site(s). If this was the case, then Meox2 might be able to form stable ternary complexes with Smad proteins, which would allow the stable activation of transcription of p21. For this reason, we measured the formation of protein complexes between Meox2 and Smads in HaCaT cells, transiently infected with adenoviruses expressing the various proteins (Figure 7A). We could readily detect co‐immunoprecipitation between Meox2 and Smad2, Smad3 or Smad4. The complexes between Meox2 and Smad3, or Meox2 and Smad4 were further enhanced after TGF‐β1 stimulation, whereas complex formation between Meox2 and Smad2 was partially inhibited after TGF‐β1 stimulation. Whether the observed modulation of Meox2–Smad complex formation is of functional significance, remains currently an open question. These data provide a biochemical basis for a possible functional cooperation between Meox2 and Smads.
Figure 7.
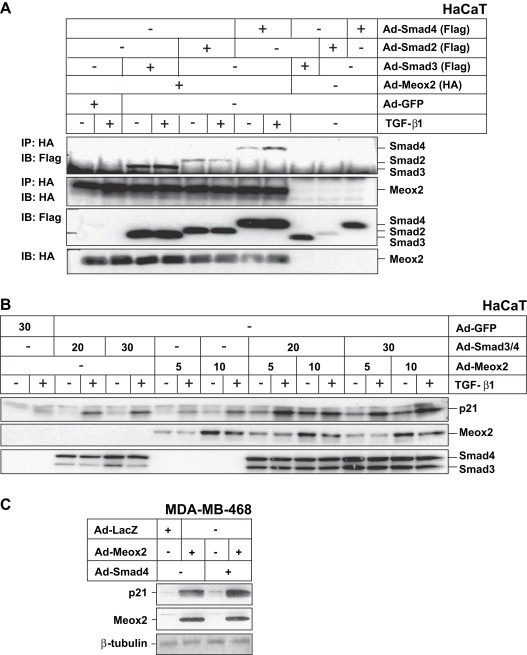
Meox2 and Smad proteins interact and cooperate in inducing endogenous p21 levels. (A) Co‐immunoprecipitation assays in HaCaT cells infected with the indicated adenoviruses (MOI 200) and stimulated with 5ng/ml TGF‐β1 for 2h. Anti‐HA (Meox2) immunoprecipitation (IP) was followed by immunoblot (IB) with antibodies against Flag (Smads) and HA (Meox2). Immunoblots of the corresponding total extracts with the two antibodies are shown below. (B) Immunoblot analysis of endogenous p21 expression in HaCaT cells infected with the indicated adenoviral MOI for 32h and stimulated with 5ng/ml TGF‐β1 for another 16h. Anti‐HA immunoblot shows the expression of the infected Meox2 and anti‐Flag immunoblot shows the expression of Smad3 and Smad4. (C) Immunoblot analysis of endogenous p21 protein expression in MDA‐MB‐468 cells infected with the indicated adenoviruses (MOI 100) for 48h. Anti‐HA immunoblot shows the expression of the exogenous Meox2 and β‐tubulin serves as protein loading control.
In order to directly demonstrate this cooperation during endogenous p21 gene expression regulation, we measured p21 protein levels in HaCaT cells transiently infected with Meox2 and Smad adenoviral vectors under similar conditions as those of the co‐immunoprecipitation assays. These experiments showed that ectopic expression of Smad3 and Smad4 significantly enhanced the endogenous p21 response in a Smad dose‐dependent manner (Figure 7B). Ectopic Meox2 also enhanced the endogenous p21 protein levels in a dose‐dependent manner. Combining Meox2 with Smad3 and Smad4 led to an even more robust and dose‐dependent accumulation of endogenous p21 levels in response to TGF‐β1. A similar cooperative induction of endogenous p21 levels was demonstrated in human breast carcinoma MDA‐MB‐468 cells (Figure 7C), which lack the genomic locus for Smad4. As predicted, upon reintroduction of wild type Smad4 in MDA‐MB‐468 cells, p21 protein levels were weakly induced, but the combination of Smad4 and Meox2 led to significantly higher levels of p21 protein, demonstrating again the synergism between these two proteins. We therefore conclude that Meox2 expression is induced by TGF‐β and this homeobox transcription factor can form complexes with Smad signal transducers of the TGF‐β pathway, thus leading to cooperative regulation of target genes such as p21, which mediate the epithelial cytostatic response to TGF‐β.
2.5. Meox2 fails to promote EMT and partially blocks TGF‐β1‐induced EMT
After having examined the role of Meox2 in the epithelial cytostatic response to TGF‐β1, we also studied the EMT response, as the cell types we analyzed undergo concomitant growth arrest and EMT (Valcourt et al., 2005). It was therefore formally possible that Meox2 might either play a role during the onset or establishment of EMT, or alternatively, the late induction of Meox2 mRNA expression might correlate with this change in differentiation. We first tried to correlate Meox2 mRNA levels with the process of EMT; however, we could not obtain any clear evidence for such correlation (see below). EMT is established relatively late in epithelial cells responding to TGF‐β as this process requires the primary induction of transcription factors such as HMGA2 that subsequently regulate expression of a second wave of transcription factors such as Snail and Twist that ultimately regulate the expression of genes critical for the differentiation switch (Thuault et al., 2006). For this reason, the first clear phenotypic signs of EMT appear after 16–24h of TGF‐β1 stimulation in NMuMG cells or even later (24–48h) in HaCaT keratinocytes (Valcourt et al., 2005). Thus, during the primary gene response that primes epithelial cells for EMT (4–12h), Meox2 expression is downregulated (Figure 1). Furthermore, Meox2 levels recover or get superinduced after about 16h of TGF‐β1 stimulation, which coincides with the second wave of gene expression during EMT. However, in the cell model that exhibits stronger phenotypic signs of EMT, NMuMG, the Meox2 levels only return back to basal levels at 16h, while in the cell model that shows more delayed and phenotypically weaker (usually termed as scattering phenotype) EMT response, HaCaT, the Meox2 levels are more dramatically induced at 16h.
The above observations were then corroborated by experiments using ectopic Meox2 expression in NMuMG and HaCaT cells (Figure 8). By monitoring E‐cadherin protein expression and cellular distribution, we could readily observe scattering/EMT in both HaCaT and NMuMG cells responding to TGF‐β1 from 36 to 48h after infection with a control adenovirus expressing LacZ (Figure 8A, B). In contrast, cells infected with the Meox2 adenovirus showed a relative resistance to the delocalization of E‐cadherin from their adherens junctions. Furthermore, Meox2‐expressing epithelial cells exhibited characteristically more dense and better adherent monolayers (Figure 8A, B). In addition, in HaCaT cells, while we observed clear E‐cadherin delocalization from the adherens junctions to the perinuclear cytoplasm (Figure 8A), the total protein levels of E‐cadherin were not appreciably reduced by TGF‐β1, and ectopic Meox2 also failed to perturb the profile of E‐cadherin (Figure 8C). In NMuMG cells, where E‐cadherin protein levels are substantially reduced in response to TGF‐β1, ectopic Meox2 fully restored E‐cadherin protein expression to that of control epithelial cells (Figure 8D). This result correlates well with the morphological appearance of the cells, however, the enhanced E‐cadherin protein levels do not appear to be fully organized in adherens junctions as the junctional assembly is not as extensive as in control epithelial cells, at least in NMuMG cells. We conclude that Meox2 does not participate in the establishment of EMT, while the observed regulation of its expression in epithelial cells cannot be attributed to an epiphenomenon of cells undergoing a differentiation switch.
Figure 8.
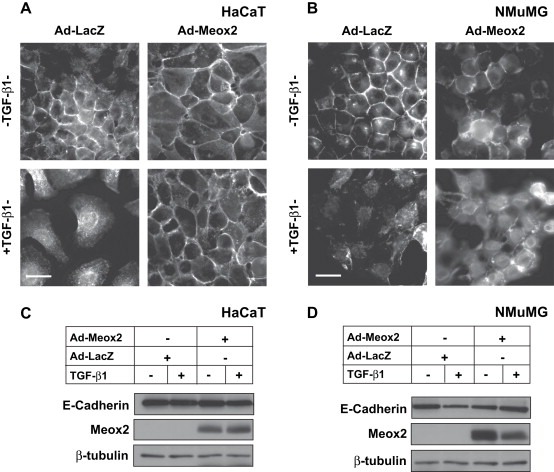
Meox2 partially blocks the EMT response to TGF‐β1. (A, B) Immunofluorescence microscopy of endogenous E‐cadherin in HaCaT (A) or NMuMG (B) cells infected with the indicated adenoviruses (MOI 100) and treated with 5ng/ml TGF‐β1 for 48h. Bars represent 10μm. (C, D) Immunoblot analysis of endogenous E‐cadherin, ectopic Meox2 (anti‐HA) and endogenous β‐tubulin serving as control in duplicate cultures infected and treated exactly as in panels A and B.
3. Discussion
The current work establishes a new player in the cytostatic program of epithelial cells in response to TGF‐β, the homeobox gene Meox2. Meox2 was previously known to induce cell growth arrest in endothelial and vascular smooth muscle cells (Gorski and Leal, 2003; Smith et al., 1997), and we now show that it can play similar roles in epithelial cells of mammary gland or skin origin (Figure 2). Since induction of Meox2 expression by TGF‐β1 is a relatively late event (Figure 1), we postulate that Meox2 would play critical roles during the times at which execution of TGF‐β's cytostatic program becomes effective. Using a polyclonal antiserum against a conserved peptide between human, rat and mouse Meox2 and immunoprecipitation experiments in HaCaT cells we could identify a significant induction of the endogenous Meox2 protein levels at 16h post‐stimulation (data not shown). However, detection of Meox2 protein in epithelial cells depended on the use of proteasomal inhibitors that led to stabilization and enhanced protein signal detection. We therefore conclude that Meox2 is weakly expressed in epithelial cells and its levels are initially repressed by TGF‐β1, but at late time points, Meox2 levels significantly increase.
Similar to other transcription factors whose expression is regulated by the TGF‐β/Smad pathway (Massagué, 2000), Meox2 forms protein complexes with Smad proteins and cooperates with Smads during p21 induction (Figure 7). Although we provide evidence for a role of Smad signaling in regulation of Meox2 expression by TGF‐β (Figure 1), the late response of Meox2 to TGF‐β may depend on additional transcription factors. Future detailed analysis of the Meox2 promoter and its regulation by TGF‐β and Smads is therefore warranted. Thus, in addition to the previously understood role of Meox2 on the differentiation of limb muscle precursors and on epithelial–mesenchymal interactions (Candia et al., 1992; Jin and Ding, 2006; Quinn et al., 2000; Skopicki et al., 1997), Meox2 is also involved in epithelial cell biology under the control of the morphogenetic cytokine TGF‐β.
All functional experiments performed in the keratinocyte cell line HaCaT (Figure 2), support the conclusion that Meox2 contributes to the TGF‐β‐induced growth inhibitory response of these cells. Ectopic expression of Meox2 always led to strong inhibition of S‐phase entry or overall cell proliferation, which was much stronger than inhibition of proliferation mediated by TGF‐β itself (Figure 2). Furthermore, TGF‐β synergized with ectopic Meox2 to suppress cell proliferation to maximal levels. We therefore conclude that the levels of ectopic Meox2 protein must be significantly higher than those achieved by TGF‐β stimulation at the peak time point. For this reason, the siRNA‐mediated knockdown experiments are more revealing. Despite this, the experiments of ectopic Meox2 expression demonstrated that Meox2 induced better epithelial growth arrest than ectopic p21 itself (Figure 2C, D). This strongly implies that Meox2 regulates additional target genes that participate in the control of epithelial cell proliferation. Preliminary transcriptomic analysis could identify such genes with functional links to epithelial cytostasis and which were regulated by Meox2 in the small panel of cell types examined here (Figure 5). However, no consistent regulation among cell types could be measured for the cell cycle inhibitor p15 or the transcriptional regulators c‐Myc and Id2. However, repression of c‐Myc by Meox2 could represent another important mechanism during epithelial cytostasis, and thus this gene deserves further attention. The cell cycle inhibitor p15 is known to be regulated by TGF‐β in a cell type‐dependent manner (Massagué, 2004), however, the apparent ability of Meox2 to block induction of p15 expression by TGF‐β at least in HaCaT cells, makes doubtful whether such a mechanism is truly physiologically important. Future, large scale transcriptomic analysis across normal and tumor epithelial cell types is required to address rigorously this interesting question.
Another important question is the mechanism by which Meox2 could contribute to the cytostatic response of epithelial cells to TGF‐β. The previous literature suggested an effect on the cell cycle inhibitor p21, whose expression can be affected by Meox2 (Smith et al., 1997). Indeed, p21 mRNA and protein are potently induced by Meox2 in epithelial cells (Figure 3). Interestingly, the expression profile of p21 mRNA in response to TGF‐β exhibits an immediate‐early strong induction phase (0.5–2h) followed by a relative decrease in expression (2–12h) and a final late induction in expression that can be sustained up to 48h (Pardali et al., 2005). The immediate‐early induction phase is clearly due to the activity of the Smad pathway and is independent of newly synthesized protein factors (Pardali et al., 2000; Seoane et al., 2004). The late and sustained induction period of p21 follows the peak levels of Meox2 expression in HaCaT cells. This point is also emphasized by the knockdown studies using siRNA against Meox2 (Figure 4); reducing endogenous Meox2 levels lowers the amplitude of p21 expression levels, while still allowing the primary inducibility of this gene to TGF‐β. This is consistent with the observations that the inducible response depends primarily on Smads and cooperating factors FoxO3a and Sp1 (Pardali et al., 2000; Seoane et al., 2004). This reinforces the model whereby Meox2 acts secondary to the primary Smad signal, in order to maintain high levels of p21 mRNA and protein expression during prolonged stimulation of cells with TGF‐β.
Despite the previous demonstration of p21 gene induction by Meox2 (Smith et al., 1997), the mechanistic details of this event are largely unknown. We therefore attempted to characterize this mechanism by promoter transactivation studies and mapped the region of the human p21 promoter–enhancer to the distal part relative to the transcription initiation site (Figure 6). Furthermore, we showed that the homeodomain of Meox2 is required for induction of the p21 promoter. We scanned the distal p21 enhancer sequence for the TTAATTAT motif, which is recognized by Meox1 that is functionally analogous to Meox2 (Rodrigo et al., 2004). This motif is not present anywhere in the 5kbp human or mouse p21 promoters, however, four copies of the core ATTA motif localize in close proximity to the recently identified FoxO3a‐Smad binding element of the same promoter (Seoane et al., 2004), and a single copy flanks the proximal part of the p21 promoter (Figure 6D). One of the p21 enhancer motifs discussed here has very recently been experimentally demonstrated to bind Meox2 in vitro and in vivo in endothelial cells (Chen et al., 2007). Furthermore, due to the fact that the repetitive putative Meox2‐binding sites map close to the FoxO3a‐Smad binding regions of the promoter, we hypothesize that Meox2 might form a complex with Smads. In favor of such a model, Meox2 was found to co‐immunoprecipitate with Smad molecules (Figure 7). These data suggest that during transcriptional induction of the p21 gene by TGF‐β, a primary event is the recruitment of Smads together with FoxO3a to the promoter, and cooperation of p53 with Smads may also play a role during this event (Cordenonsi et al., 2003; Seoane et al., 2004). After long stimulation with TGF‐β, sufficient Meox2 accumulates inside epithelial cells, and recruitment of this factor in the promoter region between the p53 and FoxO3a‐Smad elements may lead to further stabilization of these complexes. This event may be critical for the efficient and sustained expression of the p21 gene. The mechanism by which these distal complexes communicate with the proximal promoter region that is indispensable for induction of the p21 promoter by TGF‐β and which recruits transcription factor Sp1 (Datto et al., 1995b; Moustakas and Kardassis, 1998; Pardali et al., 2000), remains to be addressed in the future. The proximal putative Meox2‐binding site may serve as a docking site for such a chromatin looping mechanism.
We finally examined the relationship between the expression profile of Meox2 in response to TGF‐β and the process of EMT. Based on the timing of Meox2 mRNA repression and induction we cannot propose a clear model that could link these two events. However, ectopic expression of Meox2 clearly interfered with the EMT process in both cell models examined here (Figure 8). This suggest that the late recovery (NMuMG) or super‐induction (HaCaT) of Meox2 mRNA cannot be directly linked to the EMT process. An interesting scenario would be that the higher levels of Meox2 observed in the keratinocytes might play a functional role in prohibiting HaCaT cells from undergoing a complete EMT, and rather scatter, as previously described (Valcourt et al., 2005). Alternatively, we could envision a mechanism whereby the early repression phase of Meox2 contributes to the early onset of the first wave of transcription factor induction by TGF‐β, which ultimately establishes the EMT differentiation program (Thuault et al., 2006). This formal possibility is worth addressing more rigorously and raises the possibility that Meox2 might interfere with the function of major regulators of EMT such as the high mobility group protein HMGA2 or the zinc finger protein Snail.
In the same line of reasoning, it is worth discussing the previous evidence of the role of Meox2 in mesenchymal cell differentiation. It is therefore possible that the established role of Meox2 in inhibiting proliferation of smooth muscle cells or cardiomyocytes especially during injury or fibrotic conditions of the heart muscle (Maillard et al., 1997; Witzenbichler et al., 1999), may be linked to the overactivity of TGF‐β under the same pathological conditions. We have not currently examined Meox2 gene regulation by TGF‐β in mesenchymal cell types, however, the conservation of the Smad signaling pathway across species and cell types makes it possible that the expression profiles measured in epithelial cells are also conserved in mesenchymal cell types. Alternatively, we also envision possible links between TGF‐β and Meox2 gene regulation during brain endothelial cell malfunction in neurodegenerative diseases such as Alzheimer's. Meox2 expression is lost from such endothelial cells during Alzheimer's (Wu et al., 2005), while TGF‐β is primarily known to be involved in the regulation of β‐amyloid, during plaque formation in the brain of Alzheimer's patients (Wu et al., 2005). Thus, for Meox2 to act as a downstream effector of TGF‐β in brain vascular endothelial cells, we would expect a potent repression of Meox2 gene expression in this tissue. The expression profiles observed in epithelial cells (Figure 1) can account for such a repression phase of Meox2 expression in response to TGF‐β/Smad signaling. However, direct determination of the hyperactivity of TGF‐β signaling and regulation of Meox2 expression in brain capillaries of Alzheimer's patients could be the topic of a future investigation.
The identification of Meox2 as a new component of the cytostatic program initiated by TGF‐β in epithelial cells, and the ability of Meox2 to regulate genes of this program, such as p21, open the way to a detailed and possibly hierarchical classification of this genomic program that governs normal epithelial homeostasis and suppression of tumorigenesis.
4. Experimental procedures
4.1. Cells, viruses, proteins and nucleic acids
Human HaCaT keratinocytes, mouse mammary epithelial NMuMG and human mammary carcinoma MCF‐7 and MDA‐MB‐468 cells, human hepatocarcinoma HepG2 and human embryonic kidney (HEK) 293 cells have all been described (Kowanetz et al., 2004; Pardali et al., 2005; Pardali et al., 2000). Adenoviruses expressing wild type untagged human p21 (Ad‐p21) and wild type rat Meox2/Gax epitope tagged with hemagglutinin (HA) at its N‐terminus (Ad‐Meox2/Ad‐Gax) were from K. Walsh (Boston, MA) (Maillard et al., 1997; Witzenbichler et al., 1999); adenoviruses expressing control GFP (Ad‐GFP), control β‐galactosidase (Ad‐LacZ), the N‐terminally Flag‐tagged Smad2, Smad3, Smad4 dominant‐negative (DN) Smad3, DN‐Smad4, the C‐terminally hemagglutinin (HA) tagged TGF‐β type I receptor ALK5 constitutively active (TD) and kinase inactive (KR) proteins have been described (Valcourt et al., 2005). Recombinant mature TGF‐β1 was from PeproTech EC Ltd. (London). The human Meox2‐specific siRNA (Acc. No. NM_005924), was a pool of 4 distinct RNA oligonucleotides, termed SMARTpool (reagent number M‐0121176‐00); siRNA against the luciferase reporter vector pGL2 (Acc. No. X65324) served as control (reagent number D‐001100‐01); all siRNAs were from Dharmacon Research, Inc. (Boulder, CO).
4.2. Adenoviral infections and plasmid transfections
Adenoviruses were amplified and titrated in HEK‐293 cells as described (Valcourt et al., 2005). Adenoviral transient infections using the MOI specified in the Figures were performed as described (Pardali et al., 2000). Under standardized conditions, epithelial cells were infected at a rate of 75% without any obvious signs of cytotoxicity, as assessed by live GFP autofluorescence and immunofluorescence microscopy. Time course experiments were used to define the time of optimal protein expression (data not shown).
HaCaT cells were transiently transfected with siRNAs using Lipofectamine 2000 from Invitrogen, Corp. (Carlsbad, CA) or SilentFect from BIO‐RAD (Hercules, CA), according to the manufacturer's protocols and as described (Kowanetz et al., 2004). Twenty‐four hours post‐transfection, cells were stimulated with TGF‐β1 for the times indicated in the Figures, prior to thymidine incorporation assays, extraction of total RNA or total proteins. HepG2 and HEK‐293 cells were transiently transfected with the calcium phosphate protocol as described (Morén et al., 2005).
4.3. Gene promoter–reporter assays
A panel of human p21 promoter‐luciferase constructs based on pGL2‐basic, p21P (−2400/+8p21P), p21PΔp53 (−2200/+8p21P), p21PΔ400 (−2000/+8p21P), p21PΔ800 (−1600/+8p21P) and −143/+8p21P were provided by X.‐F. Wang (Datto et al., 1995b) or described before (Pardali et al., 2000). The p21 promoter constructs were co‐transfected in HepG2 and HEK‐293 cells with the normalization reporter plasmid pCMV‐β‐gal and the expression vectors pcDNA3 (mock vector), pCGN‐Gax and pCGN‐GaxΔHD. The Meox2/Gax expression vectors were provided by K. Walsh (Boston, MA) (Smith et al., 1997). Luciferase reporter assays were performed with the enhanced luciferase assay kit from BD PharMingen, Inc. (San Jose, CA), according to the protocol of the manufacturer. Normalized promoter activity data are plotted in bar‐graphs that represent average values from triplicate determinations with standard deviations. Each independent experiment was repeated at least twice.
4.4. ChIP assays
HEK‐293 cells were transiently transfected with two different p21 promoter constructs, −2400/+8p21P and −2000/+8p21P in the presence of co‐transfected HA‐tagged ALK5 cDNA (mock control), HA‐tagged pCGN‐Gax or pCGN‐GaxΔHD. Forty‐eight hours post‐transfection, the equivalent of 107 cells was used per ChIP reaction. Crosslinking was performed using 1% formaldehyde followed by neutralization with 0.125M glycine. Cells were lysed in 1% SDS, 10mM EDTA, 50mM Tris–HCl, pH 8.1, plus protease inhibitors on ice. DNA was sheared by sonication to 200–1000bp length. Sonicated cell pellets were diluted 10 times in a buffer containing 1% Triton‐X‐100, 0.01% SDS, 1.2mM EDTA, 167mM NaCl, 16.6mM Tris–HCl, pH 8.1, and were precleared with protein A‐Sepharose in the presence of bovine serum albumin (BSA) and salmon sperm DNA prior to incubation with 2μg rabbit anti‐HA antibody (Santa Cruz) or unrelated mouse antibody as a negative control (data not shown). Protein–DNA complexes were precipitated with protein A‐Sepharose in the presence of BSA and salmon sperm DNA. Immunoprecipitated complexes were washed once with 150mM NaCl, 0.2% SDS, 1% Triton‐X‐100, 2mM EDTA, 20mM Tris–HCl, pH 8.1, once with an identical buffer containing 500mM NaCl, once with 0.25M LiCl, 1% NP‐40, 1% deoxycholate, 1mM EDTA, 10mM Tris–HCl, pH 8.1, and twice with 10mM Tris–EDTA. Immunoprecipitated complexes were eluted with 1% SDS, 0.1M NaHCO3. After reversal of crosslinks by heating in 0.2M NaCl, proteinase K treatment, purification by phenol–chloroform extraction and ethanol precipitation, DNA pellets were resuspended in 20μl water. Input material prior to immunoprecipitation corresponds to one third of the immunoprecipitated material. Input DNA pellets were resuspended in 50μl water. Precipitated material was analyzed by quantitative real time RT‐PCR as described (Valcourt et al., 2005), using 1μl of immunoprecipitated DNA or of the input material diluted 100 times. Immunoprecipitated material was normalized against the input DNA for each condition. Binding of Meox2 WT at the proximal site of the p21 promoter was set up as the reference. Primer sets used to amplify different regions of the p21 promoter are described in Table 2.
Table 2.
Oligonucleotide primers used for real time Q‐RT‐PCR or Q‐PCR after ChIP
| Gene | Primer sequence | Strand | Product size (bp) | Reference |
|---|---|---|---|---|
| Meox2 | 5′‐GAGGACAGCCGCGATAGTG‐3′ | + | 73 | GI57949 |
| 5′‐AGAATGGAGCTGGTCTTTGTAGGT‐3′ | − | |||
| MEOX2 | 5′‐TCAGAAGTCAACAGCAAACCCAG‐3′ | + | 245 | GI21396478 |
| 5′‐CCAGTTCCTTTTCCCGAGCC‐3′ | − | |||
| IDB2 | 5′‐CCCTCAACACGGATATCAGC‐3′ | + | 217 | GI33946335 |
| 5′‐AAGGTCCATTCAACTTGTCCTC‐3′ | − | |||
| c‐MYC | 5′‐AGCGACTCTGAGGAGGAACA‐3′ | + | 209 | GI71774082 |
| 5′‐TAGTCCTTCCGAGTGGAGGG‐3′ | − | |||
| p15 (CDKN2B) | 5′‐GAGTGTCTCAGGGTGCAGAG‐3′ | + | 207 | GI47132609 |
| 5′‐TAAATCCCAAAGCAGTGCACCT‐3′ | − | |||
| p21 (Cdkn1a) | 5′‐GTGTGCCGTTGTCTCTTCGG‐3′ | + | 125 | GI595302 |
| 5′‐CTCAGGTAGACCTTGGGCAG‐3′ | − | |||
| p21 (CDKN1A) | 5′‐CTGCCCAAGCTCTACCTTCC‐3′ | + | 123 | Kowanetz et al. (2004) |
| 5′‐CAGGTCCACATGGTCTTCCT‐3′ | − | |||
| Gapdh | 5′‐TGTGTCCGTCGTGGATCTGA‐3′ | + | 76 | GI47607489 |
| 5′‐CCTGCTTCACCACCTTCTTGA‐3′ | − | |||
| GAPDH | 5′‐GGAGTCAACGGATTTGGTCGTA‐3′ | + | 77 | GI83641890 |
| 5′‐GGCAACAATATCCACTTTACCA‐3′ | − | |||
| p21 Distal promoter | 5′‐GTGGCTCTGATTGGCTTTCTG‐3′ | + | 103 | GI902576 |
| 5′‐TGAAAACAGGCAGCCCAAGGA‐3′ | − | |||
| p21 Proximal promoter | 5′‐CCAAGTAAAAAAAGCCAGATTTGTG‐3′ | + | 103 | GI902576 |
| 5′‐GCTGCAGGAGGGCACTTC‐3′ | − |
4.5. Immunoblotting, immunoprecipitation and immunofluorescence
Total proteins from infected and/or stimulated NMuMG, HaCaT, MCF‐7 or MDA‐MB‐468 cells were extracted and subjected to SDS‐PAGE and analyzed by Western blotting as described previously (Pardali et al., 2000). Mouse monoclonal anti‐β‐tubulin (T8535) and mouse monoclonal anti‐Flag (M5) antibodies were from Sigma–Aldrich (Täby, Sweden); mouse monoclonal anti‐Cip1/WAF1 (clone 70) and mouse monoclonal anti‐E‐cadherin (C20820) from BD Transduction Laboratories (Lexington, KY); mouse monoclonal anti‐hemagglutinin (HA) epitope (12CA5) was from Roche Applied Science (Indianapolis, IN); rabbit polyclonal anti‐Id2 (C20; sc‐489) from Santa Cruz Biotechnology, Inc. (Santa Cruz, CA, USA).
Secondary anti‐mouse‐IgG and anti‐rabbit‐IgG coupled to horseradish peroxidase (HRP) were from GE Healthcare/Amersham Biosciences (Uppsala, Sweden). The enhanced chemiluminescence detection system was prepared in house as described (Pardali et al., 2000).
For immunofluorescence, cells were treated as indicated in the figure legends, fixed and stained with mouse anti‐E‐cadherin as primary antibody and FITC‐conjugated anti‐mouse‐IgG as secondary antibody from Jackson ImmunoResearch Laboratories, Inc. as described (Kowanetz et al., 2004). Photomicrographs were obtained by a Zeiss Axioplan 2 microscope with a Hammamatsu C4742‐95 digital camera, using the Zeiss Plan‐neofluar 63×/0.75 objective lens and photographing at ambient temperature in the presence of immersion oil. Primary images were acquired with the camera's QED software. Image memory content was reduced and brightness–contrast was adjusted using Adobe Photoshop 6.0.
4.6. Thymidine incorporation and cell counting assays
For thymidine incorporation assays, cells were cultured, transfected transiently with siRNAs or infected transiently with adenoviruses, stimulated with growth factors and labeled metabolically, as described before (Kowanetz et al., 2004). The data are plotted as average values with standard errors of triplicate repeats per independent experiment. Each independent experiment was repeated at least three times. For cell counting assays, cell monolayers were washed with phosphate buffer saline, trypsinized and stained with trypan blue (Sigma–Aldrich); viable cell numbers were calculated using a Coulter counter Z1 (Beckman Instruments AB, Bromma). Cell numbers are plotted as average from triplicate determinations with standard errors per experiment.
4.7. Semi‐quantitative RT‐PCR and quantitative real time RT‐PCR
Total RNA from NMuMG, MCF‐7 or HaCaT cells was extracted and analyzed by semi‐quantitative RT‐PCR as previously described (Kowanetz et al., 2004), using specific primers designed according to sequences available in the databanks or published by other authors (Table 1). Primers for mouse or human glyceraldehyde‐3′‐phosphate dehydrogenase (Gapdh) were used to ascertain that an equivalent amount of cDNA was synthesized. Controls where reverse transcriptase was omitted (‐RT) and where cDNAs were replaced with water were performed in order to demonstrate the specificity of the reactions. Quantification of RT‐PCR data (Figures 1A, C, 5F) was performed by analyzing the digital images of representative DNA‐agarose gels densitometrically using the AIDA software, version 3.10.039 (Fujifilm Sverige AB, Stockholm, Sweden). Each PCR‐amplified DNA band was normalized to the corresponding DNA band of GAPDH, and the expression values were expressed as a ratio. In Figure 1A, C, all expression ratios were reported relative to the unstimulated (0h) cell control, whose ratio was set as 1.00. In Figure 5F, the fold regulation by ectopic Ad‐Meox2 is also reported relative to the expression measured under control (Ad‐LacZ) conditions.
Table 1.
Oligonucleotide primers used for semi‐quantitative RT‐PCR
| Gene | Primer sequence | Strand | Product size (bp) | T (°C) | PCR cycle | Reference |
|---|---|---|---|---|---|---|
| IDB2 | 5′‐ACGACCCGATGAGCCTGCTA‐3′ | + | 213 | 55 | 30 | Kowanetz et al. (2004) |
| 5′‐TCCTGGAGCGCTGGTTCTG‐3′ | − | |||||
| PAI‐1 | 5′‐GTGGTCTGTGTCACCGTATC‐3′ | + | 440 | 57 | 25 | GI189541 |
| 5′‐GTAGTTGAATCCGAGCTGCC‐3′ | − | |||||
| Meox2 | 5′‐GAGCTGTCAGGAATCGGTGC‐3′ | + | 361 | 56 | 39 | GI57949 |
| 5′‐CATCCATCTCCCTCTCTGTC‐3′ | − | |||||
| MEOX2 | 5′‐GTCAGAAGTCAACAGCAAACCCAG‐3′ | + | 246 | 56 | 35 | GI21396478 |
| 5′‐CACATTCACCAGTTCCTTTTCCCGAGCC‐3′ | − | |||||
| c‐MYC | 5′‐ACCCGGACGACGAGACCTTCATCA‐3′ | + | 683 | 63 | 26 | Kurisaki et al. (2003) |
| 5′‐GGGGCTGGTGCATTTTCGGTTGTT‐3′ | − | |||||
| p15 (CDKN2B) | 5′‐GAGTGTCTCAGGGTGCAGAG‐3′ | + | 480 | 55 | 26 | GI20537928 |
| 5′‐GAAGGGAACCCCTGTGAACC‐3′ | − | |||||
| p21 (CDKN1A) | 5′‐CTGCCCAAGCTCTACCTTCC‐3′ | + | 123 | 57 | 30 | Schonherr et al. (2001) |
| 5′‐CAGGTCCACATGGTCTTCCT‐3′ | − | |||||
| Gapdh/GAPDH | 5′‐ATCACTGCCACCCAGAAGAC‐3′ | + | 443 | 57 | 30 | Valcourt et al. (2002) |
| 5′‐ATGAGGTCCACCACCCTGTT‐3′ | − |
DNase RQI‐digested RNA from NMuMG, MCF‐7 and HaCaT cells was analyzed by quantitative real time RT‐PCR as described (Valcourt et al., 2005). To measure direct effects on mRNA synthesis in the absence of simultaneous protein synthesis, cells were pre‐treated with 10μg/ml cycloheximide for the period of incubation with growth factors and then RNA was extracted (data not shown). Primers (Table 2) were designed with the computer program Primer Express (Applied Biosystems), using parameters recommended by the manufacturer. Reactions were carried out in an ABI‐prism 7000 sequence detector (Applied Biosystems, Foster City, CA) in triplicate, and for each condition, the ground condition (minus TGF‐β1 and/or mock‐infected with Ad‐GFP or Ad‐LacZ) was set as 1 and expression data are presented as bar‐graphs of average expression values plus standard deviations.
4.8. Statistical analysis
Statistical analysis of real time PCR quantification and promoter assays was performed by two‐tailed paired Student's t‐test. Significance was considered at P value≤0.05.
Acknowledgments
This work was supported by the Ludwig Institute for Cancer Research, the Swedish Cancer Society (project number: 4855‐B03‐01XAC), the Natural Sciences Foundation of Sweden (project number K2004‐32XD‐14936‐01A), and the Marie Curie Research Training Network (RTN) “EpiPlastCarcinoma” under the European Union FP6 program. U.V. was supported by post‐doctoral fellowships from the French Association pour la Recherche sur le Cancer and the Swedish Cancer Society, Project number 4812‐B03‐01VAA. K.P. was supported by the X‐109/2001‐02 scholarship of the Alexander S. Onassis Public Benefit Foundation, Greece. S.T. was supported by the Marie Curie RTN “EpiPlastCarcinoma”. We thank N. Fusenig, K. Miyazono, B. Vogelstein, K. Walsh and X.‐F. Wang for valuable reagents, and M. Kowanetz, M. Löök, R. Bergström and members of our research group for help and suggestions during the course of this work.
Valcourt Ulrich, Thuault Sylvie, Pardali Katerina, Heldin Carl-Henrik, Moustakas Aristidis, (2007), Functional role of Meox2 during the epithelial cytostatic response to TGF-β, Molecular Oncology, 1, doi:10.1016/j.molonc.2007.02.002.
References
- Andrés, V. , Fisher, S. , Wearsch, P. , Walsh, K. , 1995. Regulation of Gax homeobox gene transcription by a combination of positive factors including myocyte-specific enhancer factor 2. Mol. Cell. Biol.. 15, 4272–4281. [DOI] [PMC free article] [PubMed] [Google Scholar]
- Bachman, K.E. , Blair, B.G. , Brenner, K. , Bardelli, A. , Arena, S. , Zhou, S. , Hicks, J. , De Marzo, A.M. , Argani, P. , Park, B.H. , 2004. p21WAF1/CIP1 mediates the growth response to TGF-β in human epithelial cells. Cancer Biol. Ther.. 3, 221–225. [DOI] [PubMed] [Google Scholar]
- Candia, A.F. , Hu, J. , Crosby, J. , Lalley, P.A. , Noden, D. , Nadeau, J.H. , Wright, C.V. , 1992. Mox-1 and Mox-2 define a novel homeobox gene subfamily and are differentially expressed during early mesodermal patterning in mouse embryos. Development. 116, 1123–1136. [DOI] [PubMed] [Google Scholar]
- Chen, Y. , Leal, A.D. , Patel, S. , Gorski, D.H. , 2007. The homeobox gene Gax activates p21WAF1/CIP1expression in vascular endothelial cells through direct interaction with upstream AT-rich sequences. J. Biol. Chem.. 282, 507–517. [DOI] [PMC free article] [PubMed] [Google Scholar]
- Cordenonsi, M. , Dupont, S. , Maretto, S. , Insinga, A. , Imbriano, C. , Piccolo, S. , 2003. Links between tumor suppressors: p53 is required for TGF-β gene responses by cooperating with Smads. Cell. 113, 301–314. [DOI] [PubMed] [Google Scholar]
- Datto, M.B. , Li, Y. , Panus, J.F. , Howe, D.J. , Xiong, Y. , Wang, X.-F. , 1995. Transforming growth factor β induces the cyclin-dependent kinase inhibitor p21 through a p53-independent mechanism. Proc. Natl. Acad. Sci. USA. 92, 5545–5549. [DOI] [PMC free article] [PubMed] [Google Scholar]
- Datto, M.B. , Yu, Y. , Wang, X.-F. , 1995. Functional analysis of the transforming growth factor beta responsive elements in the WAF1/Cip1/p21 promoter. J. Biol. Chem.. 270, 28623–28628. [DOI] [PubMed] [Google Scholar]
- el-Deiry, W.S. , Tokino, T. , Waldman, T. , Oliner, J.D. , Velculescu, V.E. , Burrell, M. , Hill, D.E. , Healy, E. , Rees, J.L. , Hamilton, S.R. , 1995. Topological control of p21WAF1/CIP1 expression in normal and neoplastic tissues. Cancer Res.. 55, 2910–2919. [PubMed] [Google Scholar]
- el-Deiry, W.S. , Tokino, T. , Velculescu, V.E. , Levy, D.B. , Parsons, R. , Trent, J.M. , Lin, D. , Mercer, W.E. , Kinzler, K.W. , Vogelstein, B. , 1993. WAF1, a potential mediator of p53 tumor suppression. Cell. 75, 817–825. [DOI] [PubMed] [Google Scholar]
- Gorski, D.H. , Leal, A.J. , 2003. Inhibition of endothelial cell activation by the homeobox gene Gax. J. Surg. Res.. 111, 91–99. [DOI] [PubMed] [Google Scholar]
- Gorski, D.H. , LePage, D.F. , Patel, C.V. , Copeland, N.G. , Jenkins, N.A. , Walsh, K. , 1993. Molecular cloning of a diverged homeobox gene that is rapidly down-regulated during the G0/G1 transition in vascular smooth muscle cells. Mol. Cell. Biol.. 13, 3722–3733. [DOI] [PMC free article] [PubMed] [Google Scholar]
- Huber, M.A. , Kraut, N. , Beug, H. , 2005. Molecular requirements for epithelial-mesenchymal transition during tumor progression. Curr. Opin. Cell Biol.. 17, 548–558. [DOI] [PubMed] [Google Scholar]
- Inman, G.J. , Nicolas, F.J. , Hill, C.S. , 2002. Nucleocytoplasmic shuttling of Smads 2, 3, and 4 permits sensing of TGF- β receptor activity. Mol. Cell. 10, 283–294. [DOI] [PubMed] [Google Scholar]
- Jin, J.Z. , Ding, J. , 2006. Analysis of Meox-2 mutant mice reveals a novel postfusion-based cleft palate. Dev Dyn. 235, 539–546. [DOI] [PubMed] [Google Scholar]
- Kowanetz, M. , Valcourt, U. , Bergström, R. , Heldin, C.-H. , Moustakas, A. , 2004. Id2 and Id3 define the potency of cell proliferation and differentiation responses to tranforming growth factor β and bone morphogenetic protein. Mol. Cell. Biol.. 24, 4241–4254. [DOI] [PMC free article] [PubMed] [Google Scholar]
- Kurisaki, K. , Kurisaki, A. , Valcourt, U. , Terentiev, A.A. , Pardali, K. , ten Dijke, P. , Heldin, C.-H. , Ericsson, J. , Moustakas, A. , 2003. Nuclear factor YY1 inhibits transforming growth factor β- and bone morphogenetic protein-induced cell differentiation. Mol. Cell. Biol.. 23, 4494–4510. [DOI] [PMC free article] [PubMed] [Google Scholar]
- Maillard, L. , Van Belle, E. , Smith, R.C. , Le Roux, A. , Denéfle, P. , Steg, G. , Barry, J.J. , Branellec, D. , Isner, J.M. , Walsh, K. , 1997. Percutaneous delivery of the gax gene inhibits vessel stenosis in a rabbit model of balloon angioplasty. Cardiovasc. Res.. 35, 536–546. [DOI] [PubMed] [Google Scholar]
- Mankoo, B.S. , Collins, N.S. , Ashby, P. , Grigorieva, E. , Pevny, L.H. , Candia, A. , Wright, C.V. , Rigby, P.W. , Pachnis, V. , 1999. Mox2 is a component of the genetic hierarchy controlling limb muscle development. Nature. 400, 69–73. [DOI] [PubMed] [Google Scholar]
- Massagué, J. , 2000. How cells read TGF-β signals. Nat. Rev. Mol. Cell. Biol.. 1, 169–178. [DOI] [PubMed] [Google Scholar]
- Massagué, J. , 2004. G1 cell-cycle control and cancer. Nature. 432, 298–306. [DOI] [PubMed] [Google Scholar]
- Morén, A. , Imamura, T. , Miyazono, K. , Heldin, C.-H. , Moustakas, A. , 2005. Degradation of the tumor suppressor Smad4 by WW and HECT domain ubiquitin ligases. J. Biol. Chem.. 280, 22115–22123. [DOI] [PubMed] [Google Scholar]
- Moustakas, A. , Kardassis, D. , 1998. Regulation of the human p21/WAF1/Cip1 promoter in hepatic cells by functional interactions between Sp1 and Smad family members. Proc. Natl. Acad. Sci. USA. 95, 6733–6738. [DOI] [PMC free article] [PubMed] [Google Scholar]
- Moustakas, A. , Pardali, K. , Gaal, A. , Heldin, C.-H. , 2002. Mechanisms of TGF-β signaling in regulation of cell growth and differentiation. Immunol. Lett.. 82, 85–91. [DOI] [PubMed] [Google Scholar]
- Nicolas, F.J. , Hill, C.S. , 2003. Attenuation of the TGF-β-Smad signaling pathway in pancreatic tumor cells confers resistance to TGF-β-induced growth arrest. Oncogene. 22, 3698–3711. [DOI] [PubMed] [Google Scholar]
- Pardali, K. , Kowanetz, M. , Heldin, C.-H. , Moustakas, A. , 2005. Smad pathway-specific transcriptional regulation of the cell cycle inhibitor p21WAF1/Cip1 . J. Cell. Physiol.. 204, 260–272. [DOI] [PubMed] [Google Scholar]
- Pardali, K. , Kurisaki, A. , Morén, A. , ten Dijke, P. , Kardassis, D. , Moustakas, A. , 2000. Role of Smad proteins and transcription factor Sp1 in p21Waf1/Cip1 regulation by transforming growth factor-β. J. Biol. Chem.. 275, 29244–29256. [DOI] [PubMed] [Google Scholar]
- Pardali, K. , Moustakas, A. , 2007. Actions of TGF-β as tumor suppressor and pro-metastatic factor in human cancer. Biochim. Biophys. Acta. 1775, 21–62. [DOI] [PubMed] [Google Scholar]
- Patel, S. , Leal, A.D. , Gorski, D.H. , 2005. The homeobox gene Gax inhibits angiogenesis through inhibition of nuclear factor-κB-dependent endothelial cell gene expression. Cancer Res.. 65, 1414–1424. [DOI] [PubMed] [Google Scholar]
- Perlman, H. , Sata, M. , Le Roux, A. , Sedlak, T.W. , Branellec, D. , Walsh, K. , 1998. Bax-mediated cell death by the Gax homeoprotein requires mitogen activation but is independent of cell cycle activity. EMBO J.. 17, 3576–3586. [DOI] [PMC free article] [PubMed] [Google Scholar]
- Quinn, L.M. , Latham, S.E. , Kalionis, B. , 2000. The homeobox genes MSX2 and MOX2 are candidates for regulating epithelial–mesenchymal cell interactions in the human placenta. Placenta. 21, (Suppl. A) S50–S54. [DOI] [PubMed] [Google Scholar]
- Rodrigo, I. , Bovolenta, P. , Mankoo, B.S. , Imai, K. , 2004. Meox homeodomain proteins are required for Bapx1 expression in the sclerotome and activate its transcription by direct binding to its promoter. Mol. Cell. Biol.. 24, 2757–2766. [DOI] [PMC free article] [PubMed] [Google Scholar]
- Schonherr, E. , Levkau, B. , Schaefer, L. , Kresse, H. , Walsh, K. , 2001. Decorin-mediated signal transduction in endothelial cells. Involvement of Akt/protein kinase B in up-regulation of p21WAF1/CIP1 but not p27KIP1 . J. Biol. Chem.. 276, 40687–40692. [DOI] [PubMed] [Google Scholar]
- Seoane, J. , Le, H.V. , Shen, L. , Anderson, S.A. , Massagué, J. , 2004. Integration of Smad and forkhead pathways in the control of neuroepithelial and glioblastoma cell proliferation. Cell. 117, 211–223. [DOI] [PubMed] [Google Scholar]
- Shi, Y. , Massagué, J. , 2003. Mechanisms of TGF-β signaling from cell membrane to the nucleus. Cell. 113, 685–700. [DOI] [PubMed] [Google Scholar]
- Siegel, P.M. , Massagué, J. , 2003. Cytostatic and apoptotic actions of TGF-β in homeostasis and cancer. Nat. Rev. Cancer. 3, 807–820. [DOI] [PubMed] [Google Scholar]
- Skopicki, H.A. , Lyons, G.E. , Schatteman, G. , Smith, R.C. , Andrés, V. , Schirm, S. , Isner, J. , Walsh, K. , 1997. Embryonic expression of the Gax homeodomain protein in cardiac, smooth, and skeletal muscle. Circ. Res.. 80, 452–462. [DOI] [PubMed] [Google Scholar]
- Smith, R.C. , Branellec, D. , Gorski, D.H. , Guo, K. , Perlman, H. , Dedieu, J.F. , Pastore, C. , Mahfoudi, A. , Denefle, P. , Isner, J.M. , Walsh, K. , 1997. p21CIP1-mediated inhibition of cell proliferation by overexpression of the gax homeodomain gene. Genes Dev.. 11, 1674–1689. [DOI] [PubMed] [Google Scholar]
- ten Dijke, P. , Goumans, M.-J. , Itoh, F. , Itoh, S. , 2002. Regulation of cell proliferation by Smad proteins. J. Cell. Physiol.. 191, 1–16. [DOI] [PubMed] [Google Scholar]
- ten Dijke, P. , Hill, C.S. , 2004. New insights into TGF-β-Smad signalling. Trends Biochem. Sci.. 29, 265–273. [DOI] [PubMed] [Google Scholar]
- Thuault, S. , Valcourt, U. , Petersen, M. , Manfioletti, G. , Heldin, C.-H. , Moustakas, A. , 2006. Transforming growth factor-β employs HMGA2 to elicit epithelial–mesenchymal transition. J. Cell Biol.. 174, 175–183. [DOI] [PMC free article] [PubMed] [Google Scholar]
- Valcourt, U. , Gouttenoire, J. , Moustakas, A. , Herbage, D. , Mallein-Gerin, F. , 2002. Functions of transforming growth factor-β family type I receptors and Smad proteins in the hypertrophic maturation and osteoblastic differentiation of chondrocytes. J. Biol. Chem.. 277, 33545–33558. [DOI] [PubMed] [Google Scholar]
- Valcourt, U. , Kowanetz, M. , Niimi, H. , Heldin, C.-H. , Moustakas, A. , 2005. TGF-β and the Smad signaling pathway support transcriptomic reprogramming during epithelial–mesenchymal cell transition. Mol. Biol. Cell. 16, 1987–2002. [DOI] [PMC free article] [PubMed] [Google Scholar]
- Witzenbichler, B. , Kureishi, Y. , Luo, Z. , Le Roux, A. , Branellec, D. , Walsh, K. , 1999. Regulation of smooth muscle cell migration and integrin expression by the Gax transcription factor. J. Clin. Invest.. 104, 1469–1480. [DOI] [PMC free article] [PubMed] [Google Scholar]
- Wu, Z. , Guo, H. , Chow, N. , Sallstrom, J. , Bell, R.D. , Deane, R. , Brooks, A.I. , Kanagala, S. , Rubio, A. , Sagare, A. , 2005. Role of the MEOX2 homeobox gene in neurovascular dysfunction in Alzheimer disease. Nat. Med.. 11, 959–965. [DOI] [PubMed] [Google Scholar]