

Abstract
The identification as well as the molecular characterization of breast precancerous lesions in terms of increased risk of progression and/or recurrence is becoming a critical issue today as improved non‐surgical procedures are detecting cancer at an earlier stage. The strategy we have been pursuing to identify early apocrine breast lesions is based on the postulate that invasive apocrine carcinomas evolve from epithelial cells in terminal duct lobular units (TDLUs) in a stepwise manner that involves apocrine metaplasia of normal breast epithelia, hyperplasia, atypia, and apocrine carcinoma in situ. First, we identify specific protein biomarkers for benign apocrine metaplasia and thereafter we search for biomarkers that are highly overexpressed by pure invasive apocrine carcinomas. Here we present studies in which we have used antibodies against components of a benign apocrine signature that includes 15‐prostaglandin dehydrogenase (15‐PGDH), a protein that is expressed by all benign apocrine lesions, and markers that are highly overexpressed by pure invasive apocrine carcinomas such as MRP14 (S100A9), psoriasin (S100A7), and p53 to identify precancerous lesions in sclerosing adenosis (SA) with apocrine metaplasia. The latter is a benign proliferative lesion of the breast that exhibits an increase in the size of the TDLUs and characterized by retained two‐cell lining, and myoepithelial (ME) and stromal hyperplasia. SA with apocrine metaplasia, i.e. apocrine adenosis (AA), presents with a higher degree of atypical apocrine hyperplasia, and these lesions are believed to be precursors of apocrine carcinoma, in situ and invasive. Analysis of 24 selected SA samples with apocrine metaplasia revealed non‐obligate putative apocrine precancerous lesions that displayed some, or in same cases all the three markers associated with pure invasive apocrine carcinomas. These studies also revealed p53 positive, non‐apocrine putative precancerous lesions as well as novel phenotypes for ME and some luminal cells characterized by the expression of cytokeratin 15.
Keywords: Breast precancerous lesions, Sclerosing adenosis, Apocrine carcinomas, Proteomics, 15-PGDH, CK15 positive myoepithelial and luminal cells
Abbreviations
- IHC
immunohistochemistry
- 2D PAGE
two-dimensional polyacrylamide gel electrophoresis
1. Introduction
Apocrine metaplasia of the breast, i.e. the transformation of breast epithelial cells into an apocrine or sweat‐gland type of cells, often occurs in the peripheral parenchyma, particularly among premenopausal women and it is usually associated with gross cysts in fibrocystic breast disease, the most common non‐cancerous disease of the breast (Haagensen, 1986; Rosen, 1997; Durham and Fechner, 2000; Selim et al., 2002a; O'Malley and Bane, 2004; Guinebretière et al., 2005). Fibrocystic breast disease, or fibrocystic change, 1 arises in the ducts, lobules and stroma, and comprises lobular enlargement, adenosis with ductal hyperplasia of usual type (HUT), variable and papillary, as well as apocrine metaplasia, cysts, and fibrosis (Haagensen, 1986 and references therein). Fibrocystic disease is believed to be brought about by hormonal changes that most likely involve estrogen and progesterone, and is frequently observed in women between 30 and 50 years of age (Guinebretière et al., 2005). Fibrocystic changes, however, are much less frequent in postmenopausal women who are not under hormone replacement therapy.
Apocrine metaplasia can occur both in lobules and ducts in the terminal duct lobular units (TDLUs) (Wellings et al., 1975). Dilated cystic acini often develop into type I apocrine microcysts that can coalesce with other microcysts to form large nodular masses or macrocysts (Celis et al., 2006a and references therein). Apocrine metaplasia of the cells lining the cysts is classified into simple, complex with small papillae, and highly complex with interconnecting bars and bridges (O'Malley and Bane, 2004). The cells have an abundant eosinophilic granular cytoplasm with secretory granules in the apical cytoplasm and apical snouts that shed into the lumen (Haagensen, 1986; Tavassoli and Norris, 1994). Apocrine metaplasia of the ducts can arise in areas adjacent to columnar cells (Schnitt and Vincent‐Salomon, 2003; Simpson et al., 2005; Dabbs et al., 2006 and references therein), and in cells undergoing papillary proliferation, some of which may show atypia. 2 Apocrine lesions are estrogen (ER) and progesterone (PR) receptors negative, but express the androgen receptor (AR) (Celis et al., 2006a; Tavassoli et al., 1996; Gatalica, 1997). Until recently, the gross cystic disease fluid protein (GCDFP‐15), a 15‐kDa glycoprotein present in the cystic fluid of fibrocystic breast disease, was the only putative marker that was available to detect apocrine metaplasia (Mazoujian et al., 1983). However, this protein is also expressed by some non‐apocrine breast epithelial cells, a fact that has precluded its use as a marker for early stages of apocrine metaplasia (Celis et al., 2006a; Mazoujian et al., 1983; Viacava et al., 1998). Today, the best‐known markers to detect apocrine lesions of the breast are 15‐prostaglandin dehydrogenase (15‐PGDH) and hydroxymethyl‐glutaryl‐CoA reductase (HMG‐CoA reductase) (Celis et al., 2006a).
The relation between benign apocrine metaplastic epithelium and invasive apocrine cancer has been a matter of discussion for many years as these lesions have been considered as either precursors in malignant apocrine transformation, or as benign lesions with no correlation with malignancy (Celis et al., 2006a; Wellings and Alpers, 1987; Haagensen, 1991; Ness et al., 1993; Wells et al., 1995; Seidman et al., 1996; Bruzzi et al., 1997; Jones et al., 2001 and references therein). Molecular studies of proliferative apocrine lesions have revealed abnormal expression of some oncogenes (ras, c‐myc, c‐erbB2, and p53) (Guinebretière et al., 2005; Wells et al., 1995; Papamichalis et al., 1988; McCann et al., 1989; Agnantis et al., 1992; Moriya et al., 2000; Selim et al., 2002b), and abnormal expression of c‐myc in particular has been associated with proliferation and malignant conversion of these lesions (Selim et al., 2002b). Genetic alterations have also been identified in micropapillary apocrine hyperplasia by comparative genomic hybridization (CGH): these include gain of 2q, 13q, and 1p, as well as losses of 1p, 17q, 22q, 2p, 10q, and 16q (Jones et al., 2001). Some of these changes show considerable overlap with those observed in apocrine carcinoma in situ (ACIS) and invasive apocrine carcinoma, indicating that some apocrine lesions may be clonal in origin (Jones et al., 2001). Loss of heterozygosity and allelic imbalance (Selim et al., 2001) have also been reported in apocrine adenosis (AA) (Wells et al., 1995; Seidman et al., 1996; Simpson and Page, 1990; Carter and Rosen, 1991; Page and Simpson, 2001), a lesion that presents with apocrine cytology in lobular units associated with sclerosing adenosis (SA) 3 a proliferative condition that exhibits an increase in the size of the TDLUs of the breast and that is characterized by retained two‐cell lining and myoepithelial (ME) and stromal hyperplasia (Haagensen, 1986; Durham and Fechner, 2000). AA lesions have been associated with increased atypical hyperplasia 4 (Seidman et al., 1996), proliferation, as well as with aggressive breast cancer (Wells et al., 1995; Endoh et al., 2001).
Given that most types of invasive breast cancer are deemed to evolve over extended periods of time from pre‐existing benign precursors (Allred et al., 2001; Allred and Mohsin, 2000), and considering that improved non‐surgical diagnostic techniques are detecting cancer at an earlier stage (Kerlikowske et al., 1995; Olsen and Gotzsche, 2001), it is urgent to develop strategies that will facilitate the identification of precancerous lesions, and to pinpoint those that are associated with an increased risk of recurrence/progression (Krishnamurthy and Sneige, 2002; Stoll, 1999). The strategy we have pursued to identify early apocrine breast lesions is based on the postulate that invasive apocrine carcinomas evolve from epithelial cells in TDLUs in a stepwise manner, going through sequential stages that involve apocrine metaplasia of normal breast epithelia, hyperplasia, apocrine atypia, and ACIS (Allred et al., 2001; Celis et al., 2006b). First, we identify specific protein biomarkers for benign apocrine metaplasia by comparing the global protein expression profiles of non‐malignant breast epithelia and apocrine cells (Celis et al., 2006a) and thereafter, we search for biomarkers that are highly overexpressed by pure invasive apocrine carcinomas by comparing their protein expression profiles with those of benign apocrine cells (Celis et al., 2006b). Specific antibodies are then used by IHC to look for precancerous lesions as these are expected to express some of the molecular markers that typify invasive cancer (Berman et al., 2006). So far, our studies have led to the identification of a protein signature that is able to discriminate between benign and putative precancerous apocrine lesions (Celis et al., 2006b).
Here we present studies in which we have used antibodies against components of the benign apocrine signature in combination with proteomic technologies and immunohistochemistry (IHC) to identify precancerous lesions in SA with apocrine metaplasia, as some of these lesions are believed to be precursors of apocrine carcinoma, in situ and invasive (Wells et al., 1995; Seidman et al., 1996; Selim et al., 2001; Endoh et al., 2001).
2. Experimental procedures
2.1. Sample collection and handling
Twenty‐three selected cases of histologically diagnosed SA with apocrine metaplasia as well as one case identified in the mastectomy of one patient (patient 23) presenting with a concomitant carcinoma were analyzed in this study. Clinicopathological data for the individual cases are given in Table 1. The age of the patients ranged from 25 to 83 years (mean 49 years). Paraffin‐embedded breast tissue specimens, including 61 unselected control cases of non‐malignant breast tissue from mastectomies and 101 carcinomas, were collected at the Copenhagen University Hospital, Denmark as part of a large translational breast cancer research project involving high‐risk breast cancer patients (Celis et al., 2003, 2005, 2005, 2006). When available, fresh tissue samples were placed immediately in liquid nitrogen and stored at −80°C. The project was approved by the Scientific and Ethical Committee of the Copenhagen and Frederiksberg Municipalities (KF 01‐069/03).
Table 1.
Clinical data of patients with sclerosing adenosis and apocrine metaplasiaa
| Patient number | Age (years) | Presence of concomitant carcinoma | Histopathological data | ||
|---|---|---|---|---|---|
| Tumour type | Gradeb | Receptor statusc | |||
| 1 | 55 | Yes, same breast | Invasive, ductal | I | ER+, PR+ |
| 2 | 35 | No | |||
| 3 | 54 | Yes, same breast | Invasive, ductal | II | ER+, PR+ |
| 4 | 42 | No | |||
| 5 | 28 | No | |||
| 6 | 68 | Yes, same breast | DCIS | I–II | ER+, PR+ |
| 7 | 49 | No | |||
| 8 | 60 | Yes, same breast | Invasive, ductal, tubular | I | ER+, PR+ |
| 9 | 32 | No | |||
| 10 | 32 | No | |||
| 11 | 33 | No | |||
| 12 | 61 | No | |||
| 13 | 32 | No | |||
| 14 | 59 | Yes, same breast | Invasive, ductal | I | ER+, PR+ |
| 15 | 54 | No | |||
| 16 | 43 | No | |||
| 17 | 54 | No | |||
| 18 | 25 | No | |||
| 19 | 64 | No | |||
| 20 | 63 | Yes, same breast | Invasive, ductal | III | ER+, PR+ |
| 21 | 48 | No | |||
| 22 | 43 | Yes, same breast | DCIS | I | ER+, PR+ |
| 23d | 83 | Yes, same breast | Invasive, ductal | III | ER‐, PR‐ |
| 24 | 58 | Yes, same breast | Invasive, lobular | III | ER+, PR+ |
Determined based on histological parameters.
The histological malignancy grade was determined according to Elston and Ellis (1991).
ER and PR status was determined by IHC analysis according to Danish Breast Cancer Cooperative Group (DBCG) guidelines. Tumours were regarded as negative when both receptors were expressed in less than 10% of tumor cell nuclei.
This lesion was identified in the mastectomy of this patient.
2.2. Cultured cells
The MCF‐10A cell line was obtained from the American Type Culture Collection (Manassas, VA). The cell line was cultured in Dulbecco's modified Eagle's medium (DMEM/F12 1:1; Invitrogen Corp., Carlsbad, CA) supplemented with 5% heat‐inactivated fetal horse serum, 20ng/ml epidermal growth factor (Invitrogen Corp., Carlsbad, CA), 500ng/mL hydrocortisone (Sigma–Aldrich), 100ng/mL cholera toxin (Calbiochem EMD Biosciences, Inc., San Diego, CA) and 10μg/mL bovine insulin. Cells were sub‐cultured once a week and seeded at a concentration of 100 000 cells per 25cm flasks.
2.3. Two‐dimensional gel electrophoresis and western immunoblotting
2D polyacrylamide gel electrophoresis (isoeletric focussing (IEF) and non‐equilibrium pH gradient electrophoresis (NEPHGE)) (Celis et al., 2006c), and Western immunoblotting (Celis et al., 2006d) were performed as previously described. Twenty to thirty, six‐micron cryostat sections of frozen tissues were resuspended in 0.1ml lysis solution (O'Farrell, 1975) and were kept at −20°C until used (Celis et al., 2005b). Forty microlitres were applied to the gels. The first and last sections of each sample were used for immunofluorescence analysis using cytokeratin 19 (CK19) antibodies as this epithelial marker is ubiquitously expressed by mammary epithelial cells (Moll, 1998). The availability of these pictures greatly facilitated the interpretation of the gel data as it gave a rough estimate of the ratio of glands/tumour cells to stromal tissue. 2D gels were analyzed using PDQUEST software from BioRad. Silver staining, compatible with mass spectrometry, was performed according to published procedures (Gromova and Celis, 2006).
2.4. Protein identification by mass spectrometry
Protein spots were excised from dry gels and the gel pieces were rehydrated in water. Gel pieces were detached from the cellophane film and cut into about 1mm2 pieces followed by proteins “in‐gel” digestion as previously described (Celis et al., 2004). Samples were prepared for analysis by applying 2μl of digested and extracted peptides on the surface of a 400/384 AnchorChip target (Bruker Daltonik, GmbH), followed by co‐crystallization with α‐cyano matrix (Shevchenko et al., 1996). Mass spectrometry was performed using a Reflex IV MALDI‐TOF mass spectrometer equipped with a Scout 384 ion source. All spectra were obtained in positive reflector mode with delayed extraction, using an accelerating voltage of 28kV. The resulting mass spectra were internally calibrated using the auto‐digested tryptic mass values visible in all spectra. Calibrated spectra were processed by Xmass 5.1.1 and BioTools 2.1 software packages (Bruker Daltonik, GmbH). No restriction on the protein molecular mass and taxonomy was applied. A number of fixed (acrylamide modified cystein, i.e. propionamide/carbamidomethylation) and variable modifications (methionine oxidation and protein N‐terminus acetylation) were included in the search parameters. The peptide tolerance did not exceed 50ppm and as a maximum only one trypsin missed cleavage was allowed. The protein identifications were considered to be confident when the protein score of the hit exceeded the threshold significance score of 70 (p<0.05) and nor less than six peptides were recognized. Whenever the protein score hit was close to the threshold significance score of 70, the Post Source Decay (PSD) was performed as an additional mean to confirm the identity of the proteins identified by PTM. The following PSD search parameters were used: peptide tolerance 50ppm and MS/MS tolerance 1Da without any restriction on the protein molecular mass and taxonomy. Since the amount of peptides extracted from the silver stained gels did not yield overall peak intensities high enough to allow multiple peptide sequencing (pre‐requirement for conclusive PSD analysis), the identification of proteins was never made solely based on PSD analysis. The database was checked for redundancy and whenever possible SwissProt accession numbers were assigned.
2.5. Antibodies
Anti‐peptide antibodies against MRP14 (S100A9) (EP 010100), the adipocyte fatty acid binding protein (A‐FABP) (EP 023215), and CK5 (EP 043333) were prepared by Eurogentec (Liege, Belgium). Monoclonal antibodies against p53 (clone DO‐7), p63 (clone 4A4), smooth muscle alpha actin (SMA; clone 1A4), androgen receptor (AR; clone AR441), estrogen receptor alpha (ER; clone 1D5), progesterone receptor (clone PgR636) and Ki67 (clone MIB‐1) were purchased from DakoCytomation (Glostrup, Denmark). Monoclonal antibodies recognizing CKs 14 (clone LL002), 15 (clone LHK15), and 19 (clone A53‐B/A2.26) were from NeoMarkers (Labvision, CA). The monoclonal antibodies against CKs 7 (clone RCK105) and 8 (clone M20) were purchased from MP Biomedicals (Irvine, CA). The monoclonal antibody against psoriasin (S100A7) (Ostergaard et al., 1999) and the rabbit polyclonal antibody against 15‐PGDH (Celis et al., 1996, 2006) have been previously described. The monoclonal antibody 57B, which has been shown to recognize MAGE‐4 in paraffin‐embedded sections was kindly provided by Dr. G.C. Spagnoli, Basel, Switzerland (Rimoldi et al., 2000; Landry et al., 2000). The specificity of most of the antibodies used in this work was determined by 2D PAGE immunoblotting and the results are shown in Figure 1 (only the relevant fractions of the 2D gel blots are shown). With the exception of the CK5 immunoblot (Figure 1G) which corresponds to an NEPHGE 2D gel, all other blots correspond to IEF 2D gel separations. The specificity of the A‐FABP antibody has been previously described (Celis et al., 2005b).
Figure 1.
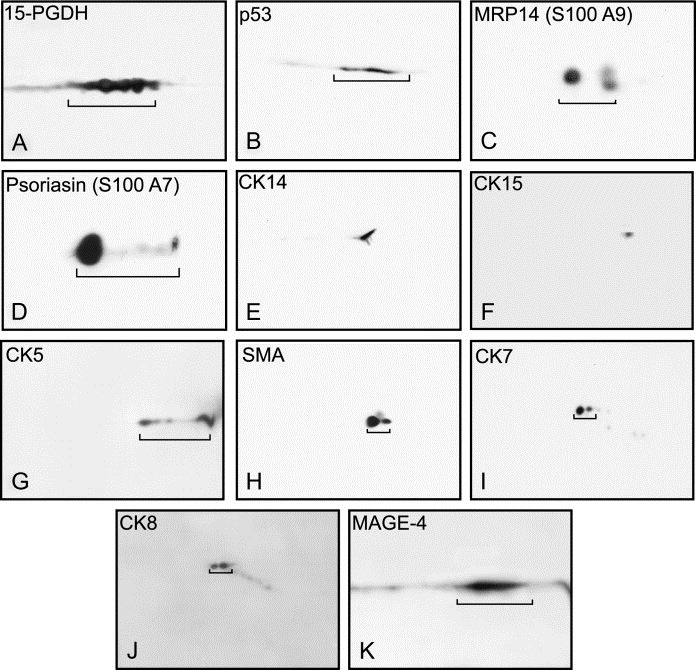
2D gel Western blotting of whole breast tumour extracts reacted with various antibodies. (A) 15‐PGDH (dilution 1:1000; IEF). (B) p53 (dilution 1:1000; IEF). (C) MRP14 (dilution 1:500; IEF). (D) Psoriasin (dilution 1:1000; IEF). (E) CK14 (dilution 1:2000; IEF). (F) CK15 (dilution 1:500; IEF). (G) CK5 (dilution 1:4000; NEPHGE). (H) SMA (dilution 1:2000; IEF). (I) CK7 (dilution 1:500; IEF). (J) CK8 (dilution 1:500; IEF). (K) MAGE‐4 (dilution 1:12; IEF).
2.6. Immunohistochemistry (IHC)
Following surgery, fresh tissue blocks were immediately placed in formalin fixative and paraffin embedded for archival use. Six‐micron sections were cut from the tissue blocks and mounted on Super Frost Plus slides (Menzel‐Gläser, Braunschweig, Germany), baked at 60°C for 60min, deparaffinised, and rehydrated through graded alcohol rinses (Moreira et al., 2005). Heat‐induced antigen retrieval was performed by immersing slides in 10mM citrate buffer (pH 6.0) and microwaving in a 750‐W microwave oven for 10min. The slides were then cooled at room temperature for 20min and rinsed abundantly in tap water. Non‐specific staining of slides was blocked (10% normal goat serum in PBS buffer) for 15min, and endogenous peroxidase activity quenched using 0.3% H2O2 in methanol for 30min. Antigen was detected with a relevant primary antibody, followed by a suitable secondary antibody conjugated to a peroxidase complex (HRP conjugated goat anti‐rabbit or anti‐mouse antibody; DakoCytomation, Glostrup, Denmark). Finally, colour development was done with 3,3′‐diaminobenzidine (Pierce, IL, USA) as a chromogen to detect bound antibody complex. Slides were counterstained with hematoxylin. Standardization of the dilution, incubation, and development times appropriate for each antibody allowed an accurate comparison of expression levels in all cases. At least three independent stainings of the samples were performed for each antibody. Sections were imaged using either a standard bright field microscope (Leica DMRB) equipped with a high‐resolution digital camera (Leica DC500), or a motorized digital microscope (Leica DM6000B) controlled by Objective Imaging's Surveyor Software (Objective Imaging Ltd, UK) for automated scanning and imaging which enables tiled mosaic image creation. Original magnification for all images is 200×.
2.7. Immunofluorescence on paraffin sections
Fresh tumours were placed in formalin fixative and paraffin‐embedded for archival use. Five‐μm sections were cut from paraffin blocks of breast tissue samples mounted on Super Frost Plus slides (Menzel‐Gläser, Braunschweig, Germany), baked at 60°C for 60min, deparaffinised, and rehydrated through graded alcohol rinses. Heat‐induced antigen retrieval as well as additional steps were carried out as described above. Antigens were detected by overnight incubation at 4°C with primary antibodies at the appropriate dilution conjugated to Alexa Fluor® 488, Alexa Fluor® 594, and Alexa Fluor® 633 (Molecular Probes, OR, USA) or counterstained with TO‐PRO‐3. Sections were imaged using confocal laser scanning microscopy (Zeiss 510LSM).
3. Results
3.1. Apocrine changes in sclerosing adenosis
Twenty‐three cases of histologically diagnosed SA with apocrine metaplasia, as well as one case identified in the mastectomy specimen of one high‐risk breast cancer patient (patient 23), were analyzed in this study. Seven of the lesions were associated with concomitant invasive carcinoma and two with DCIS. In all cases, the carcinomas arose in the same breast as the SA lesion (Table 1).
To categorize the type of apocrine structures present in the SA samples we immunostained paraffin‐embedded tissue sections with an antibody recognizing 15‐PGDH, a protein biomarker that we have shown is expressed in the breast solely by apocrine cells (Celis et al., 2006, 2006). The antibody is able to identify single cells undergoing apocrine metaplasia and therefore it provided us with a unique probe to reveal all of the apocrine changes present in the tissue preparations we examined. As illustrated in Figure 2 with the sample from patient 11, we detected a spectrum of morphologically distinct apocrine changes that included AA (Figure 2A), apocrine hyperplasia (Figure 2B), as well as apocrine microcysts (black arrow in Figure 2C; type I microcysts). In addition, we observed columnar cell changes and intraductal papillomas free of apocrine metaplasia (Figure 2D) as well as type II microcysts (blue arrow in Figure 2C) (Angeli et al., 1990; Pinder and Reis‐Filho, 2006) that did not stain with the 15‐PGDH antibody. 15‐PGDH staining was mainly observed in the cytoplasm of apocrine cells, although in some cases nuclear staining was also detected (arrow in Figure 2A). A summary of the various apocrine changes observed in each one the 24 SA cases analyzed is presented in Table 2. SA lesions presenting with a wider range of apocrine changes are listed at the top.
Figure 2.
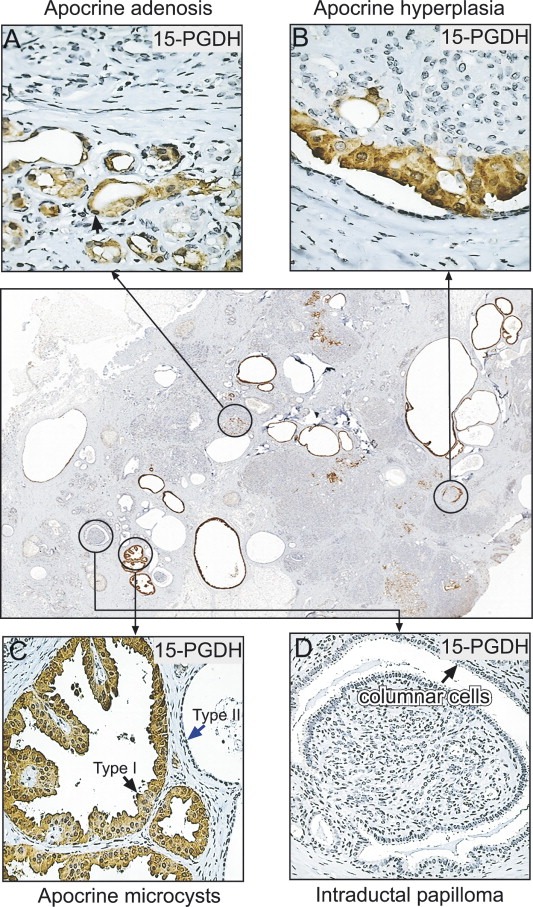
Identification of the various structures observed in sclerosing adenosis with apocrine metaplasia in a tissue section of patient 11 stained with the 15‐PGDH antibody. (A) Apocrine adenosis (arrow indicates nuclear staining). (B) Apocrine hyperplasia. (C) Apocrine microcysts. Arrows indicate type I (apocrine; black arrow) and type II (non‐apocrine; blue arrow) microcysts. (D) Intraductal papilloma and columnar cell changes. The antibody was used at a dilution 1:4000.
Table 2.
Apocrine lesions in sclerosing adenosis with apocrine metaplasia
| Patient number | Lesions | |||||
|---|---|---|---|---|---|---|
| Apocrine adenosisa | Apocrine hyperplasiab | Apocrine microcystsc | ||||
| Presence as defined by 15‐PGDH expression | Areas with precancerous lesionsd | Presence as defined by 15‐PGDH expression | Areas with precancerous lesionsd | Presence as defined by 15‐PGDH expression | Areas with precancerous lesionsd | |
| 2 | Yes | No | Yes | No | Yes | No |
| 5 | Yes | Yes | Yes | Yes | Yes | Yes |
| 10 | Yes | Yes | Yes | Yes | Yes | Yes |
| 11 | Yes | Yes | Yes | Yes | Yes | Yes |
| 14 | Yes | Yes | Yes | Yes | Yes | Yes |
| 20 | Yes | nde | Yes | nde | Yes | No |
| 6 | Yes | No | No | Yes | No | |
| 12 | Yes | No | No | Yes | No | |
| 15 | Yes | Yes | No | Yes | Yes | |
| 17 | Yes | Yes | No | Yes | Yes | |
| 22 | Yes | Yes | No | Yes | No | |
| 23 | Yes | No | No | Yes | nde | |
| 24 | Yes | Yes | No | Yes | Yes | |
| 3 | Yes | No | No | No | ||
| 18 | No | Yes | Yes | Yes | No | |
| 1 | No | No | Yes | No | ||
| 4 | No | No | Yes | No | ||
| 7 | No | No | Yes | No | ||
| 8 | No | No | Yes | No | ||
| 9 | No | No | Yes | Yes | ||
| 13 | No | No | Yes | No | ||
| 16 | No | No | Yes | Yes | ||
| 19 | No | No | Yes | No | ||
| 21 | No | No | Yes | No | ||
Apocrine cytology in lobular units associated with sclerosing adenosis.
Papillary lesions with hyperplasia (usual ductal and columnar) and apocrine metaplasia.
Fluid filled structures lined by apocrine cells with abundant eosinophilic granular cytoplasm, secretory granules in the apical cytoplasm as well as apical snouts.
As defined by p53 and/or MRP14 expression.
Not determined.
3.1.1. Identification of apocrine precancerous lesions
Currently, cytological apocrine atypia is diagnosed based solely on morphological criteria, a fact that has hampered the study of these lesions. To objectively define apocrine changes with molecular atypia we immunostained paraffin‐embedded tissue sections of SA samples with specific antibodies against components of a protein signature that characterises benign apocrine metaplasia (Celis et al., 2006b). This includes: (i) 15‐PGDH, a protein that is expressed by all benign apocrine lesions (Celis et al., 2006a), (ii) markers that are highly overexpressed by pure invasive apocrine carcinomas such as MRP14 or S100A9 (Arai et al., 2004; Carlsson et al., 2005; Gebhardt et al., 2006), psoriasin or S100A7 (Carlsson et al., 2005; Madsen et al., 1991; Krop et al., 2005; Skliris et al., 2006), and (iii) p53 as mutations in the p53 gene, leading to the over expression of the protein, are amongst the most common molecular changes detected in breast cancer (Clahsen et al., 1998; Rohan et al., 2006; Herceg and Hainaut, in this issue; Lacroix, 2006). 5 Given that both MRP14 and psoriasin have been linked with a high risk of progression to invasive disease (Carlsson et al., 2005; Krop et al., 2005), and considering that p53 gene changes have been associated with an increased risk of progression in patients with benign breast disease (Rohan et al., 2006), we hypothesized that areas containing apocrine cells expressing one, or a combination of any of these markers, may correspond to non‐obligate putative precancerous lesions, i.e. precursors that precede the appearance of invasive cancers (Berman et al., 2006).
IHC analysis of the 24 SA samples with antibodies against these markers revealed putative precancerous lesions in some of the patients, and the results are briefly described below for each one of the types of apocrine changes we have observed (exemplified in Figure 2A–C).
3.1.1.1. Apocrine adenosis
Of the 24 SA samples analyzed, 14 showed areas with AA as judged by staining with the 15‐PGDH antibody (Table 2). The majority of the cells in these areas were p53 negative and displayed an immunophenotype similar to that observed in apocrine metaplasias of the usual type, that is they were 15‐PGDH positive and MRP14 and psoriasin negative (Celis et al., 2006, 2006). In samples from eight cases (patients 5, 10, 11, 14, 15, 17, 22, and 24), however, we observed AA areas with some p53 immunopositive cells as exemplified in Figure 3A (patient 14) (Wells et al., 1995). These cells were 15‐PGDH (Figure 3B) and MRP14 positive (Figure 3C) as judged by IHC analysis of serial tissue sections (Celis et al., 1999a). Only a few of the p53 and/or MRP14 immunopositive cells, however, expressed psoriasin (arrow in Figure 3D). We also observed p53 negative apocrine cells that were positive for MRP14 (results not shown). Since the expression of psoriasin seemed to be a later event in progression, we decided to use only p53 and MRP14 as markers for molecular atypia and consequently, considered AA areas with p53 and/or MRP14 positive cells as corresponding to putative non‐obligate precancerous lesions (Table 2).
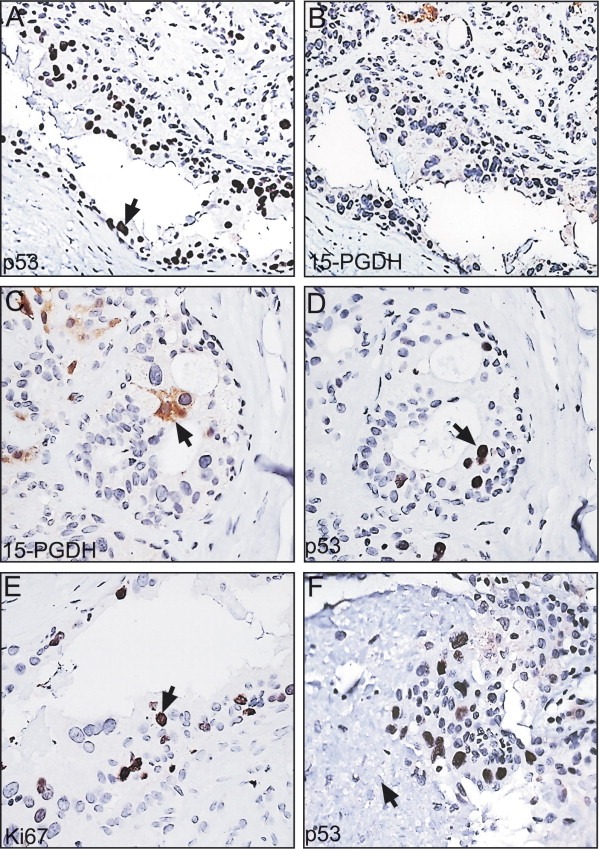
Figure 3.
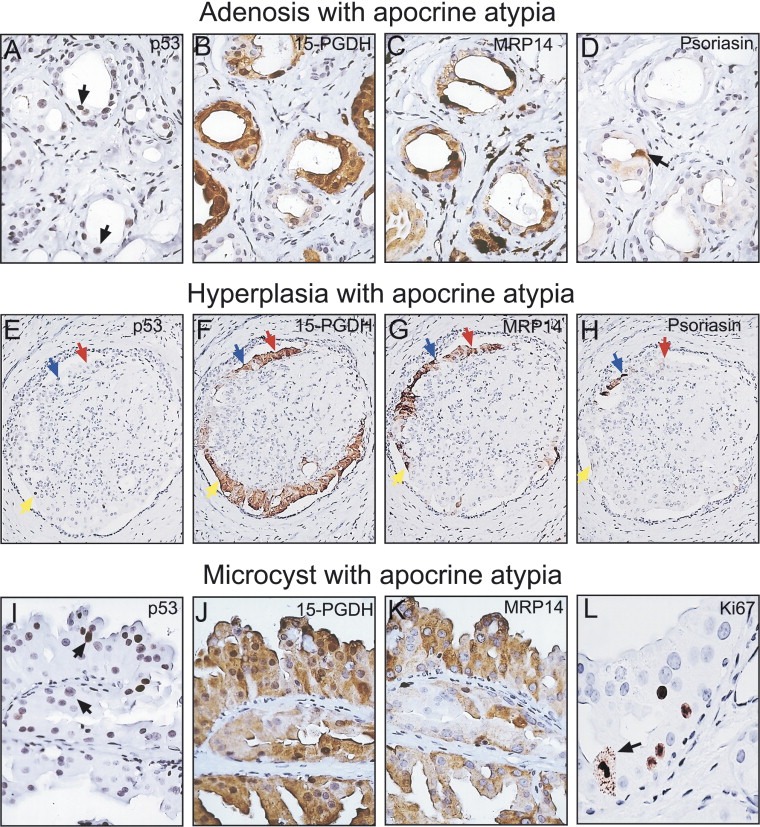
Analyses of the various structures observed in sclerosing adenosis. Serial paraffin‐embedded tissue sections were reacted with antibodies against components of the benign apocrine phenotype. Adenosis with apocrine atypia (patient 14): (A) p53. (B) 15‐PGDH. (C) MRP14. (D) Psoriasin. Hyperplasia with apocrine atypia (patient 11): (E) p53. (F) 15‐PGDH. (G) MRP14. (H) Psoriasin. Blue arrows indicate cells that are p53, 15‐PGDH, MRP14, and psoriasin positive. Yellow arrows indicate cells that are positive for p53, 15‐PGDH, and MRP14, but negative for psoriasin. Red arrows indicate cells that are negative for p53 and psoriasin, but are 15‐PGDH and MRP14 positive. Microcysts with apocrine atypia (patient 14): (I) p53. ( J) 15‐PGDH. (K) MRP14. (L) Ki67 (arrow indicates a mitotic cell). The following antibody dilutions were used: p53 (1:250), 15‐PGDH (1:4000), MRP14 (1:1000), psoriasin (undiluted culture supernatant), and Ki67 (1:200).
Staining of various SA samples with antibodies against the proliferation marker Ki67 (Weidner et al., 1994; Pinder et al., 1995; van Diest et al., 2004) showed that the proliferation rate of cells in p53 positive AA areas was enhanced as compared to p53 negative ones (results not shown), concurring with previously published studies (Wells et al., 1995; Selim et al., 2002b).
3.1.1.2. Apocrine hyperplasia
Papillary lesions with apocrine hyperplasia were observed in seven of the cases analyzed (patients 2, 5, 10, 11, 14, 18 and 20; Table 2). As exemplified in Figure 3E with a sample from patient 11, these lesions contained few p53 immunopositive apocrine cells. At least three phenotypes were detected: (i) cells positive for p53, 15‐PGDH, MRP14, and psoriasin (blue arrows in Figure 3E–H); (ii) cells positive for p53, 15‐PGDH, and MRP14, but negative for psoriasin (yellow arrows in Figure 3 E‐H); and (iii) cells negative for p53 and psoriasin, but positive for 15‐PGDH and MRP14 (red arrows in Figure 3E–H). As in the case of AA, areas with cells that were p53 and/or MRP14 positive were considered to correspond to putative non‐obligate precancerous lesions (Table 2).
3.1.1.3. Apocrine microcysts
With the exception of the sample from patient 3, all the SA preparations analyzed contained type I microcysts (Table 2) that were lined by apocrine cells with abundant eosinophilic granular cytoplasm, secretory granules in the apical cytoplasm as well as apical snouts (O'Malley and Bane, 2004) (see Figure 2C). The cells showed simple, papillary, and complex patterns. Samples from nine patients showed a few apocrine microcysts with p53 positive cells (Figure 3I; patient 14) that expressed 15‐PGDH (Figure 3J), and MRP14 (Figure 3K), but were negative for psoriasin (not shown). p53 immunopositive areas exhibited an enhanced proliferative index as determined by staining with the Ki67 antibody, and in a few cases mitotic figures were observed (arrows in Figure 3L). We also encountered p53 negative apocrine cells that expressed MRP14, just as in the case of the other apocrine structures (results not shown). As in the case of AA, microcysts containing cells that were p53 and/or MRP14 positive were considered to correspond to putative non‐obligate precancerous lesions (Table 2).
3.2. Non‐apocrine p53 positive lesions
Patients 23 and 14 exhibited in addition to apocrine lesions (1, 2), 15‐PGDH negative ductal hyperplastic areas with atypical cytology and pleomorphic nuclei that stained strongly with the p53 antibody. Given that p53 gene changes have been associated with an increased risk of progression in patients with benign breast cancer disease (Rohan et al., 2006), and taking into account the fact that both patients presented with concomitant invasive ductal carcinomas (Table 1), we decided to analyze these lesions in more detail in an effort to ascertain their relationship, if any, with the concomitant invasive ductal carcinomas.
3.3. Patient 23
Biopsies from two adjacent areas located at about 2cm or more from the tumour mass were analyzed (lesions I and II). Lesion I was enriched in areas with AA, while lesion II presented with a few apocrine microcysts intermingled with atypical ductal hyperplasia. The latter lesions contained large, flat ductal cells that were 15‐PGDH negative (Figure 4B) and p53 positive (Figure 4E), just like the tumour biopsy from the same patient (Figure 4C and F). Apocrine cells in lesion I, however, were p53 negative (Figure 4D), but reacted positively with the 15‐PGDH antibody as expected (Figure 4A).
Figure 4.
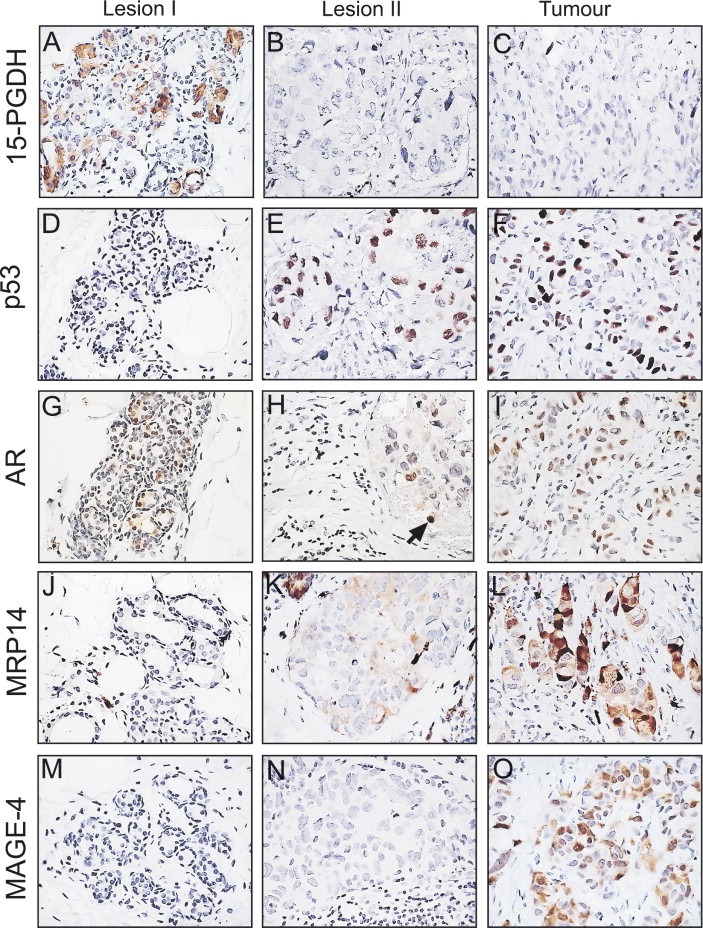
IHC analysis of paraffin‐embedded sections of tissue biopsies from patient 23 stained with various specific antibodies. (A, D, G, J and M) Lesion I stained with antibodies against (A) 15‐PGDH, (D) p53, (G) AR, (J) MRP14, and (M) MAGE‐4. (B, E, H, K and N) Lesion II stained with antibodies against (B) 15‐PGDH, (E) p53, (H) AR, (K) MRP14, and (N) MAGE‐4. (C, F, I, L and O) Tumour biopsy stained with antibodies against (C) 15‐PGDH, (F) p53, (I) AR, (L) MRP14, and (O) MAGE‐4. The MAGE‐4 and AR antibodies were both used at a dilution of 1:100. All other antibodies were used at the dilutions given in the legend of Figure 3.
Receptor status analysis of the tumour cells by means of IHC indicated that they were ER and PR negative (Table 1), but expressed AR (Figure 4I). Similar analysis of lesions I and II showed that the cells were ER and PR negative, but only apocrine cells in lesion I showed staining of all apocrine cells with the AR antibody (Figure 4G). Only scattered cells stained positively in lesion II (indicated with an arrow in Figure 4H). IHC analysis of sections immunostained with the Ki67 antibody showed that the p53 positive cells in lesion II and in the tumour exhibited a much higher proliferative index as compared to the p53 negative cells in lesion I (results not shown).
Given the similarity between the immunophenotypes of most of the cells in lesion II and the tumour biopsy (Figure 4), and taking advantage of the fact that in both cases we had collected small biopsies of fresh tissue material, we proceeded to analyze their proteome expression profiles using 2D PAGE in combination with MALDI‐TOF mass spectrometry in an effort to gain additional information as to their relatedness. The results, which are presented in Figure 5 showed a remarkable similarity, both qualitatively and quantitatively, between the protein expression profiles of both samples, hence supporting the IHC observations. Cells in both biopsies expressed CKs 7, 8, 18 and 19 (Figure 5A; Table 3), validating their epithelial origin. These observations were further corroborated by IHC staining (results not shown). Only very few proteins were overexpressed in the tumour sample by a factor of 2 or more, and these included MRP14, A‐FABP, and glycerol‐3‐phosphate dehydrogenase (indicated with red arrows in Figure 5A) (Table 3). Of these, only the increased levels of MRP14 could be further validated by IHC (compare Figure 4K and L). Both A‐FABP and the glycerol‐3‐phosphate dehydrogenase were shown to be derived from fat tissue present within the lesions. In the case of A‐FABP we reached this conclusion based on IHC staining, while in the case of glycerol‐3‐phosphate dehydrogenase we relied on proteomic data generated on pure breast fat tissue (Celis et al., 2005b).
Figure 5.
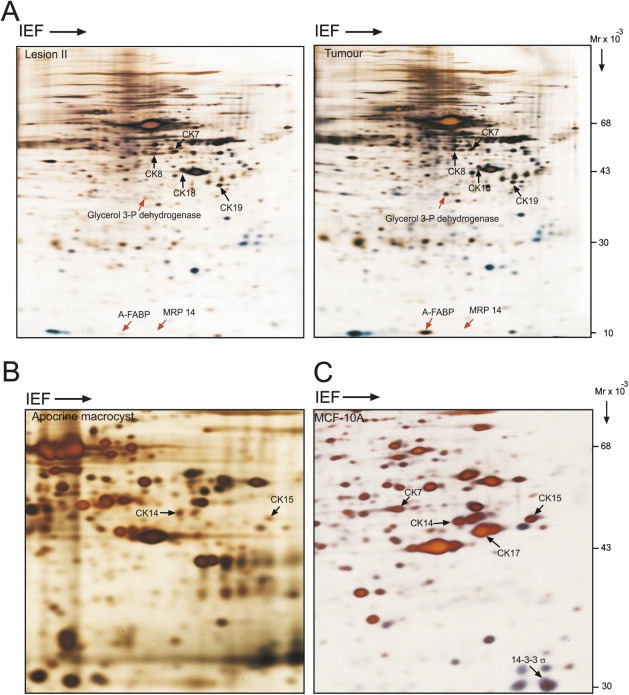
IEF 2D gels of whole protein extracts stained with silver nitrate. (A) Lesion II and tumour biopsy from patient 23. (B) Apocrine macrocyst with ME hyperplasia. (C) Non‐malignant mammary cell line MCF‐10A. Exponentially growing MCF‐10A cells were resuspended in lysis solution as previously described Celis et al., 2006d. The identity of the proteins indicated with arrows was determined by mass spectrometry (see also Table 3).
Table 3.
Protein identification by mass spectrometrya
| Protein name | Acc number (SwissProt)b | Acc number (UniGene)c | Gene Map Locus | Mm/pId | Scoree | Coverage (%) | Number of recognized peptides |
|---|---|---|---|---|---|---|---|
| Cytokeratin 7 | P08729 | KRT7/SCL | 12q12–q13 | 51/5.5 | 267 | 43 | 25 |
| Cytokeratin 8 | P05787 | KRT8/CYK8 | 12q13 | 53.5/5.5 | 238 | 40 | 40 |
| Cytokeratin 14 | P02533 | KRT14 | 17q12–q21 | 51.6/5.1 | 200 | 43 | 16 |
| Cytokeratin 15 | P19012 | KRT15 | 17q21.2 | 49/4.7 | 222 | 35 | 17 |
| Cytokeratin 18 | P05783 | KRT18/CYK18 | 12q13 | 48/5.3 | 206 | 34 | 18 |
| Cytokeratin 19 | P08727 | KRT19 | 17q21.2 | 44/5.04 | 316 | 54 | 26 |
| Fatty acid binding protein, adipocyte (A‐FABP) | P15090 | FABP4 | 8q21 | 14.7/6.8 | 130 | 45 | 8 (PSD: 935.48) |
| Glycerol‐3‐phosphate dehydrogenase [NAD+], cytoplasmic, GPDH‐C | P21695 | GPD1 | 12q12–q13 | 38/5.8 | 304 | 53 | 21 (PSD: 1556.79) |
| MRP14 (S100A9) | P06702 | S100A9/CAGB, MRP14 | 1q12–q22 | 13.5/5.7 | 148 | 60 | 8 |
| 14‐3‐3‐Sigma (Stratifin) | P31947 | SFN/HME1 | 1p36.11 | 27.8/4.8 | 90 | 35 | 8 |
Protein identifications from tumour biopsy, apocrine microcyst from patient 23, and MCF‐10A cells are presented.
Whenever possible, the SwissProt accession number was used.
UniGene accession number was used.
The Mr and pI were calculated directly from the sequences.
Ions score is −10*Log (P), where P is the probability that the observed match is a random event. The protein score exceeded the threshold significance score of 74 (p < 0.05) in all cases and therefore, all identifications are confident.
Considering the fact that 2D gels loaded with total protein extracts and developed by silver staining only reveal differences in the expression for relatively abundant proteins, we explored other means to determine how closely related lesion II and the tumour really were. Our ongoing studies of invasive breast carcinomas dissected from mastectomies of high‐risk breast cancer patients using gel‐based proteomics and IHC (Celis et al., 2003, 2006, 2006, unpublished observations) have so far revealed a few protein markers that are expressed by only a small percentage of the cancers analyzed. One such marker is MAGE‐4, a tumour associated antigen that is not expressed by normal cells (Landry et al., 2000; Bolli et al., 2002), and that we found was expressed by only 4 of the 101 invasive cancers analyzed (unpublished data). All four carcinomas are ER and PR negative, p53 immunopositive, and two of them express MRP14. Immunostaining of samples from patient 23 with an anti‐MAGE‐4 antibody showed that most tumour cells stained with the probe, albeit at different levels (Figure 4O), while no expression was observed in lesions I (Figure 4M) or II (Figure 4N). These results together with the proteomic data described above imply that lesion II, a putative precancerous lesion, expresses many but not all the molecular markers that may typify this type of invasive cancer (Berman et al., 2006; Bolli et al., 2002). The results were confirmed by performing several independent stainings.
3.3.1. Patient 14
In addition to the AA biopsy, two other tissue sample biopsies taken away from the tumour (2cm or more) were available from this patient. All three biopsies showed a few clusters of small hyperplastic ductal lesions containing large flat cells with pleomorphic nuclei that stained strongly with the p53 antibody (Figure 6A). These cells did not express 15‐PGDH (Figure 6B). Apocrine metaplasia (Figure 6C) was observed in single ducts that contained both p53 positive and negative cells (Figure 6D, serial sections), suggesting that they may have a common origin. Also, columnar cells flanking the p53 positive cells were detected in some areas implying a direct relationship between these cell types (results not shown).
Figure 6.
p53 positive non‐apocrine lesions found in the SA biopsy of patient 14. (A and B) Serial sections stained with the p53 (A) and the 15‐PGDH (B) antibodies. (C and D) Other areas of the above preparations stained with the 15‐PGDH (C) and the p53 (D) antibodies. (E) Section stained with the Ki67 antibody. (F) Area from one of the p53 stained sections showing necrosis (indicated with an arrow). The antibody dilutions are given in the legend of Figure 3.
Areas with p53 positive non‐apocrine cells showed MRP14 positive cells (results not shown), as well as a significant number of proliferating cells as judged by staining with the Ki67 antibody (Figure 6E). The latter results indicate that these cells are not undergoing oncogene‐induced senescence, a process that is known to restrict tumour progression (Collado et al., 2005; Di Micco et al., 2006; Bartkova et al., 2006; Courtois‐Cox et al., 2006). In a few areas, however, we observed cells that were surrounded by necrotic material (arrow in Figure 6F), suggesting cell death due to hypoxia.
Receptor status analysis by means of IHC indicated that the p53 positive cells were ER and PR negative, with a few showing AR expression. Similar analysis of the concomitant tumour, however, showed that that the cells were ER, PR and AR positive. Moreover, all tumour cells were p53 negative, implying that they are most likely not derived from the p53 positive non‐apocrine lesions (results not shown). Whether the latter correspond to putative precancerous lesions is at present unknown.
In general, the p53 positive, non‐apocrine lesions observed in patients 23 and 14 seem to be rare, as extensive sampling of 61 unselected control cases of non‐malignant breast tissue from mastectomies of patients with high‐risk breast cancer failed to reveal them (results not shown).
3.4. Myoepithelial hyperplasia
It is well‐known that ductal hyperplasia in SA is characterized by ME proliferation admixed with apocrine and non‐apocrine luminal cells (Rosen, 1997; Cyrlak and Carpenter, 1999; Bankfalvi et al., 2004). The precise phenotype of the ME cells has not yet been investigated in detail, although recent studies by Zhang et al. (2003) have identified a subset of ME cells that do not express known ME cell markers such as CKs 5/6, 14 and 17, SMA, calponin, CD10, Wilms' tumour‐1, and maspin, implying that ME cells may be subjected to changes in gene expression both under normal and pathological conditions. Indeed, Gudjonsson et al. (2002) have shown that normal and tumour derived ME cells differ significantly in their capabilities to interact with breast luminal cells for polarity and basement membrane deposition, and results from Polyak and Hu (2005) have shown that ME isolated from DCIS secrete cytokines and tumour promoting molecules that are not expressed by differentiated ME cells. Similarly, proteomic and IHC data from our laboratories have shown that ME hyperplasia associated with apocrine microcysts is accompanied by the expression of CKs 14 and 15 (Figure 5B; Table 3), the latter being a cytokeratin that was shown to be expressed by stem cells located in the hair follicle bulge (Jih et al., 1999; Ohyama et al., 2007).
Since the expression of CK15 has not been reported in ME cells, and bearing in mind that ME and luminal cells may be derived from a common progenitor precursor (Stingl et al., 1998; Pechoux et al., 1999; Stingl et al., 2001; Bocker et al., 2002; Lerwill, 2004 and references therein), we proceeded to analyze apocrine hyperplasia in the SA lesions in more detail. Towards this end we immunostained paraffin‐embedded tissue sections with the CK15 antibody in combination with probes against known ME (CK14, CK5, SMA, and p63) and luminal cell markers (CKs 8 and 19) (Polyak and Hu, 2005; Lerwill, 2004; Adriance et al., 2005; Moriya et al., 2006). The results, which revealed both CK15 positive ME and luminal cells, are presented below.
3.4.1. CK15 positive myoepithelial cells
Immunofluorescence staining of paraffin embedded formalin‐fixed tissue sections from SA patients 11, 14 and 18, which contained significant numbers of lesions with apocrine intraductal papillary hyperplasia, showed that the great majority of the CK15 positive cells co‐expressed CK14 (Figure 7A; white arrow indicates double positive cell). All CK15, CK14 double positive cells were restricted to suprabasal areas (white arrow in Figure 7A), while CK14+, CK15− cells were located basally (Figure 7A; see cell indicated with yellow arrow) in all the lesions so far examined. ME cells in the basal compartment expressed in addition to SMA, a protein that was hardly ever detected in the suprabasal ME cells (results not shown) (Zhang et al., 2003).
Figure 7.
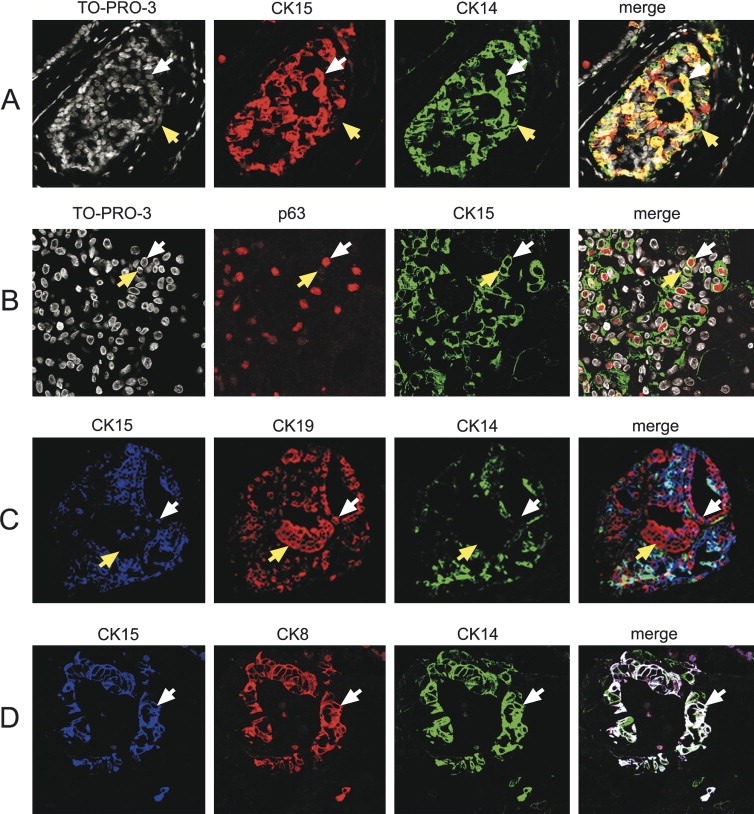
Confocal laser scanning analysis of indirect triple‐label immunofluorescence of paraffin‐embedded sclerosing adenosis tissue sections from patients 18 (A and B) and 10 (C and D) reacted with specific antibodies. (A) Tissue section reacted with CK15 (Alexa Fluor® 594; red channel) and CK14 (Alexa Fluor® 488; green channel) antibodies, and counterstained with the nuclear stain TO‐PRO‐3 (white channel). In the merged image, cells expressing both antigens are yellow and are indicated with a white arrow. Cells expressing only CK14 are green and are indicated with a yellow arrow. (B) Tissue section reacted with p63 (Alexa Fluor® 594; red channel) and CK15 (Alexa Fluor® 488; green channel) antibodies, and counterstained with the nuclear stain TO‐PRO‐3 (white channel). In the merged image, cells expressing both antigens are indicated with white arrows. Cells expressing only CK15 are indicated with a yellow arrow. (C) Tissue section reacted with CK15 (Alexa Fluor® 633, blue channel), CK19 (Alexa Fluor® 594, red channel), and CK14 (Alexa Fluor® 488, green channel) antibodies. In the merged image, cells expressing CKs 15 and 19 and that are CK14 negative are indicated with white arrows. Cells that are CK19+, CK15− and CK14− are indicated with a yellow arrow. (D) Tissue section reacted with CK15 (Alexa Fluor® 633; blue channel), CK8 (Alexa Fluor® 594, red channel), and CK14 (Alexa Fluor® 488, green channel) antibodies. In the merged image, cells expressing all three antigens are white.
Analysis of the same preparations using an antibody against p63, a recently identified member of the p53 gene family that is expressed in the vast majority of mammary ME cells in both in normal and pathologic conditions (Lerwill, 2004; Moriya et al., 2006; Mills et al., 1999; Barbareschi et al., 2001; Tse et al., 2006) showed that many of the CK15 positive ME cells were also immunoreactive for p63 (Figure 7B), although expression of this marker was not an absolute requirement for CK15 positive cells, as we observed strong CK15 immunoreactivity in cells that expressed low or no p63 (Figure 7B, compare CK15, p63 double positive cell indicated by white arrowhead with CK15 positive, p63 negative cell indicated by yellow arrowhead). These cells, which were CK14 negative (results not shown), may correspond to luminal cells as described in the next section. Triple immunostainings using combinations of specific antibodies against CKs 15 and 14, p63, SMA, and CKs 5, 8, and 19, as well as IHC analysis of serial sections (not shown), revealed various phenotypes for CK15 negative and positive ME cells that are listed in Table 4.
Table 4.
Phenotype of CK15 negative and positive myoepithelial and luminal cells
| Cell type | Phenotype as defined by triple immunofluorescence analysis | Additional phenotypic markers |
|---|---|---|
| Myoepithelial cells | ||
| Basal location | CK15−, CK14+, p63+ | CK8−, CK19−, SMA+, CK5+ |
| Suprabasal location | CK15+, CK14+, p63+ | CK8−, CK19−, SMA− |
| CK15+, CK14+, p63− | CK8−, CK19−, SMA− | |
| Luminal cells | CK15+, CK14−, CK19+ | |
| CK15+, CK14+, CK8+ | ||
Data derived from serial section analysis (combinatorial immunofluorescence and IHC). The assignments relied mainly on the analyses of cells located in characteristic structures that were simple to follow rather than isolated cells.
3.4.2. CK15 positive luminal cells
As mentioned previously, some of the CK15 positive cells observed in apocrine hyperplasia could in fact correspond to luminal cells as they were CK14 and p63 negative. Indeed, detailed analyses of triple immunostainings showed that some of the CK15 positive cells in these lesions expressed CK19, but were negative for CK14 (white arrows in Figure 7C), indicating that they correspond to bona fide luminal cells. As expected, we also observed CK19 positive cells that were negative for CKs 15 and 14 (yellow arrows in Figure 7C). Other phenotypes for CK15 positive luminal cells, deduced from the immunofluorescence data and IHC analysis of serial sections, are listed in Table 4. Luminal cells exhibiting these phenotypes were 15‐PGDH negative (results not shown).
In addition to the phenotype mentioned above, we encountered a cellular phenotype typified by the expression of CK15+, CK14+ and CK8+, which was only exhibited by a small number of cells localizing to the luminal epithelia compartment of ducts lined by a single cell layer (Figure 7D; white colored cells on merged image).
4. Discussion
The identification as well as the molecular characterization of precancerous lesions in terms of increased risk of progression and/or recurrence is becoming a critical issue today as non‐surgical detection procedures are detecting breast cancer at an earlier stage (Kerlikowske et al., 1995; Olsen and Gotzsche, 2001). Moreover, there is increased interest in premalignant lesions because of the possibility of chemoprevention, i.e. the use of compounds that may hinder the carcinogenic process (Costa et al., 1998; Chan and Morris, 2006).
Presently, the non‐surgical analysis of breast lesions involves the correlation of clinical and imaging data (mammography and sonography) with pathological findings from fine needle aspiration cytology (FNAC) and/or histological needle core biopsy (NCB). The combined procedure provides in most cases a definitive diagnosis and determines whether to proceed with surgical intervention (diagnostic excision biopsy or final surgery), or to avoid surgery and recommend recall (wait and see). Precise non‐surgical diagnosis based on histopathological features and molecular data, in combination with targeted therapy (Celis et al., 2005a; Liefers and Tollenaar, 2002; Collins and Workman, 2006; Triggle, 2007) is expected to lead to a predictive, individualized approach to cancer care.
The aim of the study presented here was to identify precancerous lesions in SA with AA and apocrine hyperplasia using antibody probes against components of the benign apocrine signature, as these lesions may be precursors of premalignant cancer (O'Malley and Bane, 2001, 2004, 2002, 2002, 2000, 1987, 1995, 2006). The results revealed non‐obligate putative apocrine precancerous lesions as defined by the expression of p53 and/or MPR14 (S100A9). The studies also revealed p53 positive non‐apocrine precancerous lesions as well as novel phenotypes for ME and luminal cells characterized by the expression of CK15.
4.1. Apocrine precancerous lesions
Of 14 patients with AA, six presented with apocrine hyperplasia and 13 with type I apocrine microcyts (Table 2). Precancerous lesions were detected in eight of the AA lesions, in four of the apocrine hyperplasia changes, and in seven of the apocrine microcysts. Two of the patients had concomitant invasive carcinomas (patients 14 and 24), while two exhibited DCIS (patients 6 and 22) (Table 1). None of the cancers, however, corresponded to invasive pure apocrine carcinomas, supporting the notion that apocrine metaplastic epithelium has little intrinsic malignant potential (Celis et al., 2006, 2006, 1987).
Considering that we only analyzed a limited number of SA lesions with apocrine metaplasia, and given the fact that apocrine carcinomas account only for about 0.5% of all invasive breast cancers according to the Danish Breast Cancer Cooperative Group (DBCG) Registry, we stained archival histological sections of invasive apocrine carcinomas collected at the Copenhagen University Hospital with the 15‐PGDH antibody in an effort to reveal lesions in which invasive apocrine cancer co‐existed with known premalignant lesions such as apocrine CIS. We surmised that some of these samples may contain a spectrum of early lesions that may be crucial for shedding some light as to their relationship with invasive disease as well as with the precursor lesions we had identified in this study. Of 10 pure invasive apocrine carcinomas stained with the 15‐PDGH antibody, we identified one lesion (Figure 8; whole view of the lesion) that contained apocrine carcinoma in situ of the cribriform type (Figure 8A) and apocrine invasive disease (Figure 8D), in close proximity to AA (Figure 8B) and apocrine hyperplasia (Figure 8C). As shown in Figure 9, cells in the invasive area of the lesion were MRP14 (Figure 9D) and psoriasin positive (Figure 9H), just like many of the cells in the apocrine hyperplasia (Figure 9B and F) and cribriform CIS (Figure 9C and G). Many of the cells in the AA lesions were MRP14 positive (Figure 9A), but only a few cells were positive for psoriasin (arrow in Figure 9B) resembling very much the patterns we observed in patients with AA areas harbouring precancerous lesions (compare with Figure 3A–C). Only few p53 positive cells were observed in all four lesions (Figure 9I–L), in line with the fact that we have detected p53 negative AA and apocrine hyperplastic lesions that are positive both for MRP14 and psoriasis, as well as with the observation that only a fraction of the pure invasive carcinomas is p53 positive (Celis et al., 2006, 2006). Staining with the antibody against CK14, an ME marker, showed that all the apocrine lesions, with the exception of the invasive tumour, were surrounded by a continuous layer of ME cells (results not shown). Even though the results do not conclusively prove that the invasive apocrine tumour cells are derived from AA or apocrine hyperplasia lesions with molecular atypia, they strongly support the contention that these precursors correspond to non‐obligate precancerous lesions (Wellings and Alpers, 2001, 2002, 2002, 2000, 1987, 2006), that may eventually progress to invasive disease provided they accumulate additional genetic and epigenetic changes (Herceg and Hainaut, in this issue). As a whole, our studies have emphasized the need for generating appropriated model systems that will allow a detailed analysis of the molecular changes underlying early stages of apocrine cancer progression.
Figure 8.
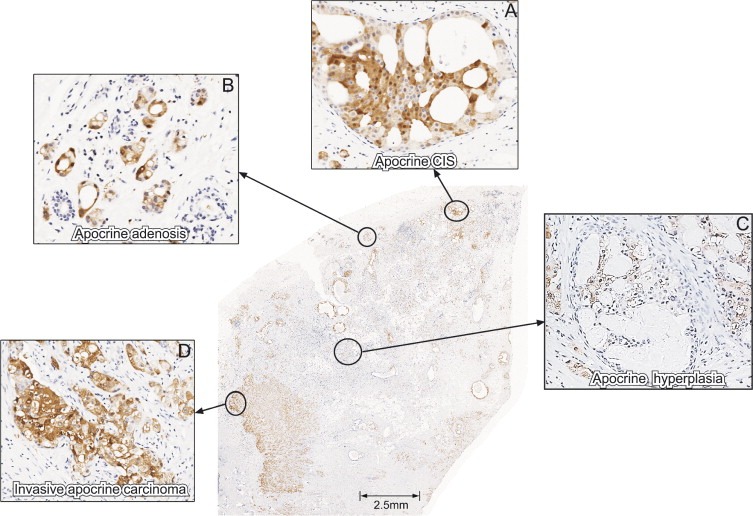
Section from an invasive apocrine carcinoma reacted with the antibody against 15‐PGDH. (A) Apocrine CIS. (B) Apocrine adenosis. (C) Apocrine hyperplasia. (D) Invasive area. The antibody was used at a dilution of 1:4000.
Figure 9.
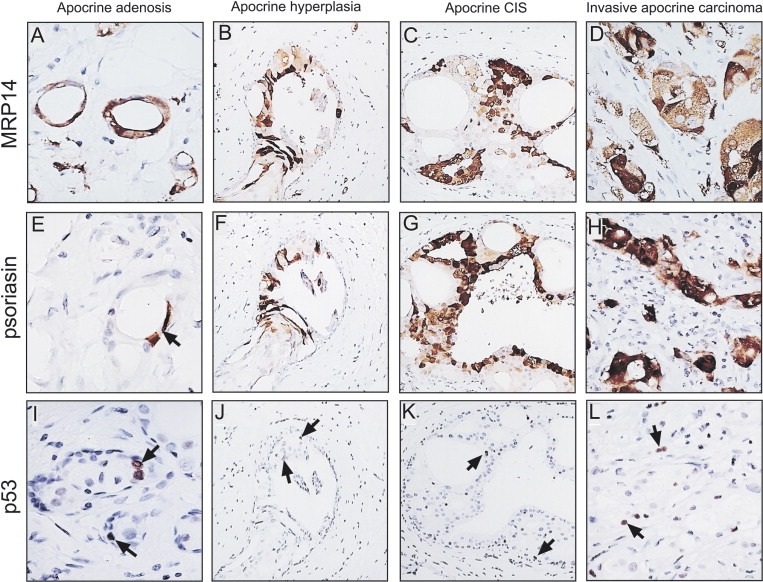
IHC staining of an invasive apocrine carcinoma using antibodies against components of the benign apocrine signature. (A, E, and I) Area with AA stained with antibodies against (A) MRP14, (E) psoriasin and (I) p53. (B, F, and J) Area with apocrine hyperplasia stained with antibodies against (B) MRP14, (F) psoriasin, and (J) p53. Area with apocrine CIS (cribriform) stained with antibodies against (C) MRP14, (G) psoriasin, and (K) p53. (D, H, and L) Area with invasive disease stained with antibodies against (D) MRP14, (H) psoriasin and (L) p53. The antibodies were used at the dilutions given in the legend of Figure 3.
Taking into account that out of the 24 SA patients with apocrine metaplasia, seven presented with concomitant carcinomas (ductal and lobular) and two with DCIS, one must contemplate the possibility that apocrine lesions, in particular apocrine microcysts which were present in 23 of the patients, may offer an appropriate environment for other cell types to proliferate. Indeed, apocrine cells in type I microcysts have been shown to express a wide range of growth factors and cytokines that may have a profound effect on the behaviour of neighbouring cells (Ness et al., 2004, 1994, 1994, 1993, 1992, 1990). Should this be the case, our recent identification of proteins that characterize the early stages of apocrine differentiation like 15‐PGDH, HMG‐CoA reductase, and cyclooxygenase 2 (COX‐2) provides a window of opportunity for intervention, not only in a therapeutic manner, but also in a chemopreventive setting (Celis et al., 2006, 2006). In this respect it is important to mention that recent studies of Quidville et al. (2006) have shown that 15‐PGDH is involved in the anti‐proliferative effect of non‐steroidal anti‐inflammatory drugs COX‐1 inhibitors.
Interestingly, over expression of 15‐PGDH in MDA‐MB‐231 breast cancer cells caused growth suppression in a colony formation assay and a significant decrease in the tumorigenic potential of these cells in nude mice. Conversely, siRNA‐mediated down‐regulation of 15‐PGDH gene expression significantly decreased the proliferative potential of MCF‐7 breast cancer cells leading the authors to suggest that 15‐PGDH may be a novel tumour suppressor gene in breast cancer (Wolf et al., 2006), a contention that was supported by the fact that 16 out of 25 (64%) primary breast tumours examined showed lower 15‐PGDH mRNA expression relative to five normal breast samples. We have previously shown that non‐apocrine mammary cells do not express 15‐PGDH protein – or if they do so it is at levels that are not detectable by IHC or 2D gel analysis – while 15‐PGDH protein expression in apocrine breast cells occurs at levels comparable to those of strongly expressed proteins such as CK19 or other cytokeratins (Celis et al., 2006a). It follows from our data that apocrine breast cells in premalignant lesions as well as invasive apocrine carcinomas can proliferate in the presence of very large amounts of 15‐PGDH (Figure 8) (Celis et al., 2006a).
Clearly, there is still much work to be done if one is to characterize all of the potential apocrine precancerous lesions and to assess their impact on prognosis. The lesions we have identified so far are quite heterogeneous even in the expression of a few markers, and it is likely that we have uncovered only a few phenotypes among the repertoire of precursor lesions that may be present. To further dissect various stages involved in the process of apocrine tumour progression, however, it will be necessary to identify additional apocrine carcinoma biomarkers that could be tested by IHC in a much larger retrospective sample size with a long‐term follow‐up and associated clinical data. These studies are currently underway in our laboratories.
4.2. Non‐apocrine precancerous lesions
IHC analysis of the SA samples from patient 23 revealed non‐apocrine areas with atypical hyperplasia that contained large cells with pleomorphic nuclei that stained strongly with the p53 antibody. These putative precancerous lesions, which were located away from the invasive tumour, showed a striking resemblance to the tumour in terms of global protein expression profiles, but differed dramatically in the expression of the tumour marker MAGE‐4, a cancer testis antigen expressed by a variety of tumour cells (Landry et al., 2000; Bolli et al., 2002), implying that the expression of this protein by the tumour cells is a late event in the development of this type of cancer. Landry et al. (2000) have shown that about 4% of breast cancers express MAGE‐4, a fact that is in line with our unpublished observations. None of the four MAGE‐4 invasive carcinomas in our collection of high‐risk breast carcinomas, however, exhibited the same phenotype as tumour 23 as this tumour is AR positive while all the others do not express this receptor.
4.3. Myoepithelial hyperplasia
It is known that ductal hyperplasia in SA is characterized by ME proliferation admixed with apocrine and non‐apocrine luminal cells. Our analysis of SA lesions with apocrine hyperplasia, mostly of the intraductal papillary type, revealed novel phenotypes for ME and non‐apocrine luminal cells that were characterized by the expression of CK15, a cytokeratin that has been shown to be expressed by stem cells located in the hair follicle bulge (Jih et al., 1999; Ohyama et al., 2007).
It is likely that the CK15 positive ME cells we have described represent cells at various stages of proliferation and differentiation, reflecting changes in the local environment as a consequence of the multiplicity of cell types present in SA lesions with apocrine hyperplasia (Polyak and Hu, 2003, 2005, 2005). We found that CK15/CK14 positive ME cells could be either p63 positive or negative, but none expressed luminal markers supporting the contention that they correspond to ME cells. These CK15 positive ME cells were mainly located suprabasally, while differentiated CK14 positive, CK15 negative cells exhibited a basal location. The latter expressed in addition CK5, p63 and SMA, but were negative for CKs 8 and 19 in agreement with published observations (Table 4) (Polyak and Hu, 2005; Fridriksdottir et al., 2005; Adriance et al., 2005; Moriya et al., 2006). No CK15/SMA positive cells were observed in suprabasal locations (Zhang et al., 2003). A full analysis of the diversity of ME phenotypes that may be present in the SA samples was not possible, however, due to technical limitations associated with the determination of the phenotype of single cells using more than three antigens at the same time. Even though these studies were done by combinatorial triple immunofluorescence analysis on serial sections, and complemented by IHC data obtained from the analyses of serial sections, the assignments were not always straightforward. In spite of these limitations, however, we managed to assign additional markers to the phenotypes defined primarily by the analysis of triple immunofluorescence staining (Table 4).
Interestingly, ongoing gel‐based proteomic analyses of a number of established breast cell lines (MCF‐7, MDA‐MB‐231, HS578, SK‐BR‐3, ZR75‐1, BT20, MCF‐10A, T47D, HCC1569 and HCC1395) have identified one single cell line, MCF‐10A, which is derived from s.c. mastectomy tissue from a 36‐year‐old, parous, premenopausal woman with fibrocystic disease, that expresses CKs 15, 14, 17 and 7 as well as very high levels of 14‐3‐3 sigma (stratifin; Figure 5C) (Leffers et al., 1993; Aitken, 1996), a protein that is highly expressed by ME cells in the normal breast (Moreira et al., 2005; Simpson et al., 2004). The expression of CK14, the high levels of 14‐3‐3 sigma, as well as the lack of expression of CKs 8 and 19 (Figure 5C) (Nagaraja et al., 2006) support the notion that this cell line may correspond to an ME or intermediate cell type (Rabinovitz and Mercurio, 1997; Gordon et al., 2003). Indeed, Dawson et al. (1996) have shown that c‐Ha‐ras transformed MCF‐10A cells (MCF‐10AT) may contain multipotent breast stem cells that are able to generate both ME and luminal cells in vivo. Also, it has been shown that loops of attachment to the extracellular matrix, growth factor deprivation, or confluence dramatically up‐regulate the expression of psoriasin by MCF‐10A cells (Enerback et al., 2002), a protein that we have not observed in differentiated ME cells (unpublished observations). Thus, it would be important to analyze the proteome of this cell line under various physiological conditions, as it may represent a useful model system to study differentiation along the ME pathway.
In brief, our studies have revealed fundamental changes in the phenotype of ME cells, characterized by the expression of CK15, that have not been previously reported. Expression of CK15 has also been observed in hyperproliferative lesions present both in a radial scar as well as in a fibroadenoma sample (unpublished results), implying that the observations are not restricted to apocrine hyperplasia. Given the increasing evidence indicating that changes in ME function may have an important role in normal breast morphogenesis and breast cancer (Gudjonsson et al., 2005), and taking into account that we have found non‐obligate precancerous lesions in SA with apocrine metaplasia, it would be important to determine the fate of the CK15 positive ME cells we have identified, as hyperproliferative lesions of the breast are suggestive of an increased risk for later development of breast cancer.
Our IHC analyses of lesions with apocrine hyperplasia also revealed luminal cells that were CK15 and CK19 positive, but CK14 negative. Only a fraction of the CK15 positive luminal cells expressed CK19, and we observed a significant number of cells in which the expression of one of these cytokeratins excluded the expression of the other. The expression of CK15 is not limited to the benign proliferative lesions we have studied as positive staining has also been observed in isolated ducts and acini in normal breast tissue obtained from mammary reductions as well as in “non‐malignant” breast tissue samples dissected from mastectomies from high‐risk breast cancer patients.
In addition to the CK15 positive phenotype mentioned above we identified an interesting cellular phenotype that is typified by the co‐expression of CK15+, CK14+ and CK8+, i.e. by a combination of ME and luminal markers. Few cells exhibited this phenotype and these localized to the luminal epithelia compartment of ducts lined by a single cell layer (Figure 7D). Luminal cells with this phenotype have also been observed in intracystic papillary lesions in a fibroadenoma with sclerosing adenosis (unpublished observations). We are currently in the process of undertaking a systematic and detailed analysis of various benign and malignant conditions, including DCIS, a true premalignant lesion (Allred et al., 2001), in order to assess the precise origin and biological potential of these cells and to correlate these data with the phenotype of breast cancers, in particular those that have been associated with a basal phenotype (Perou et al., 2000; Sorlie et al., 2001; Nielsen et al., 2004). These studies also intend to unravel the entire range of precursor phenotypes present in normal breast and benign proliferative conditions, in an effort to gain a better understanding of the origin and molecular mechanisms underlying malignant breast diseases.
While writing this manuscript we became aware of the work by Villadsen et al. (2007) that has reported the identification of a stem cell zone in the resting human mammary gland. They also demonstrate the existence of four distinct human mammary epithelial cell types some of which exhibited stem cell markers. Interestingly, the most restricted and presumably most specific stem cell markers found in this work were the presence of CK15 and the stage‐specific embryonal antigen‐4 (SSEA‐4). Although this work was done on normal mammary glands and thus cannot be directly correlated to our own observations that were made on hyperproliferative lesions, they are taken to support the results presented here concerning the expression of CK15 by some luminal cells.
To conclude, we would like to emphasize that our studies have been hindered by limitations imposed by our decision to analyze clinically relevant samples rather than cultured cell lines, as the latter may not faithfully reflect the in vivo situation (Kenny et al., in this issue; Celis et al., 1999b and references therein). These included: (i) the heterogeneity of the lesions and the lack of objective parameters to unambiguously classify them, (ii) their rarity, (iii) the limited amounts of tissue available leading to sampling restrictions, and (iv) scarceness of available retrospective samples with long‐term clinical follow‐up. In spite of these limitations, however, our initial studies have opened new possibilities for the systematic search for precancerous lesions as they have shown that it is feasible to apply proteomic technologies in combination with IHC to the analysis of complex biological samples under conditions that are as close as possible to the in vivo situation.
Today, as a result of improved non‐operative diagnostic techniques there is increased detection of early invasive disease as well as of confined premalignant lesions such as CIS and atypical ductal hyperplasia (ADH). Since invasive ductal carcinoma is the most common breast cancer type observed, we have started to apply a similar strategy as the one presented here in an effort to reveal very early precancerous lesions as well as specific biomarkers that may lay the foundation for early diagnosis (Celis et al., 2004, 2006). The outcome of these studies will be the identification of specific markers that would permit more objective cytological criteria for the diagnosis of intraductal hyperplasia and DCIS.
Acknowledgements
We would like to thank Kitt Christensen, Gitte Lindberg Stott, Dorrit Lützhøft, Hanne Nors, Michael Radich Johansen, Britt Olesen, Signe Trentemøller and Dorte Holm for expert technical assistance. We are also very grateful to G. Spagnoli for providing the 57B antibody. T. Shen is a recipient of a visiting fellowship from the Chinese Government. This work was supported by the Danish Cancer Society through the budget of the Institute of Cancer Biology and by grants from the Danish Medical Research Council, the Natural and Medical Sciences Committee of the Danish Cancer Society, Novo Nordisk, the John and Birthe Meyer Foundation, the Solar Fonden, the Stensbygaard Fonden, the Kai Lange og Gundhild Kai Lange Fond, and a “Race Against Breast Cancer”. The support of the Marketing Department at the Danish Cancer Society is greatly appreciated.
Celis Julio E., Moreira José M.A., Gromova Irina, Cabezôn Teresa, Gromov Pavel, Shen Tao, Timmermans Vera, Rank Fritz, (2007), Characterization of breast precancerous lesions and myoepithelial hyperplasia in sclerosing adenosis with apocrine metaplasia, Molecular Oncology, 1, doi:10.1016/j.molonc.2007.02.005.
This article is dedicated to the memory of Dorrit Lützhøft, a wonderful and inspiring colleague that recently succumbed to breast cancer.
Footnotes
The term fibrocystic change or “disease” should not be applied to the even more common and closer to normal change presenting occasional apocrine microcysts together with mild adenosis and fibrosis.
Apocrine atypia is considered only with pronounced nuclear enlargement and some pleomorphism.
SA differential diagnosis includes tubular carcinoma, microglandular adenosis, and radial scar Pathology Reporting of Breast Cancer, 2005.
There is considerable controversy regarding the criteria used to define cytological atypia in these lesions (Rosen, 1997 and references therein). Many pathologists prefer a pragmatic approach to the term atypical ductal hyperplasia (ADH) and usually apply the diagnosis for small lesions not exceeding 2–3mm in size.
The latter markers, however, are also expressed by other carcinoma types.
References
- Adriance, M.C. , Inman, J.L. , Petersen, O.W. , Bissell, M.J. , 2005. Myoepithelial cells: good fences make good neighbors. Breast Cancer Res.. 7, 190–197. [DOI] [PMC free article] [PubMed] [Google Scholar]
- Agnantis, N.J. , Mahera, H. , Maounis, N. , Spandidos, D.A. , 1992. Immunohistochemical study of ras and myc oncoproteins in apocrine breast lesions with and without papillomatosis. Eur. J. Gynaecol. Oncol.. 13, 309–315. [PubMed] [Google Scholar]
- Aitken, A. , 1996. 14-3-3 and its possible role in co-ordinating multiple signalling pathways. Trends Cell Biol.. 6, 341–347. [DOI] [PubMed] [Google Scholar]
- Allred, D.C. , Mohsin, S.K. , 2000. Biological features of human premalignant breast disease. In Harris R., Diseases of the Breast. Lippincott Williams & Wilkins; Philadelphia: [Google Scholar]
- Allred, D.C. , Mohsin, S.K. , Fuqua, S.A. , 2001. Histological and biological evolution of human premalignant breast disease. Endocri. Relat. Cancer. 8, 47–61. [DOI] [PubMed] [Google Scholar]
- Angeli, A. , Bradlow, H.L. , Bodian, C.A. , Chasalow, F.I. , Dogliotti, L. , Haagensen, D.E. , 1990. Criteria for classifying breast cyst fluids. Ann. N.Y. Acad. Sci.. 586, 49–52. [DOI] [PubMed] [Google Scholar]
- Arai, K. , Teratani, T. , Kuruto-Niwa, R. , Yamada, T. , Nozawa, R. , 2004. S100A9 expression in invasive ductal carcinoma of the breast: S100A9 expression in adenocarcinoma is closely associated with poor tumour differentiation. Eur. J. Cancer. 40, 1179–1187. [DOI] [PubMed] [Google Scholar]
- Bankfalvi, A. , Ludwig, A. , De-Hesselle, B. , Buerger, H. , Buchwalow, I.B. , Boecker, W. , 2004. Different proliferative activity of the glandular and myoepithelial lineages in benign proliferative and early malignant breast diseases. Mod. Pathol.. 17, 1051–1061. [DOI] [PubMed] [Google Scholar]
- Barbareschi, M. , Pecciarini, L. , Cangi, M.G. , Macri, E. , Rizzo, A. , Viale, G. , Doglioni, C. , 2001. p63, a p53 homologue, is a selective nuclear marker of myoepithelial cells of the human breast. Am. J. Surg. Pathol.. 25, 1054–1060. [DOI] [PubMed] [Google Scholar]
- Bartkova, J. , Rezaei, N. , Liontos, M. , Karakaidos, P. , Kletsas, D. , Issaeva, N. , Vassiliou, E. , Kolettas, L.V. , Niforou, K. , Zoumpourlis, V.C. , Takaoka, M. , Nakagawa, H. , Tort, F. , Fugger, K. , Johansson, F. , Sehested, M. , Andersen, C.L. , Dyrskjot, L. , Orntoft, T. , Lukas, J. , Kittas, C. , Helleday, T. , Halazonetis, T.D. , Bartek, J. , Gorgoulis, V.G. , 2006. Oncogene-induced senescence is part of the tumorigenesis barrier imposed by DNA damage checkpoints. Nature. 444, 633–637. [DOI] [PubMed] [Google Scholar]
- Berman, J.J. , Albores-Saavedra, J. , Bostwick, D. , Delellis, R. , Eble, J. , Hamilton, S.R. , Hruban, R.H. , Mutter, G.L. , Page, D. , Rohan, T. , Travis, W. , Henson, D.E. , 2006. Precancer: a conceptual working definition – results of a Consensus Conference. Cancer Detect. Prev.. 30, 387–394. [DOI] [PubMed] [Google Scholar]
- Bocker, W. , Moll, R. , Poremba, C. , Holland, R. , Van Diest, P.J. , Dervan, P. , Burger, H. , Wai, D. , Ina Diallo, R. , Brandt, B. , Herbst, H. , Schmidt, A. , Lerch, M.M. , Buchwallow, I.B. , 2002. Common adult stem cells in the human breast give rise to glandular and myoepithelial cell lineages: a new cell biological concept. Lab. Invest.. 82, 737–746. [DOI] [PubMed] [Google Scholar]
- Bolli, M. , Kocher, T. , Adamina, M. , Guller, U. , Dalquen, P. , Haas, P. , Mirlacher, M. , Gambazzi, F. , Harder, F. , Heberer, M. , Sauter, G. , Spagnoli, G.C. , 2002. Tissue microarray evaluation of melanoma antigen E (MAGE) tumor-associated antigen expression: potential indications for specific immunotherapy and prognostic relevance in squamous cell lung carcinoma. Ann. Surg.. 236, 785–793. [DOI] [PMC free article] [PubMed] [Google Scholar]
- Bruzzi, P. , Dogliotti, L. , Naldoni, C. , Bucchi, L. , Costantini, M. , Cicognani, A. , Torta, M. , Buzzi, G.F. , Angeli, A. , 1997. Cohort study of association of risk of breast cancer with cyst type in women with gross cystic disease of the breast. BMJ. 314, 925–928. [DOI] [PMC free article] [PubMed] [Google Scholar]
- Carlsson, H. , Petersson, S. , Enerback, C. , 2005. Cluster analysis of S100 gene expression and genes correlating to psoriasin (S100A7) expression at different stages of breast cancer development. Int. J. Oncol.. 27, 1473–1481. [PubMed] [Google Scholar]
- Carter, D.J. , Rosen, P.P. , 1991. Atypical apocrine metaplasia in sclerosing lesions of the breast: a study of 51 patients. Mod. Pathol.. 4, 1–5. [PubMed] [Google Scholar]
- Celis, J.E. , Ostergaard, M. , Basse, B. , Celis, A. , Lauridsen, J.B. , Ratz, G.P. , Andersen, I. , Hein, B. , Wolf, H. , Orntoft, T.F. , Rasmussen, H.H. , 1996. Loss of adipocyte-type fatty acid binding protein and other protein biomarkers is associated with progression of human bladder transitional cell carcinomas. Cancer Res.. 56, 4782–4790. [PubMed] [Google Scholar]
- Celis, J.E. , Celis, P. , Ostergaard, M. , Basse, B. , Lauridsen, J.B. , Ratz, G. , Rasmussen, H.H. , Orntoft, T.F. , Hein, B. , Wolf, H. , Celis, A. , 1999. Proteomics and immunohistochemistry define some of the steps involved in the squamous differentiation of the bladder transitional epithelium: a novel strategy for identifying metaplastic lesions. Cancer Res.. 59, 3003–3009. [PubMed] [Google Scholar]
- Celis, A. , Rasmussen, H.H. , Celis, P. , Basse, B. , Lauridsen, J.B. , Ratz, G. , Hein, B. , Ostergaard, M. , Wolf, H. , Orntoft, T. , Celis, J.E. , 1999. Short-term culturing of low-grade superficial bladder transitional cell carcinomas leads to changes in the expression levels of several proteins involved in key cellular activities. Electrophoresis. 20, 355–361. [DOI] [PubMed] [Google Scholar]
- Celis, J.E. , Gromov, P. , Gromova, I. , Moreira, J.M. , Cabezon, T. , Ambartsumian, N. , Grigorian, M. , Lukanidin, E. , Thor Straten, P. , Guldberg, P. , Bartkova, J. , Bartek, J. , Lukas, J. , Lukas, C. , Lykkesfeldt, A. , Jaattela, M. , Roepstorff, P. , Bolund, L. , Orntoft, T. , Brunner, N. , Overgaard, J. , Sandelin, K. , Blichert-Toft, M. , Mouridsen, H. , Rank, F.E. , 2003. Integrating proteomic and functional genomic technologies in discovery-driven translational breast cancer research. Mol. Cell. Proteomics. 2, 369–377. [DOI] [PubMed] [Google Scholar]
- Celis, J.E. , Gromov, P. , Cabezon, T. , Moreira, J.M. , Ambartsumian, N. , Sandelin, K. , Rank, F. , Gromova, I. , 2004. Proteomic characterization of the interstitial fluid perfusing the breast tumor microenvironment: a novel resource for biomarker and therapeutic target discovery. Mol. Cell. Proteomics. 3, 327–344. [DOI] [PubMed] [Google Scholar]
- Celis, J.E. , Moreira, J.M. , Gromova, I. , Cabezon, T. , Ralfkiaer, U. , Guldberg, P. , Straten, P.T. , Mouridsen, H. , Friis, E. , Holm, D. , Rank, F. , Gromov, P. , 2005. Towards discovery-driven translational research in breast cancer. FEBS J.. 272, 2–15. [DOI] [PubMed] [Google Scholar]
- Celis, J.E. , Moreira, J.M. , Cabezon, T. , Gromov, P. , Friis, E. , Rank, F. , Gromova, I. , 2005. Identification of extracellular and intracellular signaling components of the mammary adipose tissue and its interstitial fluid in high risk breast cancer patients: toward dissecting the molecular circuitry of epithelial-adipocyte stromal cell interactions. Mol. Cell. Proteomics. 4, 492–522. [DOI] [PubMed] [Google Scholar]
- Celis, J.E. , Gromov, P. , Moreira, J.M. , Cabezon, T. , Friis, E. , Vejborg, I.M. , Proess, G. , Rank, F. , Gromova, I. , 2006. Apocrine cysts of the breast: biomarkers, origin, enlargement, and relation with cancer phenotype. Mol. Cell Proteomics. 5, 462–483. [DOI] [PubMed] [Google Scholar]
- Celis, J.E. , Gromova, I. , Gromov, P. , Moreira, J.M. , Cabezon, T. , Friis, E. , Rank, F. , 2006. Molecular pathology of breast apocrine carcinomas: a protein expression signature specific for benign apocrine metaplasia. FEBS Lett.. 580, 2935–2944. [DOI] [PubMed] [Google Scholar]
- Celis, J.E. , Trentemølle, S. , Gromov, P. , 2006. Gel-based proteomics: high-resolution two-dimensional gel electrophoresis of proteins. isoelectric focusing (IEF) and nonequilibrium pH gradient electrophoresis (NEPHGE). In Celis J.E., Carter N., Hunter T., Simons K., Small J.V., Shotton D.(Eds.), A Cell Biology. Laboratory Handbook. third ed. Academic Press; San Diego: 165–174. 4 V [Google Scholar]
- Celis, J.E. , Moreira, J.M.A. , Gromov, P. , 2006. Determination of antibody specificity by Western blotting. In Celis J.E., Carter N., Hunter T., Simons K., Small J.V., Shotton D.(Eds.), A Cell Biology. Laboratory Handbook. third ed. Academic Press; San Diego: 527–532. 4 V [Google Scholar]
- Chan, K. , Morris, G.J. , 2006. Chemoprevention of breast cancer for women at high risk. Semin. Oncol.. 33, 642–646. [DOI] [PubMed] [Google Scholar]
- Clahsen, P.C. , van de Velde, C.J. , Duval, C. , Pallud, C. , Mandard, A.M. , Delobelle-Deroide, A. , van den Broek, L. , Sahmoud, T.M. , van de Vijver, M.J. , 1998. p53 protein accumulation and response to adjuvant chemotherapy in premenopausal women with node-negative early breast cancer. J. Clin. Oncol.. 16, 470–479. [DOI] [PubMed] [Google Scholar]
- Collado, M. , Gil, J. , Efeyan, A. , Guerra, C. , Schuhmache, A.J. , Barradas, M. , Benguria, A. , Zaballos, A. , Flores, J.M. , Barbacid, M. , Beach, D. , Serrano, M. , 2005. Tumour biology: senescence in premalignant tumours. Nature. 436, 642 [DOI] [PubMed] [Google Scholar]
- Collins, I. , Workman, P. , 2006. New approaches to molecular cancer therapeutics. Nat. Chem. Biol.. 2, 689–700. [DOI] [PubMed] [Google Scholar]
- Costa, A. , Bonanni, B. , Manetti, L. , Guerrieri Gonzaga, A. , Torrisi, R. , Decensi, A. , 1998. Prevention of breast cancer: focus on chemoprevention. Recent Results. Cancer Res.. 152, 11–21. [DOI] [PubMed] [Google Scholar]
- Courtois-Cox, S. , Genther Williams, S.M. , Reczek, E.E. , Johnson, B.W. , McGillicuddy, L.T. , Johannessen, C.M. , Hollstein, P.E. , MacCollin, M. , Cichowski, K. , 2006. A negative feedback signaling network underlies oncogene-induced senescence. Cancer Cell. 10, 459–472. [DOI] [PMC free article] [PubMed] [Google Scholar]
- Cyrlak, D. , Carpenter, P.M. , 1999. Breast imaging case of the day. Fat necrosis of the breast. Radiographics. 19, S80–S83. [DOI] [PubMed] [Google Scholar]
- Dabbs, D.J. , Carter, G. , Fudge, M. , Peng, Y. , Swalsky, P. , Finkelstein, S. , 2006. Molecular alterations in columnar cell lesions of the breast. Mod. Pathol.. 19, 344–349. [DOI] [PubMed] [Google Scholar]
- Dawson, P.J. , Wolman, S.R. , Tait, L. , Heppner, G.H. , Miller, F.R. , 1996. MCF10AT: a model for the evolution of cancer from proliferative breast disease. Am. J. Pathol.. 148, 313–319. [PMC free article] [PubMed] [Google Scholar]
- Di Micco, R. , Fumagalli, M. , Cicalese, A. , Piccinin, S. , Gasparini, P. , Luise, C. , Schurra, C. , Garre, M. , Nuciforo, P.G. , Bensimon, A. , Maestro, R. , Pelicci, P.G. , d'Adda di Fagagna, F. , 2006. Oncogene-induced senescence is a DNA damage response triggered by DNA hyper-replication. Nature. 444, 638–642. [DOI] [PubMed] [Google Scholar]
- Durham, J.R. , Fechner, R.E. , 2000. The histologic spectrum of apocrine lesions of the breast. Am. J. Clin. Pathol.. 113, (5 Suppl. 1) S3–S18. [DOI] [PubMed] [Google Scholar]
- Elston, C.W. , Ellis, I.O. , 1991. Pathological prognostic factors in breast cancer. I. The value of histological grade in breast cancer: experience from a large study with long-term follow-up. Histopathology. 19, 403–410. [DOI] [PubMed] [Google Scholar]
- Endoh, Y. , Tamura, G. , Kato, N. , Motoyama, T. , 2001. Apocrine adenosis of the breast: clonal evidence of neoplasia. Histopathology. 38, 221–224. [DOI] [PubMed] [Google Scholar]
- Enerback, C. , Porter, D.A. , Seth, P. , Sgroi, D. , Gaudet, J. , Weremowicz, S. , Morton, C.C. , Schnitt, S. , Pitts, R.L. , Stampl, J. , Barnhart, K. , Polyak, K. , 2002. Psoriasin expression in mammary epithelial cells in vitro and in vivo. Cancer Res.. 62, 43–47. [PubMed] [Google Scholar]
- Fridriksdottir, A.J. , Villadsen, R. , Gudjonsson, T. , Petersen, O.W. , 2005. Maintenance of cell type diversification in the human breast. J. Mammary Gland Biol. Neoplasia. 10, 61–74. [DOI] [PubMed] [Google Scholar]
- Gatalica, Z. , 1997. Immunohistochemical analysis of apocrine breast lesions. Consistent over-expression of androgen receptor accompanied by the loss of estrogen and progesterone receptors in apocrine metaplasia and apocrine carcinoma in situ. Pathol. Res. Pract.. 193, 753–758. [DOI] [PubMed] [Google Scholar]
- Gebhardt, C. , Nemeth, J. , Angel, P. , Hess, J. , 2006. S100A8 and S100A9 in inflammation and cancer. Biochem. Pharmacol.. 72, 1622–1631. [DOI] [PubMed] [Google Scholar]
- Gordon, L.A. , Mulligan, K.T. , Maxwell-Jones, H. , Adams, M. , Walker, R.A. , Jones, J.L. , 2003. Breast cell invasive potential relates to the myoepithelial phenotype. Int. J. Cancer. 106, 8–16. [DOI] [PubMed] [Google Scholar]
- Gromova, I. , Celis, J.E. , 2006. Protein detection in gels by silver staining: a procedure compatible with mass-spectrometry In Celis J.E., Carter N., Hunter T., Shotton D., Simons K., Small J.V.(Eds.), Cell Biology. A Laboratory Handbook. vol. 4, Academic Press; San Diego: 219–223. [Google Scholar]
- Gudjonsson, T. , Ronnov-Jessen, L. , Villadsen, R. , Rank, F. , Bissell, M.J. , Petersen, O.W. , 2002. Normal and tumor-derived myoepithelial cells differ in their ability to interact with luminal breast epithelial cells for polarity and basement membrane deposition. J. Cell. Sci.. 115, 39–50. [DOI] [PMC free article] [PubMed] [Google Scholar]
- Gudjonsson, T. , Ronnov-Jessen, L. , Villadsen, R. , Bissell, M.J. , Petersen, O.W. , 2003. To create the correct microenvironment: three-dimensional heterotypic collagen assays for human breast epithelial morphogenesis and neoplasia. Methods. 30, 247–255. [DOI] [PMC free article] [PubMed] [Google Scholar]
- Gudjonsson, T. , Adriance, M.C. , Sternlicht, M.D. , Petersen, O.W. , Bissell, M.J. , 2005. Myoepithelial cells: their origin and function in breast morphogenesis and neoplasia. J. Mammary Gland Biol. Neoplasia. 10, 261–272. [DOI] [PMC free article] [PubMed] [Google Scholar]
- Guinebretière, J.M. , Menet, E. , Tardivon, A. , Cherel, P. , Vanel, D. , 2005. Normal and pathological breast, the histological basis. Eur. J. Radiol.. 54, 6–14. [DOI] [PubMed] [Google Scholar]
- Haagensen, C.D. , 1986. Diseases of the Breast. third ed. W.B. Saunders; Philadelphia: 250–266. [Google Scholar]
- Haagensen, D.E. , 1991. Is cystic disease related to breast cancer?. Am. J. Surg. Pathol.. 15, 687–694. [DOI] [PubMed] [Google Scholar]
- Herceg, Z., Hainaut, P. Genetic and epigenetic alterations as biomarkers for cancer detection, diagnosis and prognosis. Mol. Oncol., doi:10.1016/j.molonc.2007.01.004. [DOI] [PMC free article] [PubMed]
- Jih, D.M. , Lyle, S. , Elenitsas, R. , Elder, D.E. , Cotsarelis, G. , 1999. Cytokeratin 15 expression in trichoepitheliomas and a subset of basal cell carcinomas suggests they originate from hair follicle stem cells. J. Cutan. Pathol.. 26, 113–118. [DOI] [PubMed] [Google Scholar]
- Jones, C. , Damiani, S. , Wells, D. , Chaggar, R. , Lakhani, S.R. , Eusebi, V. , 2001. Molecular cytogenetic comparison of apocrine hyperplasia and apocrine carcinoma of the breast. Am. J. Pathol.. 158, 207–214. [DOI] [PMC free article] [PubMed] [Google Scholar]
- Kenny, P.A., Lee, G.Y., Myers, C.A., Neve, R.M., Semeiks, J.R., Spellman, P.T., Lorenz, K., Lee, E.H., Barcellos-Hof, M.H., Petersen, O.W., Gray, J.W. and Bissel, M.J. The morphologies of breast cancer cell lines in three-dimensional assays correlate with their profiles of gene expression. Mol. Oncol., doi:10.1016/j.molonc.2007.02.004. [DOI] [PMC free article] [PubMed]
- Kerlikowske, K. , Grady, D. , Rubin, S.M. , Sandrock, C. , Ernster, V.L. , 1995. Efficacy of screening mammography. A meta-analysis. JAMA. 273, 149–154. [PubMed] [Google Scholar]
- Krishnamurthy, S. , Sneige, N. , 2002. Molecular and biologic markers of premalignant lesions of human breast. Adv. Anat. Pathol.. 9, 185–197. [DOI] [PubMed] [Google Scholar]
- Krop, I. , Marz, A. , Carlsson, H. , Li, X. , Bloushtain-Qimron, N. , Hu, M. , Gelman, R. , Sabel, M.S. , Schnitt, S. , Ramaswamy, S. , Kleer, C.G. , Enerback, C. , Polyak, K. , 2005. A putative role for psoriasin in breast tumor progression. Cancer Res.. 65, 11326–11334. [DOI] [PubMed] [Google Scholar]
- Lacroix, M. , 2006. Significance, detection and markers of disseminated breast cancer cells. Endocr. Relat. Cancer. 13, 1033–1067. [DOI] [PubMed] [Google Scholar]
- Lai, L.C. , Kadory, S. , Siraj, A.K. , Lennard, T.W. , 1994. Oncostatin M, interleukin 2, interleukin 6 and interleukin 8 in breast cyst fluid. Int. J. Cancer. 59, 369–372. [DOI] [PubMed] [Google Scholar]
- Lai, L.C. , Siraj, A.K. , Erbas, H. , Lennard, T.W. , 1994. Transforming growth factor alpha, beta 1 and beta 2 in breast cyst fluid. Anticancer Res.. 14, 2805–2809. [PubMed] [Google Scholar]
- Landry, C. , Brasseur, F. , Spagnoli, G.C. , Marbaix, E. , Boon, T. , Coulie, P. , Godelaine, D. , 2000. Monoclonal antibody 57B stains tumor tissues that express gene MAGE-A4. Int. J. Cancer. 86, 835–841. [DOI] [PubMed] [Google Scholar]
- Leffers, H. , Madsen, P. , Rasmussen, H.H. , Honore, B. , Andersen, A.H. , Walbum, E. , Vandekerckhove, J. , Celis, J.E. , 1993. Molecular cloning and expression of the transformation sensitive epithelial marker stratifin. A member of a protein family that has been involved in the protein kinase C signalling pathway. J. Mol. Biol.. 231, 982–998. [DOI] [PubMed] [Google Scholar]
- Lerwill, M.F. , 2004. Current practical applications of diagnostic immunohistochemistry in breast pathology. Am. J. Surg. Pathol.. 28, 1076–1091. [DOI] [PubMed] [Google Scholar]
- Liefers, G.J. , Tollenaar, R.A. , 2002. Cancer genetics and their application to individualised medicine. Eur. J. Cancer. 38, 872–879. [DOI] [PubMed] [Google Scholar]
- Madsen, P. , Rasmussen, H.H. , Leffers, H. , Honore, B. , Dejgaard, K. , Olsen, E. , Kiil, J. , Walbum, E. , Andersen, A.H. , Basse, B. , 1991. Molecular cloning, occurrence, and expression of a novel partially secreted protein “psoriasin” that is highly up-regulated in psoriatic skin. J. Invest. Dermatol.. 97, 701–712. [DOI] [PubMed] [Google Scholar]
- Mazoujian, G. , Pinkus, G.S. , Davis, S. , Haagensen, D.E. , 1983. Immunohistochemistry of a gross cystic disease fluid protein (GCDFP-15) of the breast. A marker of apocrine epithelium and breast carcinomas with apocrine features. Am. J. Pathol.. 110, 105–112. [PMC free article] [PubMed] [Google Scholar]
- McCann, A. , Johnston, P.A. , Dervan, P.A. , Gullick, W.J. , Carney, D.N. , 1989. c-erB-2 oncoprotein expression in malignant and nonmalignant breast tissue. Ir. J. Med. Sci.. 158, 137–140. [DOI] [PubMed] [Google Scholar]
- Mills, A.A. , Zheng, B. , Wang, X.J. , Vogel, H. , Roop, D.R. , Bradley, A. , 1999. p63 is a p53 homologue required for limb and epidermal morphogenesis. Nature. 398, 708–713. [DOI] [PubMed] [Google Scholar]
- Moll, R. , 1998. Cytokeratins as markers of differentiation in the diagnosis of epithelial tumors. Subcell. Biochem.. 31, 205–262. [PubMed] [Google Scholar]
- Moreira, J.M. , Ohlsson, G. , Rank, F.E. , Celis, J.E. , 2005. Down-regulation of the tumor suppressor protein 14-3-3sigma is a sporadic event in cancer of the breast. Mol. Cell. Proteomics. 4, 555–569. [DOI] [PubMed] [Google Scholar]
- Moriya, T. , Sakamoto, K. , Sasano, H. , Kawanaka, M. , Sonoo, H. , Manabe, T. , Ito, J. , 2000. Immunohistochemical analysis of Ki-67, p53, p21, and p27 in benign and malignant apocrine lesions of the breast: its correlation to histologic findings in 43 cases. Mod. Pathol.. 13, 13–18. [DOI] [PubMed] [Google Scholar]
- Moriya, T. , Kasajima, A. , Ishida, K. , Kariya, Y. , Akahira, J. , Endoh, M. , Watanabe, M. , Sasano, H. , 2006. New trends of immunohistochemistry for making differential diagnosis of breast lesions. Med. Mol. Morphol.. 39, 8–13. [DOI] [PubMed] [Google Scholar]
- Nagaraja, G.M. , Othman, M. , Fox, B.P. , Alsaber, R. , Pellegrino, C.M. , Zeng, Y. , Khanna, R. , Tamburini, P. , Swaroop, A. , Kandpal, R.P. , 2006. Gene expression signatures and biomarkers of noninvasive and invasive breast cancer cells: comprehensive profiles by representational difference analysis, microarrays and proteomics. Oncogene. 25, 2328–2338. [DOI] [PubMed] [Google Scholar]
- Ness, J.C. , Sedghinasab, M. , Moe, R.E. , Tapper, D. , 1993. Identification of multiple proliferative growth factors in breast cyst fluid. Am. J. Surg.. 166, 237–243. [DOI] [PubMed] [Google Scholar]
- Nielsen, T.O. , Hsu, F.D. , Jensen, K. , Cheang, M. , Karaca, G. , Hu, Z. , Hernandez-Boussard, T. , Livasy, C. , Cowan, D. , Dressler, L. , Akslen, L.A. , Ragaz, J. , Gown, A.M. , Gilks, C.B. , van de Rijn, M. , Perou, C.M. , Aug 15 2004. Immunohistochemical and clinical characterization of the basal-like subtype of invasive breast carcinoma. Clin. Cancer Res.. 10, (16) 5367–5374. [DOI] [PubMed] [Google Scholar]
- O'Farrell, P.H. , 1975. High resolution two-dimensional electrophoresis of proteins. J. Biol. Chem.. 250, 4007–4021. [PMC free article] [PubMed] [Google Scholar]
- O'Malley, F.P. , Bane, A.L. , 2004. The spectrum of apocrine lesions of the breast. Adv. Anat. Pathol.. 11, 1–9. [DOI] [PubMed] [Google Scholar]
- Ohyama, M. , Vogel, J.C. , Amagai, M. , 2007. Gene ontology analysis of human hair follicle bulge molecular signature. J. Dermatol. Sci.. 45, 147–150. [DOI] [PubMed] [Google Scholar]
- Olsen, O. , Gotzsche, P.C. , 2001. Cochrane review on screening for breast cancer with mammography. Lancet. 358, 1340–1342. [DOI] [PubMed] [Google Scholar]
- Ostergaard, M. , Wolf, H. , Orntoft, T.F. , Celis, J.E. , 1999. Psoriasin (S100A7): a putative urinary marker for the follow-up of patients with bladder squamous cell carcinomas. Electrophoresis. 20, 349–354. [DOI] [PubMed] [Google Scholar]
- Page, D.L. , Simpson, J.F. , 2001. What is apocrine adenosis, anyway?. Histopathology. 39, 433–434. [DOI] [PubMed] [Google Scholar]
- Papamichalis, G. , Francia, K. , Karachaliou, F.E. , Anastasiades, O.T. , Spandidos, D.A. , 1988. Expression of the c-myc oncoprotein in human metaplastic epithelial cells of fibrocystic disease. Anticancer Res.. 8, 1217–1222. [PubMed] [Google Scholar]
- Pathology Reporting Of Breast Cancer, 2005. NHS Breast Screening Programme Publication no. 58.
- Pechoux, C. , Gudjonsson, T. , Ronnov-Jessen, L. , Bissell, M.J. , Petersen, O.W. , 1999. Human mammary luminal epithelial cells contain progenitors to myoepithelial cells. Dev. Biol.. 206, 88–99. [DOI] [PubMed] [Google Scholar]
- Perou, C.M. , Sorlie, T. , Eisen, M.B. , van de Rijn, M. , Jeffrey, S.S. , Rees, C.A. , Pollack, J.R. , Ross, D.T. , Johnsen, H. , Akslen, L.A. , Fluge, O. , Pergamenschikov, A. , Williams, C. , Zhu, S.X. , Lonning, P.E. , Borresen-Dale, A.L. , Brown, P.O. , Botstein, D. , 2000. Molecular portraits of human breast tumours. Nature. 406, 747–752. [DOI] [PubMed] [Google Scholar]
- Pinder, S.E. , Reis-Filho, J.S. , 2006. Non operative breast pathology: columnar cell lesions. J. Clin. Pathol. (Epub ahead of print) [DOI] [PMC free article] [PubMed] [Google Scholar]
- Pinder, S.E. , Wencyk, P. , Sibbering, D.M. , Bell, J.A. , Elston, C.W. , Nicholson, R. , Robertson, J.F. , Blamey, R.W. , Ellis, I.O. , 1995. Assessment of the new proliferation marker MIB1 in breast carcinoma using image analysis: associations with other prognostic factors and survival. Br. J. Cancer. 71, 146–149. [DOI] [PMC free article] [PubMed] [Google Scholar]
- Polyak, K. , Hu, M. , 2005. Do myoepithelial cells hold the key for breast tumor progression?. J. Mammary Gland Biol. Neoplasia. 10, 231–247. [DOI] [PubMed] [Google Scholar]
- Quidville, V. , Segond, N. , Lausson, S. , Frenkian, M. , Cohen, R. , Jullienne, A. , 2006. 15-Hydroxyprostaglandin-dehydrogenase is involved in anti-proliferative effect of non-steroidal anti-inflammatory drugs COX-1 inhibitors on a human medullary thyroid carcinoma cell line. Prostaglandins Other Lipid Mediat.. 81, 14–30. [DOI] [PubMed] [Google Scholar]
- Rabinovitz, I. , Mercurio, A.M. , 1997. The integrin alpha6beta4 functions in carcinoma cell migration on laminin-1 by mediating the formation and stabilization of actin-containing motility structures. J. Cell Biol.. 139, 1873–1884. [DOI] [PMC free article] [PubMed] [Google Scholar]
- Reed, M.J. , Coldham, N.G. , Patel, S.R. , Ghilchik, M.W. , James, V.H. , 1992. Interleukin-1 and interleukin-6 in breast cyst fluid: their role in regulating aromatase activity in breast cancer cells. J. Endocrinol.. 132, R5–R8. [DOI] [PubMed] [Google Scholar]
- Rimoldi, D. , Salvi, S. , Schultz-Thater, E. , Spagnoli, G.C. , Cerottini, J.C. , 2000. Anti-MAGE-3 antibody 57B and anti-MAGE-1 antibody 6C1 can be used to study different proteins of the MAGE-A family. Int. J. Cancer. 86, 749–751. [DOI] [PubMed] [Google Scholar]
- Rohan, T.E. , Li, S.Q. , Hartwick, R. , Kandel, R.A. , 2006. p53 Alterations and protein accumulation in benign breast tissue and breast cancer risk: a cohort study. Cancer Epidemiol. Biomarkers Prev.. 15, 1316–1323. [DOI] [PubMed] [Google Scholar]
- Rosen, P.P. , 1997. Rosen's Breast Pathology Book Lippincott-Raven; pp. 123–142 [Google Scholar]
- Schnitt, S.J. , Vincent-Salomon, A. , 2003. Columnar cell lesions of the breast. Adv. Anat. Pathol.. 10, 113–124. [DOI] [PubMed] [Google Scholar]
- Seidman, J.D. , Ashton, M. , Lefkowitz, M. , 1996. Atypical apocrine adenosis of the breast: a clinicopathologic study of 37 patients with 8.7-year follow-up. Cancer. 77, 2529–2537. [DOI] [PubMed] [Google Scholar]
- Selim, A.G. , Ryan, A. , El-Ayat, G.A. , Wells, C.A. , 2001. Loss of heterozygosity and allelic imbalance in apocrine adenosis of the breast. Cancer Detect. Prev.. 25, 262–267. [PubMed] [Google Scholar]
- Selim, A.G. , El-Ayat, G. , Naase, M. , Wells, C.A. , 2002. C-myc oncoprotein expression and gene amplification in apocrine metaplasia and apocrine change within sclerosing adenosis of the breast. Breast. 11, 466–472. [DOI] [PubMed] [Google Scholar]
- Selim, A.G. , El-Ayat, G. , Wells, C.A. , 2002. Expression of c-erbB2, p53, Bcl-2, Bax, c-myc and Ki-67 in apocrine metaplasia and apocrine change within sclerosing adenosis of the breast. Virchows Arch.. 441, 449–455. [DOI] [PubMed] [Google Scholar]
- Selim, A.G. , Ryan, A. , El-Ayat, G. , Wells, C.A. , 2002. Loss of heterozygosity and allelic imbalance in apocrine metaplasia of the breast: microdissection microsatellite analysis. J. Pathol.. 196, 287–291. [DOI] [PubMed] [Google Scholar]
- Shevchenko, A. , Wilm, M. , Vorm, O. , Mann, M. , 1996. Mass spectrometric sequencing of proteins silver-stained polyacrylamide gels. Anal. Chem.. 68, 850–858. [DOI] [PubMed] [Google Scholar]
- Simpson, J.F. , Page, D.L. , 1990. Apocrine adenosis – mimic of mammary carcinoma. Surg. Pathol.. 3, 289–299. [Google Scholar]
- Simpson, P.T. , Gale, T. , Reis-Filho, J.S. , Jones, C. , Parry, S. , Steele, D. , Cossu, A. , Budroni, M. , Palmieri, G. , Lakhani, S.R. , 2004. Distribution and significance of 14-3-3sigma, a novel myoepithelial marker, in normal, benign, and malignant breast tissue. J. Pathol.. 202, 274–285. [DOI] [PubMed] [Google Scholar]
- Simpson, P.T. , Gale, T. , Reis-Filho, J.S. , Jones, C. , Parry, S. , Sloane, J.P. , Hanby, A. , Pinder, S.E. , Lee, A.H. , Humphreys, S. , Ellis, I.O. , Lakhani, S.R. , 2005. Columnar cell lesions of the breast: the missing link in breast cancer progression? A morphological and molecular analysis. Am. J. Surg. Pathol.. 29, 734–746. [DOI] [PubMed] [Google Scholar]
- Skliris, G.P. , Lewis, A. , Emberley, E. , Peng, B. , Weebadda, W.K. , Kemp, A. , Davie, J.R. , Shiu, R.P. , Watson, P.H. , Murphy, L.C. , 2006. Estrogen receptor-beta regulates psoriasin (S100A7) in human breast cancer. Breast Cancer Res. Treat.. (Epub ahead of print) [DOI] [PubMed] [Google Scholar]
- Sorlie, T. , Perou, C.M. , Tibshirani, R. , Aas, T. , Geisler, S. , Johnsen, H. , Hastie, T. , Eisen, M.B. , van de Rijn, M. , Jeffrey, S.S. , Thorsen, T. , Quist, H. , Matese, J.C. , Brown, P.O. , Botstein, D. , Eystein Lonning, P. , Borresen-Dale, A.L. , 2001. Gene expression patterns of breast carcinomas distinguish tumor subclasses with clinical implications. Proc. Natl. Acad. Sci. U.S.A.. 98, 10869–10874. [DOI] [PMC free article] [PubMed] [Google Scholar]
- Stingl, J. , Eaves, C.J. , Kuusk, U. , Emerman, J.T. , 1998. Phenotypic and functional characterization in vitro of a multipotent epithelial cell present in the normal adult human breast. Differentiation. 63, 201–213. [DOI] [PubMed] [Google Scholar]
- Stingl, J. , Eaves, C.J. , Zandieh, I. , Emerman, J.T. , 2001. Characterization of bipotent mammary epithelial progenitor cells in normal adult human breast tissue. Breast Cancer Res. Treat.. 67, 93–109. [DOI] [PubMed] [Google Scholar]
- Stoll, B.A. , 1999. Premalignant breast lesions: role for biological markers in predicting progression to cancer. Eur. J. Cancer. 35, 693–697. [DOI] [PubMed] [Google Scholar]
- Tapper, D. , Gajdusek, C. , Moe, R. , Ness, J. , 1990. Identification of a unique biological tumor marker in human breast cyst fluid and breast cancer tissue. Am. J. Surg.. 159, 473–478. [DOI] [PubMed] [Google Scholar]
- Tavassoli, F.A. , Norris, H.J. , 1994. Intraductal apocrine carcinoma: a clinicopathologic study of 37 cases. Mod. Pathol.. 7, 813–818. [PubMed] [Google Scholar]
- Tavassoli, F.A. , Purcell, C.A. , Man, Y.G. , 1996. Down regulation of bcl2, ER, PR associated with AR expression is triggered by apocrine differentiation of mammary epithelium. Mod. Pathol.. 9, 25A [Google Scholar]
- Triggle, D.J. , 2007. Drug discovery and delivery in the 21st century. Med. Princ. Pract.. 16, 1–14. [DOI] [PubMed] [Google Scholar]
- Tse, G.M. , Tan, P.H. , Chaiwun, B. , Putti, T.C. , Lui, P.C. , Tsang, A.K. , Wong, F.C. , Lo, A.W. , 2006. p63 is useful in the diagnosis of mammary metaplastic carcinomas. Pathology. 38, 16–20. [DOI] [PubMed] [Google Scholar]
- van Diest, P.J. , van der Wall, E. , Baak, J.P. , 2004. Prognostic value of proliferation in invasive breast cancer: a review. J. Clin. Pathol.. 57, 675–681. [DOI] [PMC free article] [PubMed] [Google Scholar]
- Viacava, P. , Naccarato, A.G. , Bevilacqua, G. , 1998. Spectrum of GCDFP-15 expression in human fetal and adult normal tissues. Virchows Arch.. 432, 255–260. [DOI] [PubMed] [Google Scholar]
- Villadsen, R., Fridriksdottir, A.J., Rønnov-Jessen, L., Gudjonsson, T., Rank F., LaBarge M.A., Bissel, M.J., Petersen O.W., 2007. Evidence for a stem cell hierarchy in the adult human breast. J. Cell Sci. 177, 87–101. [DOI] [PMC free article] [PubMed]
- Washington, C. , Dalbegue, F. , Abreo, F. , Taubenberger, J.K. , Lichy, J.H. , 2000. Loss of heterozygosity in fibrocystic change of the breast: genetic relationship between benign proliferative lesions and associated carcinomas. Am. J. Pathol.. 157, 323–329. [DOI] [PMC free article] [PubMed] [Google Scholar]
- Weidner, N. , Moore, D.H. , Vartanian, R. , 1994. Correlation of Ki-67 antigen expression with mitotic figure index and tumor grade in breast carcinomas using the novel “paraffin”-reactive MIB1 antibody. Hum. Pathol.. 25, 337–342. [DOI] [PubMed] [Google Scholar]
- Wellings, S.R. , Alpers, C.E. , 1987. Apocrine cystic metaplasia: subgross pathology and prevalence in cancer-associated versus random autopsy breasts. Hum. Pathol.. 18, 381–386. [DOI] [PubMed] [Google Scholar]
- Wellings, S.R. , Jensen, H.M. , Marcum, R.G. , 1975. An atlas of subgross pathology of the human breast with special reference to possible precancerous lesions. J. Natl. Cancer Inst.. 55, 231–273. [PubMed] [Google Scholar]
- Wells, C.A. , McGregor, I.L. , Makunura, C.N. , Yeomans, P. , Davies, J.D. , 1995. Apocrine adenosis: a precursor of aggressive breast cancer?. J. Clin. Pathol.. 48, 737–742. [DOI] [PMC free article] [PubMed] [Google Scholar]
- Wolf, I. , O'Kelly, J. , Rubinek, T. , Tong, M. , Nguyen, A. , Lin, B.T. , Tai, H.H. , Karlan, B.Y. , Koeffler, H.P. , 2006. 15-hydroxyprostaglandin dehydrogenase is a tumor suppressor of human breast cancer. Cancer Res.. 66, 7818–7823. [DOI] [PubMed] [Google Scholar]
- Zagorianakou, P. , Zagorianakou, N. , Stefanou, D. , Makrydimas, G. , Agnantis, N.J. , 2006. The enigmatic nature of apocrine breast lesions. Virchows Arch.. 448, 525–531. [DOI] [PubMed] [Google Scholar]
- Zhang, R.R. , Man, Y.G. , Vang, R. , Saenger, J.S. , Barner, R. , Wheeler, D.T. , Liang, C.Y. , Vinh, T.N. , Bratthauer, G.L. , 2003. A subset of morphologically distinct mammary myoepithelial cells lacks corresponding immunophenotypic markers. Breast Cancer Res.. 5, 151–156. [DOI] [PMC free article] [PubMed] [Google Scholar]