

Abstract
Liver fibrosis assessment is essential to make a prognosis and to determine the appropriate anti-fibrosis treatment. Non-invasive serum markers are widely studied in patients to assess liver fibrosis due to the limitations of liver biopsy. When using animal models to study the mechanism and intervention of hepatic fibrosis, serum markers might be useful for the continuous assessment of liver fibrosis in individual animals, which could avoid the influence of biological differences between individuals. However, it is unclear whether serum markers can assess hepatic fibrosis in the animal model. In the present study, we evaluated and compared the ability of four serum markers to assess liver fibrosis in bile duct ligation mice. According to the stages of liver fibrosis assessed by pathological changes, mice in this study were divided into five groups (F0, F1, F2, F3, and F4). Subsequently, four serum markers, aspartate aminotransferase-to-alanine aminotransferase ratio (AAR), aspartate aminotransferase-to-platelet ratio index (APRI), fibrosis index based on the 4 factors (FIB-4), and Forns Index, were calculated for each group. Furthermore, the correlations between serum markers and pathological stages and the ability of serological markers to evaluate liver fibrosis were analyzed. AAR, APRI, FIB-4, and Forns Index could significantly distinguish F0-2 from F3-4 mice. APRI, FIB-4, and Forns Index could detect F0-3 from F4 mice. Among these four markers, FIB-4 was the best able to distinguish ≥F2 and ≥F3, with area under the curve values of 0.882 and 0.92, respectively. Forns Index was best for diagnosing F4 with area under the curve value of 0.879. These results demonstrated that serum markers could be used for assessing liver fibrosis in bile duct ligation mice, and therefore, these markers might lead to more accurate diagnostic and therapeutic studies through continuous monitoring in individual animals.
Impact statement
The assessment of liver fibrosis is essential for making a prognosis and determining the appropriate anti-fibrosis treatment. In studies focusing on the mechanism and treatment of liver fibrosis using animal models, it would be more accurate to continuously evaluate liver fibrosis in a single animal to avoid individual biological differences. Unfortunately, it is difficult to perform continuous assessment through liver biopsy in the most commonly used rodent models. It is unclear whether serum markers, which have been used in hepatic fibrosis patients, could be used in animal models. Our results demonstrate that serum markers could be used for assessing liver fibrosis in bile duct ligation mice. This study might contribute to more accurate diagnostic and therapeutic studies through continuous monitoring in individual animals.
Keywords: Liver fibrosis, serum markers, bile duct ligation, mice
Introduction
Liver fibrosis is a common result of the damage–repair response following different types of chronic insult to the liver.1–4 In patients who develop liver fibrosis, the majority ultimately develop liver cirrhosis, decompensated liver disease, and hepatocellular carcinoma. Information on the stage of hepatic fibrosis is essential for making a prognosis and deciding on anti-fibrosis treatment.5
At present, the gold standard to assess liver fibrosis is liver biopsy.6–8 However, there are some disadvantages of liver biopsy, such as that it cannot completely reflect the fibrosis of the whole liver and the associated risk due to its invasive nature.9–12 In light of these limitations, non-invasive serum markers have been developed for the assessment of hepatic fibrosis in recent years. Serum markers for liver fibrosis could be categorized into direct or indirect. Direct markers directly reflect the turnover of the extracellular matrix, including fibrogenic cytokines, extracellular matrix components, degradation products and enzymes involved in these processes. But they are not routinely provided in every hospital setting, which limit their clinical practice. Indirect markers correlate with hepatic function or inflammation and they are based on data from routine serological tests.13 The indirect markers were largely studied in patients with different liver diseases, such as viral hepatitis,14,15 alcohol liver disease,13 and non-alcoholic fatty liver disease (NAFLD).16–18
In studies focusing on the mechanism and treatment of liver fibrosis using animal models, it is preferable to continuously evaluate liver fibrosis in the individual animal to avoid individual biological differences. However, it is difficult to perform continuous assessment through liver biopsy in the most commonly used rodent models, while non-invasive serum markers might become a feasible choice. It is unclear whether the serum markers, which have been used in hepatic fibrosis patients, could be used in animal models. In this study, we evaluated the diagnostic ability of four cost-efficient and convenient indirect markers, aspartate aminotransferase-to-alanine aminotransferase ratio (AAR), aspartate aminotransferase-to-platelet ratio index (APRI), fibrosis index based on the 4 factors (FIB-4) and Forns Index, in bile duct ligation (BDL) mice.
Materials and methods
Animals
Seven-week-old male Kunming mice, weighing 25 to 30 g, were purchased from Chengdu Da-Shuo experimental animal breeding research center. Mice were allowed to freely eat standard AIN-76 rodent chow and drink sterile water. The BDL operation was adjusted slightly based on laboratory procedures from the previous study.19 Briefly, the common bile duct was ligated by two pieces of 5.0 mersilk, one upstream of bile outflow and another downstream. The bile duct was not cut. In sham-operated controls, the bile duct was not ligated but identified. BDL mice were drawn once every other week, randomly sampling six to seven mice each time for a total of five times. Sham mice were sacrificed the week all BDL mice were sacrificed. This study included 41 mice, 33 of which were BDL mice and eight were sham controls. The liver and blood samples of all mice were collected for analyses. Animals were treated according to the experimental procedure approved by the Institutional Animal Care and Use Committee.
Histopathological staining
The liver tissues were placed in 10% neutral formalin-fixed solution, dehydrated, and paraffin embedded. The samples underwent dehydration in gradient ethanol and then paraffin embedding. Sections were stained with hematoxylin-eosin (HE) or picrosirius red, as previously reported.20 HE staining was performed according to a general laboratory procedure. The ratio of Sirius red to fast green stain was performed in a ratio of two to five.
The collagen volume fraction
Liver tissues obtained from all mice were stained with Sirius red for the quantification of collagen according to a previous study.21 Briefly, hepatic collagen was quantified at a magnification of 40× with a Nikon Eclipse 80i microscope connected to a video camera. Each section was analyzed, and three to five non-overlapping horizons were randomly chosen for collection. The collagen volume fraction (CVF) was analyzed using Image-Pro Plus 6.0 software, and the percentage of collagen area per visual area was calculated. The final CVF value for each mouse was the mean of each slice.
Measurement of hepatic hydroxyproline concentration
The amount of collagen was determined by hydroxyproline content.22 The content of hydroxyproline in liver tissue was measured by a hydroxyproline assay kit (Nanjing Jiancheng Bioengineering Research Institute, Nanjing, China) according to the manufacturer’s instruction. In total, 80 mg of liver tissue was removed from the liquid nitrogen and treated for 20 min in 1 mL of an alkaline hydrolysis solution in a boiling water bath. Then, an appropriate amount of activated carbon was added after the hydrolysis solution was diluted 10 times. The sample was then centrifuged, and the supernatant was used for measurement. The sample content of free hydroxyproline was calculated using hydroxyproline as a standard.
Pathological staging
Liver pathological examination was performed on all liver tissues. Stages were scored for all specimens (double read) using Metavir6,23 scoring. Mice were divided into five groups: F0: no fibrosis, F1: mild fibrosis (portal fibrosis without septa), F2: moderate fibrosis (few septa), F3: severe fibrosis (numerous septa without cirrhosis), and F4: cirrhosis. No fibrosis mice were obtained from the controls. F2, F3, and F4 were defined as significant fibrosis.
Detection of blood parameters
Blood samples were obtained from the submandibular vein plexus before mice were sacrificed. The operations were performed as previously described in another study.24 Platelets (PLT) were counted using a manual counting method by microscope in strict accordance with the provisions of the operation as previously described.25 Serum alanine aminotransferase (ALT), aspartate aminotransferase (AST), gamma-glutamyltransferase (GGT), and total cholesterol were measured using commercially available kits (Jiancheng Institute of Biotechnology, Nanjing, China) according to the manufacturer’s instructions.
Serum markers
The serum markers were calculated according to previous reported studies. The AAR was calculated for each mouse. The determination of the APRI comprises using the AST-to-platelet ratio, two inexpensive laboratory tests, which are routinely used.26 The FIB-4 index is a simple and inexpensive algorithm consisting of age and the routine laboratory tests for measuring AST, ALT, and PLT for the diagnosis of liver fibrosis.27 PLT count, cholesterol levels, age, and GGT are used to determine Forns Index.28 In addition, the four aforementioned serum markers in different stages of liver fibrosis were compared.
Statistical analysis
The data were analyzed using SPSS version 21.0 for Windows. The laboratory data were shown as the mean or mean with the 95% confidence interval. Diagnostic results between stages were compared using the non-parametric Wilcoxon-Mann-Whitney U-test or Student’s t-test with two-sided p values where p values ≤0.05 were regarded as significant. The differences in overall (ANOVA or Kruskal-Wallis test) values were used to compare continuous variables. The data were analyzed using correlation analysis to examine the relationship between the findings of serum markers and histological staging. Diagnostic performances of non-invasive tests were expressed using sensitivity, specificity, positive predictive value (PPV), negative predictive value (NPV), and the area under the receiver operating characteristic (ROC) curve. The data were analyzed based on the calculated values of serum markers and histological staging using Medcalc29 software (version 16.2).
Results
Fibrosis staging of BDL mice
All liver tissues of the mice were scored using the Metavir system. Eight sham mice were scored as F0 (no fibrosis). Five BDL mice were scored as F1 (mild fibrosis): four mice of these mice were sacrificed at the end of the second week, and one mouse was sacrificed at the end of the fourth week. Twelve BDL mice were scored as F2 (moderate fibrosis): three mice, four mice, one mouse, two mice, and two mice were sacrificed at the end of the second, the fourth, the sixth, the eighth and the 10th week, respectively. Eight BDL mice were scored as F3 (severe fibrosis): one mouse, two mice, four mice, and one mouse were sacrificed at the end of the fourth, the sixth, the eighth, and the 10th week, respectively. Eight BDL mice were scored as F4 (cirrhosis): three mice, two mice, and three mice were sacrificed at the end of the sixth, the eighth, and the 10th week, respectively.
As shown in Figure 1(a), the BDL mice had significantly increased inflammatory infiltration and collagen deposition in the liver as revealed, respectively, by HE staining and Sirius red staining.
Figure 1.

The representative graphs of liver fibrosis in different stages. Histological staining of a mouse, according to the Metavir system (a) Hematoxylin-eosin (HE) and Sirius red staining, section slides obtained from each mouse and the images of three to five randomized and non-overlapping areas at 100×. (b) The mean liver collagen volume fraction calculated according to Sirius red staining. (c) Liver hydroxyproline content were detected in the left lobe of each mouse. (d) Body weight determined at the day when mice were sacrificed. *p < 0.05, **p < 0.01, ***p < 0.001 vs. F0 group; #p < 0.05, ##p < 0.01, ###p < 0.001 vs. F1 group; Δp < 0.05, ΔΔp < 0.01, ΔΔΔp < 0.001 vs. F2 group; ⋆p < 0.05 vs. F3 group. (A color version of this figure is available in the online journal)
To verify the accuracy of staging, the changes in the collagen of liver tissues in different stages were further analyzed using CVF and hydroxyproline, an indicator of collagen. As shown in Figure 1(b), the CVF values were positively correlated to the stage of liver fibrosis, from 0.032 ± 0.021% in F0 to 8.2 ± 2.3% in F4. The values of CVF in fibrosis groups (F1, F2, F3 or F4) were significantly increased when compared with no fibrosis (F0) group (p < 0.001). Meanwhile, the CVF values were significantly different between F3 or F4 groups and F1 or F2 groups (p < 0.001), or F3 group and F4 group (p = 0.0124). However, the difference was not statistically significant when F1 group was compared with F2 group. There was also a positive correlation between the hydroxyproline concentration and the fibrosis score, from 0.39 ± 0.04 µg/mg in F0 to 0.88 ± 0.19 µg/mg in F4. Except F1 vs. F2 group or F2 vs. F3 group, the statistically significant difference was found among other fibrosis groups (p < 0.05) (Figure 1(c)). Moreover, it was shown that the body weight of mice was decreased when the fibrosis score increased. The differences were only statistically significant (p < 0.05) when F1, F3 or F4 groups were compared with F0 group and cirrhosis group (F4) were compared with mild fibrosis (F1) or moderate fibrosis (F2) (Figure 1(d)). These results suggested the accuracy of liver fibrosis staging in BDL mice.
Diagnostic ability of serum markers for assessing liver fibrosis in BDL mice
Four simple and classic serum markers, the AAR, APRI, FIB-4, and Forns Index were determined. As shown in Figure 2(a), the mean values of AAR in F3 or F4 groups were increased with statistically significant differences (p < 0.05) when F4 group was compared with F0, F1, or F2 groups and F3 group was compared with F2 group. The mean AAR in mice of mice with F3 and F4 mice was significantly higher than in mice of mice with F0, F1, and F2 mice (p = 0.0008 by unpaired t-test). The mean AAR did not differ between F0-1 to F2-4 mice and in F0-3 to F4 mice (p = 0.0707, p = 0.2227, respectively) (Table 1). Despite some overlap between the various stages of fibrosis, the AAR distinguished F0-2 from F3-4 mice (p < 0.001) with a corresponding AUC mean (95% CI) value of 0.85 (0.704–0.942) (Table 2).
Figure 2.

Boxplots of (a) AAR, (b) APRI, (c) FIB-4, and (d) Forns Index performed in controls and fibrotic mice by Metavir stages. *p < 0.05, **p < 0.01, ***p < 0.001 vs. F0 group; #p < 0.05, ##p < 0.01, ###p < 0.001 vs. F1 group; Δp < 0.05, ΔΔΔp < 0.001 vs. F2 group
Table 1.
Outcome of the serum markers in mice, according to Metavir stages
| Metavir (n = 41) |
r |
p
|
|||||||
|---|---|---|---|---|---|---|---|---|---|
| F0 (n = 8) | F1 (n = 5) | F2 (n = 12) | F3 (n = 8) | F4 (n = 8) | ≥F2 | ≥F3 | ≥F4 | ||
| AARa | 0.7846 ± 0.4445 | 0.442 ± 0.2538 | 0.6814 ± 0.3322 | 1.753 ± 1.591 | 1.352 ± 0.3751 | 0.3705* | 0.0707 | 0.0008 | 0.2227 |
| APRIa | 1.947 ± 0.9398 | 7.206 ± 2.376 | 8.278 ± 3.941 | 8.265 ± 2.068 | 11.34 ± 6.799 | 0.5906*** | 0.0007 | 0.0128 | 0.0104 |
| FIB-4a | 0.5166 ± 0.2865 | 0.3995 ± 0.1787 | 0.7738 ± 0.3343 | 1.389 ± 0.7043 | 1.701 ± 0.647 | 0.6807*** | 0.0004 | <0.0001 | 0.0003 |
| Forns Indexa | 6.748 ± 0.5702 | 5.236 ± 0.8979 | 6.831 ± 0.7906 | 7.899 ± 1.106 | 8.718 ± 1.121 | 0.6201*** | 0.0005 | <0.0001 | 0.0002 |
AAR: aspartate aminotransferase-to-alanine aminotransferase ratio; r: correlation coefficient; APRI: aspartate aminotransferase-to-platelet ratio index; FIB-4: fibrosis index based on the 4 factors.
Mean ± standard deviation.
p < 0.05, ***p < 0.001.
Table 2.
AUC and 95% CI for AAR, APRI, FIB-4, and Forns Index, according to Metavir stages
| ≥F2 (95% CI) | ≥F3 (95% CI) | ≥F4 (95% CI) | |
|---|---|---|---|
| AAR | 0.72 (0.558–0.849) | 0.85 (0.704–0.942) | 0.826 (0.675–0.926) |
| APRI | 0.863 (0.719–0.950) | 0.76 (0.601–0.879) | 0.761 (0.603–0.880) |
| FIB-4 | 0.882 (0.743–0.961) | 0.92 (0.792–0.982) | 0.867 (0.725–0.953) |
| Forns Index | 0.819 (0.667–0.921) | 0.895 (0.759–0.969) | 0.879 (0.739–0.960) |
AUC: area under the curve; AAR: aspartate aminotransferase-to-alanine aminotransferase ratio; APRI: aspartate aminotransferase-to-platelet ratio index; FIB-4: fibrosis index based on the 4 factors.
The values of APRI in fibrosis groups (F1, F2, F3, or F4) were significantly higher than no fibrosis (F0) group (p < 0.01). However, due to the rather large overlapping of data, the significant differences could not be found among the fibrosis groups (Figure 2(b)). APRI was significantly correlated with the stage of fibrosis and with a higher correlation coefficient than AAR (r = 0.5906, r = 0.3705, respectively, p < 0.0001) (Table 1). APRI significantly distinguished F0-1 from F2-4 mice (p = 0.0007) with a corresponding AUC mean (95% CI) of 0.863 (0.719–0.950), F0-2 from F3-4 mice (p = 0.0128), and F0-3 from F4 mice (p = 0.0003), despite some overlap between the various stages of fibrosis (Table 2).
For FIB-4 and Forns Index, their mean values increased with the development of liver fibrosis in a whole. The differences were statistically significant (p < 0.05) when F3 or F4 groups were compared with F0, F1, or F2 groups and F2 group was compared with F1 group (Figure 2(c) and (d)). FIB-4 and Forns Index differentiated among the following fibrosis stages: F0-3 from F4 (p < 0.001), F0-2 from F3-4 (p < 0.0001), and F0-1 from F2-4 (p < 0.001). Either FIB-4 or Forns Index was significantly correlated with the stage of fibrosis (r = 0.6807, r = 0.6201, respectively, p < 0.0001) (Table 1). As shown in Figure 3, ROC curves for FIB-4 differentiated F0-1 from F2-4 and F3-4 from F0-2, while for Forns Index differentiated F4 from F0-3 and F3-4 from F0-2. Moreover, the area under the receiver operating characteristic (AUROC) for FIB-4 in differentiating F0-2 from F3-4 was higher (0.92) compared with differentiating F0-3 from F4 (0.867). And the AUROC for Forns Index in differentiating F0-2 from F3-4 was higher (0.895) compared with differentiating F0-1 from F2-4 (0.819) (Table 2).
Figure 3.
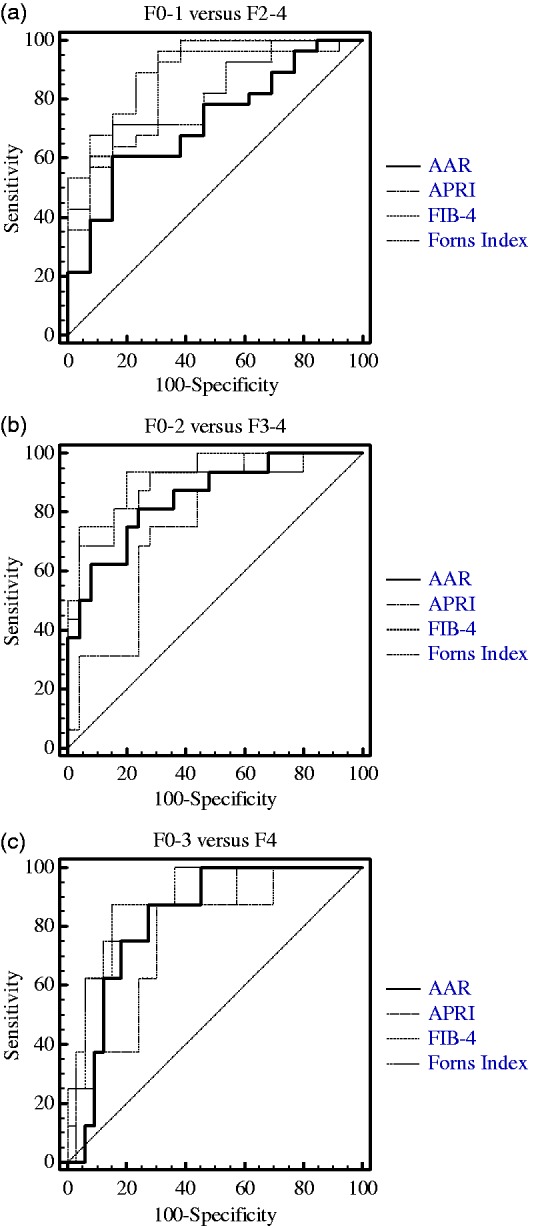
Receiver operator characteristic (ROC) curves from four non-invasive markers with (a) threshold F0-1 vs. F2-4, (b) F0-2 vs. F3-4, and (c) F0-3 vs. F4. Diagonal segments are produced by ties.
AAR: aspartate aminotransferase-to-alanine aminotransferase ratio; APRI: aspartate aminotransferase-to-platelet ratio index; FIB-4: fibrosis index based on the 4 factors.
When comparing the diagnostic capacity of the AAR, APRI, FIB-4, and Forns Index for differentiating F0-1 from F2-4 and F0-2 from F3-4, the best marker was FIB-4 among the four serum markers. Furthermore, FIB-4 was still a good marker for distinguishing F4 from F0-3 (Figure 3).
The accuracy of serum markers for assessing liver fibrosis
Diagnostic values of non-invasive tests defined by their optimal cut-off values can determine whether these markers can diagnose fibrosis (Table 3). In mice with different fibrosis stages, the AAR for differentiating F0-1 from F2-4, cut-off at 0.8249, showed a specificity of 84.62% and PPV of 89.5%. For differentiating F0-2 from F3-4 at the same cut-off, there was a specificity of 76% and PPV of 68.4%. The diagnostic ability of the former was better than that of the latter. Similarly, Forns Index for differentiating F0-1 from F2-4 and F0-2 from F3-4, cut-off at 7.0648, showed a specificity of 92.31% and a PPV of 95%; the latter with the same cut-off showed a specificity of 80% and a PPV of 75%. Thus, the former showed better specificity and PPV. When comparing the AAR with Forns Index for diagnosing the early stage of fibrosis, Forns Index was a better marker. The cut-off at 1.0996 of FIB-4 for differentiating F0-2 from F3-4 showed an excellent specificity of 92.31% and a PPV of 95%. Using this cut-off value with an NPV of 85.7%, 14.3% of the samples were misclassified compared with staging according to liver histology. To diagnose cirrhosis, FIB-4, with a cut-off at 1.1936, was still a good indicator, with a specificity of 84.85% and a PPV of 58.3%. Using this cut-off value with an NPV of 96.6%, the chances of misclassification compared with staging according to liver histology was only 3.4%.
Table 3.
Diagnostic values of serum markers with defined optimal cut-off.
| AAR |
APRI |
FIB-4 |
Forns Index |
|||||||||
|---|---|---|---|---|---|---|---|---|---|---|---|---|
| ≥F2 | ≥F3 | ≥F4 | ≥F2 | ≥F3 | ≥F4 | ≥F2 | ≥F3 | ≥F4 | ≥F2 | ≥F3 | ≥F4 | |
| Cut-off | 0.8249 | 0.8249 | 0.9507 | 3.5578 | 7.7225 | 8.1731 | 0.5929 | 1.0996 | 1.1936 | 7.0648 | 7.0648 | 7.0648 |
| Sens. | 60.71 | 81.25 | 87.50 | 96.43 | 75.00 | 87.50 | 89.29 | 75.00 | 87.50 | 67.86 | 93.75 | 100.00 |
| Spec. | 84.62 | 76.00 | 72.73 | 69.23 | 72.00 | 69.70 | 76.92 | 96.00 | 84.85 | 92.31 | 80.00 | 63.64 |
| PPV | 89.50 | 68.40 | 43.80 | 87.10 | 63.20 | 41.20 | 89.30 | 92.30 | 58.30 | 95.00 | 75.00 | 40.00 |
| NPV | 50.00 | 86.40 | 96.00 | 90.00 | 81.80 | 95.80 | 76.90 | 85.70 | 96.60 | 57.10 | 95.20 | 100.00 |
| LR+ | 3.95 | 3.39 | 3.21 | 3.13 | 2.68 | 2.89 | 3.87 | 18.75 | 5.78 | 8.82 | 4.69 | 2.75 |
| LR− | 0.46 | 0.25 | 0.17 | 0.05 | 0.35 | 0.18 | 0.14 | 0.26 | 0.15 | 0.35 | 0.08 | 0.00 |
Sens: sensitivity; Spec: specificity; PPV: positive predictive value; NPV: negative predictive value; LR+: positive likelihood ratio; LR−: negative likelihood ratio; AAR: aspartate aminotransferase-to-alanine aminotransferase ratio; APRI: aspartate aminotransferase-to-platelet ratio index; FIB-4: fibrosis index based on the 4 factors.
Discussion
In this study, we have shown that four serum markers obtained from routine laboratory tests have a good ability to evaluate liver fibrosis in mice. Among these four markers, FIB-4 was best able to distinguish significant fibrosis and Forns Index was best able for diagnosing cirrhosis. To our knowledge, this is the first study to evaluate and compare the diagnostic ability of the four serum markers at different stages of liver fibrosis in the animal model.
In previous studies on AAR,6 there was a statistically significant correlation between the AAR and the presence of cirrhosis. A significant amount of evidence showed that an AAR > 1 suggested cirrhosis in viral hepatitis patients8,14,30 or NALD patients.16 In our study, BDL mice without cirrhosis appeared to have a ratio value >1, likely due to inflammation caused by viral hepatitis and NALD different from cholestasis.
APRI is one of the simplest marker panels that can diagnose significant fibrosis and cirrhosis with acceptable accuracy.26 It has been extensively evaluated in hepatitis C virus (HCV)-infected patients. A previous meta-analysis found AUROC values of 0.77 for the diagnosis of stages ≥F2, 0.8 for stages ≥F3, and 0.83 for cirrhosis in hepatitis C patients.31 These results differ from this study, which showed that APRI had AUROC values of 0.863 for the diagnosis of stages ≥F2, 0.76 for stages ≥F3, and 0.761 for cirrhosis in BDL mice. These results suggest that APRI might have the ability to distinguish early stage liver fibrosis caused by cholestasis.
FIB-4 was initially evaluated in human immunodeficiency virus (HIV)/HCV co-infected patients,27 and Forns24 Index was first defined in 2002. The AUC values of FIB-432,33 and Forns Index32,34 in fibrosis assessment were at least as high as those reported in previous studies. FIB-4 and Forns Index diagnosed cirrhosis with respective AUROC values of 0.87 (0.84–0.91) and 0.87 (0.84–0.90) in HIV/HCV co-infected patients.32 In our study, the AUROC (95% confidence interval) values for the detection of liver cirrhosis in BDL mice were 0.867 (0.725–0.953) and 0.879 (0.739–0.960) for FIB-4 and Forns Index, respectively. These results suggest the serum marker is able to consider a higher number of blood parameters and thus improves the ability to diagnose liver fibrosis.
Overall, using variables easily available to clinicians, we chose those that have constructed and validated serum markers, and aimed to investigate their ability to assess liver fibrosis in animal experiment research. The serum markers are acceptable, except for the lower diagnostic ability of the AAR for early stage fibrosis and cirrhosis and APRI for significant fibrosis and cirrhosis. To differentiate mice with significant fibrosis from those without, we recommend using FIB-4 as a first choice. Furthermore, FIB-4 can even distinguish liver fibrosis at an early stage from other stages and differentiate cirrhosis from other stages. Forns Index is a preferred serum marker for the diagnosis of liver cirrhosis. This study might assist researchers in evaluating reasonable treatments, curative effects, and mechanism research by continuous observation in individual animals. Furthermore, the results might aid in predicting stages of liver fibrosis in liver fibrosis animal models through the establishment of predictive values.
Acknowledgements
This study was supported by Sichuan University West China Hospital. The authors thank Ms. Shan Zhao for technical assistance.
Authors’ contributions
Participated in research design: CXX and LW. Conducted experiments: CXX, BM, and NW. Performed data analysis: CXX and LW. Contributed to the writing of the manuscript: CXX and LW.
Declaration of conflicting interests
The author(s) declared no potential conflicts of interest with respect to the research, authorship, and/or publication of this article.
References
- 1.Moriya K, Bae E, Honda K, Sakai K, Sakaguchi T, Tsujimoto I, Kamisoyama H, Keene DR, Sasaki T, Sakai T. A fibronectin-independent mechanism of collagen fibrillogenesis in adult liver remodeling. Gastroenterology 2011; 140: 1653–63. [DOI] [PMC free article] [PubMed] [Google Scholar]
- 2.Bartosch B, Thimme R, Blum HE, Zoulim F. Hepatitis C virus-induced hepatocarcinogenesis. J Hepatol 2009; 51: 810–20. [DOI] [PubMed] [Google Scholar]
- 3.Beschin A, De Baetselier P, Van Ginderachter JA. Contribution of myeloid cell subsets to liver fibrosis in parasite infection. J Pathol 2013; 229: 186–97. [DOI] [PubMed] [Google Scholar]
- 4.Xiao G, Zhu F, Wang M, Zhang H, Ye D, Yang J, Jiang L, Liu C, Yan L, Qin R. Diagnostic accuracy of APRI and FIB-4 for predicting hepatitis B virus-related liver fibrosis accompanied with hepatocellular carcinoma. Dig Liver Dis 2016; 48: 1220–6. [DOI] [PubMed] [Google Scholar]
- 5.Koda M, Matunaga Y, Kawakami M, Kishimoto Y, Suou T, Murawaki Y. FibroIndex, a practical index for predicting significant fibrosis in patients with chronic hepatitis C. Hepatology 2007; 45: 297–306. [DOI] [PubMed] [Google Scholar]
- 6.The French METAVIR Cooperative Study Group. Intraobserver and interobserver variations in liver biopsy interpretation in patients with chronic hepatitis C. Hepatology 1994; 20: 15–20. [PubMed] [Google Scholar]
- 7.Bedossa P, Poynard T. An algorithm for the grading of activity in chronic hepatitis C. The METAVIR Cooperative Study Group. Hepatology 1996; 24: 289–93. [DOI] [PubMed] [Google Scholar]
- 8.Stibbe KJ, Verveer C, Francke J, Hansen BE, Zondervan PE, Kuipers EJ, de Knegt RJ, van Vuuren AJ. Comparison of non-invasive assessment to diagnose liver fibrosis in chronic hepatitis B and C patients. Scand J Gastroenterol 2011; 46: 962–72. [DOI] [PubMed] [Google Scholar]
- 9.Lurie Y, Webb M, Cytter-Kuint R, Shteingart S, Lederkremer GZ. Non-invasive diagnosis of liver fibrosis and cirrhosis. World J Gastroenterol 2015; 21: 11567–83. [DOI] [PMC free article] [PubMed] [Google Scholar]
- 10.Castera L, Pinzani M. Biopsy and non-invasive methods for the diagnosis of liver fibrosis: does it take two to tango? Gut 2010; 59: 861–6. [DOI] [PubMed] [Google Scholar]
- 11.Bedossa P, Dargère D, Paradis V. Sampling variability of liver fibrosis in chronic hepatitis C. Hepatology 2003; 38: 1449–57. [DOI] [PubMed] [Google Scholar]
- 12.Martínez SM, Crespo G, Navasa M, Forns X. Noninvasive assessment of liver fibrosis. Hepatology 2011; 53: 325–35. [DOI] [PubMed] [Google Scholar]
- 13.Chrostek L, Panasiuk A. Liver fibrosis markers in alcoholic liver disease. World J Gastroenterol 2014; 20: 8018–23. [DOI] [PMC free article] [PubMed] [Google Scholar]
- 14.Giannini E, Botta F, Fasoli A, Ceppa P, Risso D, Lantieri PB, Celle G, Testa R. Progressive liver functional impairment is associated with an increase in AAR. Dig Dis Sci 1999; 44: 1249–53. [DOI] [PubMed] [Google Scholar]
- 15.Xiao G, Yang J, Yan L. Comparison of diagnostic accuracy of aspartate aminotransferase to platelet ratio index and fibrosis-4 index for detecting liver fibrosis in adult patients with chronic hepatitis B virus infection: a systemic review and meta-analysis. Hepatology 2015; 61: 292–302. [DOI] [PubMed] [Google Scholar]
- 16.McPherson S, Stewart SF, Henderson E, Burt AD, Day CP. Simple non-invasive fibrosis scoring systems can reliably exclude advanced fibrosis in patients with non-alcoholic fatty liver disease. Gut 2010; 59: 1265–9. [DOI] [PubMed] [Google Scholar]
- 17.Reuben A. Leave gourmandising. Hepatology 2002; 36: 1303–6. [DOI] [PubMed] [Google Scholar]
- 18.Tapper EB, Krajewski K, Lai M, Challies T, Kane R, Afdhal N, Lau D. Simple non-invasive biomarkers of advanced fibrosis in the evaluation of non-alcoholic fatty liver disease. Gastroenterol Rep (Oxf) 2014; 2: 276–80. [DOI] [PMC free article] [PubMed] [Google Scholar]
- 19.Shi F, Sheng Q, Xu X, Huang W, Kang YJ. Zinc supplementation suppresses the progression of bile duct ligation-induced liver fibrosis in mice. Exp Biol Med (Maywood) 2015; 240: 1197–204. [DOI] [PMC free article] [PubMed] [Google Scholar]
- 20.Jiang Y, Kang YJ. Metallothionein gene therapy for chemical-induced liver fibrosis in mice. Mol Ther 2004; 10: 1130–9. [DOI] [PubMed] [Google Scholar]
- 21.Yu Y, Jia XJ, Zhang WP, Fang TT, Hu J, Ma SF, Gao Q. The protective effect of low-dose ethanol on myocardial fibrosis through downregulating the JNK signaling pathway in diabetic rats. J Diabetes Res 2016; 2016: 3834283– 3834283. [DOI] [PMC free article] [PubMed] [Google Scholar]
- 22.Jimenez W, Parés A, Caballería J, Heredia D, Bruguera M, Torres M, Rojkind M, Rodés J. Measurement of fibrosis in needle liver biopsies: evaluation of a colorimetric method. Hepatology 1985; 5: 815–8. [DOI] [PubMed] [Google Scholar]
- 23.Sheth SG, Flamm SL, Gordon FD, Chopra S. AAR predicts cirrhosis in patients with chronic hepatitis C virus infection. Am J Gastroenterol 1998; 93: 44–8. [DOI] [PubMed] [Google Scholar]
- 24.Holmberg H, Kiersgaard MK, Mikkelsen LF, Tranholm M. Impact of blood sampling technique on blood quality and animal welfare in haemophilic mice. Lab Anim 2011; 45: 114–20. [DOI] [PubMed] [Google Scholar]
- 25.Al-Hosni ZS, Al-Khabori M, Al-Mamari S, Al-Qasabi J, Davis H, Al-Lawati H, Al-Riyami AZ. Reproducibility of manual platelet estimation following automated low platelet counts. Oman Med J 2016; 31: 409–13. [DOI] [PMC free article] [PubMed] [Google Scholar]
- 26.Wai CT, Greenson JK, Fontana RJ, Kalbfleisch JD, Marrero JA, Conjeevaram HS, Lok AS. A simple noninvasive index can predict both significant fibrosis and cirrhosis in patients with chronic hepatitis C. Hepatology 2003; 38: 518–26. [DOI] [PubMed] [Google Scholar]
- 27.Vallet-Pichard A, Mallet V, Nalpas B, Verkarre V, Nalpas A, Dhalluin-Venier V, Fontaine H, Pol S. FIB-4: an inexpensive and accurate marker of fibrosis in HCV infection. comparison with liver biopsy and fibrotest. Hepatology 2007; 46: 32–6. [DOI] [PubMed] [Google Scholar]
- 28.Forns X, Ampurdanès S, Llovet JM, Aponte J, Quintó L, Martínez-Bauer E, Bruguera M, Sánchez-Tapias JM, Rodés J. Identification of chronic hepatitis C patients without hepatic fibrosis by a simple predictive model. Hepatology 2002; 36: 986–92. [DOI] [PubMed] [Google Scholar]
- 29.Bakhshoude B, Ravari H, Kazemzadeh GH, Rad MP. Diagnostic value of computerized tomography venography in detecting stenosis and occlusion of subclavian vein and superior vena in chronic renal failure patients. Electron Physician 2016; 8: 2781–6. [DOI] [PMC free article] [PubMed] [Google Scholar]
- 30.De Ritis F, Coltorti M, Giusti G. An enzymic test for the diagnosis of viral hepatitis: the transaminase serum activities. Clin Chim Acta 1957; 2: 70–4. [DOI] [PubMed] [Google Scholar]
- 31.Lin ZH, Xin YN, Dong QJ, Wang Q, Jiang XJ, Zhan SH, Sun Y, Xuan SY. Performance of the aspartate aminotransferase-to-platelet ratio index for the staging of hepatitis C-related fibrosis: an updated meta-analysis. Hepatology 2011; 53: 726–36. [DOI] [PubMed] [Google Scholar]
- 32.Merli M, Galli L, Castagna A, Salpietro S, Gianotti N, Messina E, Poli A, Morsica G, Bagaglio S, Cernuschi M, Bigoloni A, Uberti-Foppa C, Lazzarin A, Hasson H. Diagnostic accuracy of APRI, FIB-4 and Forns for the detection of liver cirrhosis in HIV/HCV-coinfected patients. New Microbiol 2016; 39: 110–3. [PubMed] [Google Scholar]
- 33.Sterling RK, Lissen E, Clumeck N, Sola R, Correa MC, Montaner JS, Sulkowski M, Torriani FJ, Dieterich DT, Thomas DL, Messinger D, Nelson M. APRICOT Clinical Investigators. Development of a simple noninvasive index to predict significant fibrosis in patients with HIV/HCV coinfection. Hepatology 2006; 43: 1317–25. [DOI] [PubMed] [Google Scholar]
- 34.Chou R, Wasson N. Blood tests to diagnose fibrosis or cirrhosis in patients with chronic hepatitis C virus infection: a systematic review. Ann Intern Med 2013; 158: 807–20. [DOI] [PubMed] [Google Scholar]