Significance
Congenital hearing loss is a common disorder, and over 60 mutations in the sensory hair cell protein otoferlin have been linked to hearing loss. Although otoferlin is essential for hearing, the large size and low solubility of the protein have limited approaches to study the protein and prevented a molecular-level explanation for otoferlin-related forms of deafness. To overcome these challenges, we have developed a single-molecule fluorescence assay, which has allowed us to quantitatively probe otoferlin. The results of our studies suggest that otoferlin serves as a calcium-sensitive linker protein that places the synaptic vesicle near the calcium channel. This close apposition allows for fast membrane fusion and exocytosis of neurotransmitter in response to sound.
Keywords: exocytosis, membrane fusion, calcium, otoferlin, calcium channel
Abstract
Sensory hair cells rely on otoferlin as the calcium sensor for exocytosis and encoding of sound preferentially over the neuronal calcium sensor synaptotagmin. Although it is established that synaptotagmin cannot rescue the otoferlin KO phenotype, the large size and low solubility of otoferlin have prohibited direct biochemical comparisons that could establish functional differences between these two proteins. To address this challenge, we have developed a single-molecule colocalization binding titration assay (smCoBRA) that can quantitatively characterize full-length otoferlin from mammalian cell lysate. Using smCoBRA, we found that, although both otoferlin and synaptotagmin bind membrane fusion SNARE proteins, only otoferlin interacts with the L-type calcium channel Cav1.3, showing a significant difference between the synaptic proteins. Furthermore, otoferlin was found capable of interacting with multiple SNARE and Cav1.3 proteins simultaneously, forming a heterooligomer complex. We also found that a deafness-causing missense mutation in otoferlin attenuates binding between otoferlin and Cav1.3, suggesting that deficiencies in this interaction may form the basis for otoferlin-related hearing loss. Based on our results, we propose a model in which otoferlin acts as a calcium-sensitive scaffolding protein, localizing SNARE proteins proximal to the calcium channel so as to synchronize calcium influx with membrane fusion. Our findings also provide a molecular-level explanation for the observation that synaptotagmin and otoferlin are not functionally redundant. This study also validates a generally applicable methodology for quantitatively characterizing large, multivalent membrane proteins.
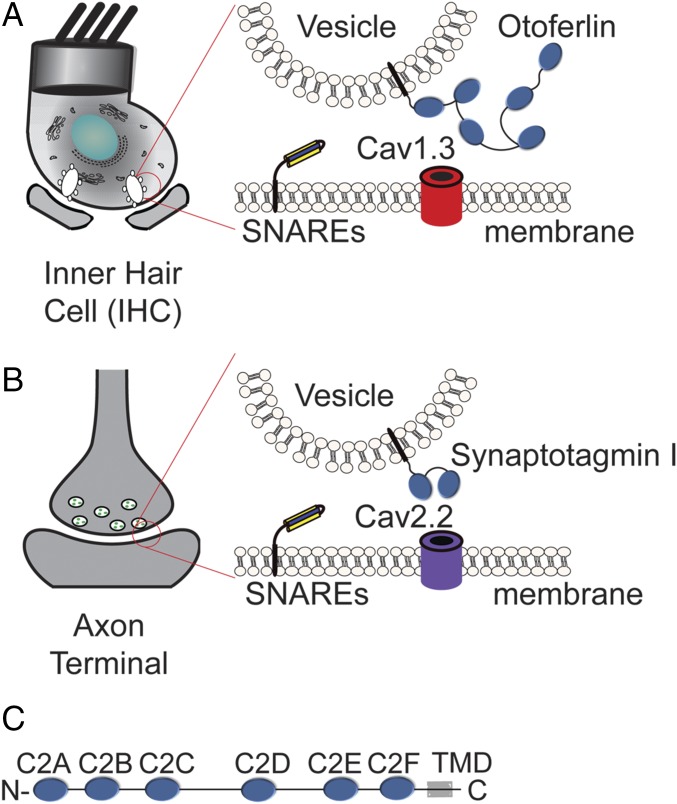
Sensory hair cells encode sound by converting mechanical motion into chemical signals. Hair cell synapses accommodate this unique functional demand via a set of adaptations that distinguish it from neuronal synapses, including reliance on the L-type calcium channel Cav1.3 in place of the P- and N-type calcium channels found at most neuronal synapses (Fig. 1 A and B) (1–6). During maturation, hair cells also cease expression of the two C2 domain protein synaptotagmin I, which serves as the calcium sensor for neurotransmitter release at neuronal synapses (7). Although lacking synaptotagmin, mature hair cells express the six C2 domain protein otoferlin, which is proposed to function as the calcium sensor for exocytosis in mature sound-encoding synapses (8). In agreement with this belief, KO studies have linked otoferlin to sensory hair cell exocytosis, and in vitro studies on otoferlin have concluded that several C2 domains bind SNARE proteins and stimulate membrane fusion in a calcium-sensitive manner (2, 8–10). However, a recent cell-based study concluded that synaptotagmin cannot rescue the otoferlin KO phenotype, arguing against a simple functional redundancy between these C2 domain proteins (11). The functional differences between synaptotagmin and otoferlin are unclear, however, because of the large size and low solubility of full-length otoferlin, which has prohibited direct comparisons between synaptotagmin and otoferlin. In addition, contradicting conclusions using truncated forms of otoferlin indicate that the activities of the individual domains may not fully recapitulate the activity of the whole protein (12). A means of functionally characterizing the full-length otoferlin protein as well as conducting more in-depth comparative studies between otoferlin and synaptotagmin would be beneficial to our understanding of the differences between vesicle trafficking events at the synapses of hair cells and neurons.
Fig. 1.
Schematic of sensory hair cell and neuronal presynapses. (A) Synaptic ribbons within the sensory hair cells of the cochlea position synaptic vesicles proximal to the presynaptic membrane. Otoferlin resides on synaptic vesicles, whereas Cav1.3 localizes to the presynapse. (B) The synaptic vesicles of neurons typically harbor synaptotagmin I/II and an N- or P-type calcium channel (Cav2.1 or Cav2.2). (C) Diagram of otoferlin depicting six C2 domains, labeled C2A–C2F, and the transmembrane domain (TMD).
To address this challenge, we have developed a single-molecule colocalization binding titration assay (smCoBRA) that can quantitatively characterize the entire cytoplasmic region of otoferlin enriched from mammalian cell lysate. Using smCoBRA, we find that both otoferlin and synaptotagmin bind SNARE proteins, with a single otoferlin interacting with up to four SNARE proteins simultaneously. In addition, otoferlin could interact with as many as four Cav1.3. By contrast, synaptotagmin did not interact with Cav1.3, highlighting a functional difference between these C2 domain proteins. We also found that otoferlin could interact with both SNARE and Cav1.3 simultaneously, forming a heterooligomer complex, and that physiologically relevant calcium concentrations alter both the stoichiometry and affinity. Based on our results, we propose a model in which otoferlin, but not synaptotagmin, acts as a calcium-sensitive scaffolding protein that localizes SNARE proteins proximal to the Cav1.3 calcium channel so as to synchronize calcium influx with membrane fusion.
Results
Multiple Cav1.3 Proteins Bind to Otoferlin Simultaneously.
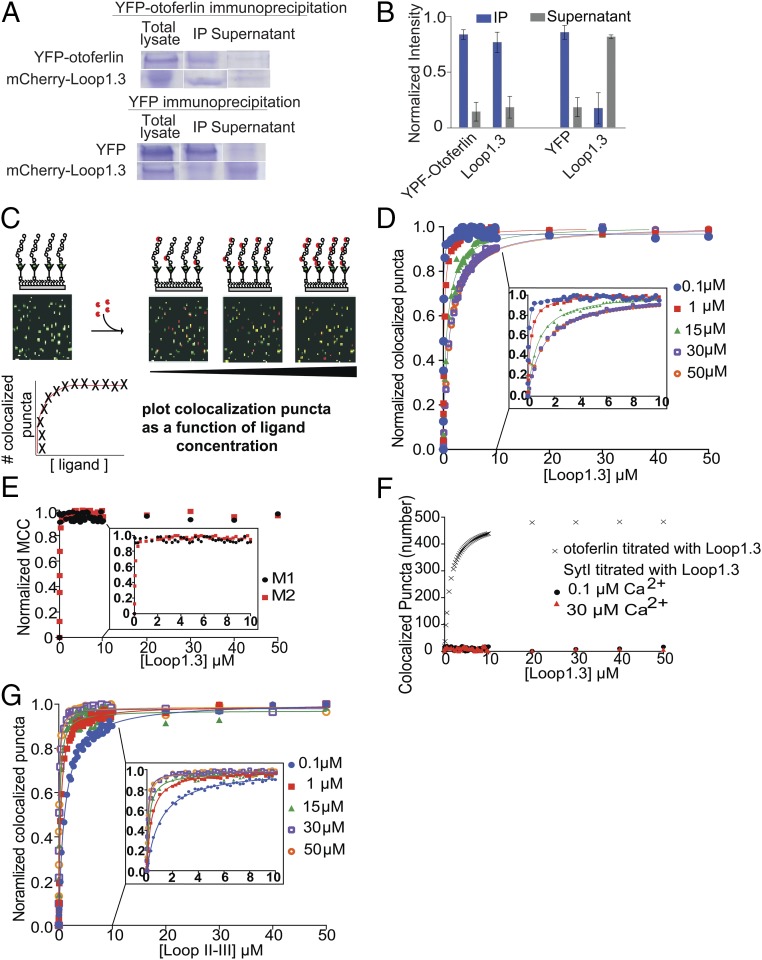
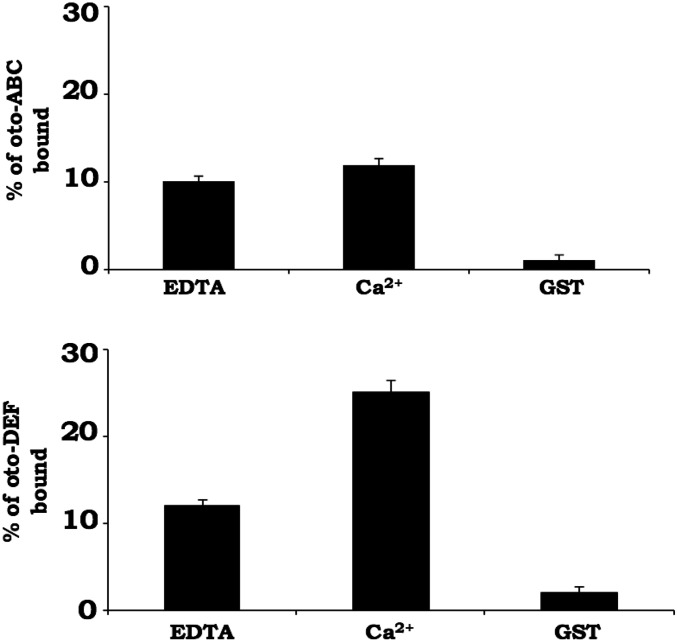
A recently reported yeast two-hybrid screen suggested that otoferlin may interact with a cytoplasmic loop located between domains II and III of Cav1.3 composed of amino acids 752–891(referred to as Loop1.3) (2). To establish whether otoferlin interacts with Loop1.3, we conducted an immunoprecipitation assay using lysate from HEK293 cells cotransfected with mCherry-Loop1.3 and a YFP-otoferlin (otoferlin amino acids 1–1,885) using an anti-YFP antibody. After first verifying by Western blot that the antiotoferlin antibody specifically immunoprecipitated otoferlin, we subsequently probed immunoprecipitated samples and found that mCherry-Loop1.3 coimmunoprecipitated with YFP-otoferlin (Fig. 2 A and B). By contrast, mCherry-Loop1.3 did not immunoprecipitate in samples lacking YFP-otoferlin. Furthermore, immunoprecipitation of YFP from cells cotransfected with YFP and mCherry-Loop1.3 did not coimmunoprecipitate mCherry-Loop1.3 (Fig. 2 A and B). We also tested for otoferlin–Loop1.3 interaction using a GST pulldown assay with otoferlin constructs composed of either the first three C2 domains (C2ABC) or the last three domains (C2DEF). When tested, GST-Loop1.3 was found to bind to both otoferlin constructs, whereas GST alone did not interact with either otoferlin construct (Fig. S1). Based on these results, we conclude that otoferlin specifically interacts with the cytoplasmic loop of Cav1.3.
Fig. 2.
Otoferlin interacts with Loop1.3. (A, Upper) Representative SDS/PAGE showing results of immunoprecipitation of otoferlin from lysate of HEK293 cells cotransfected with YFP-otoferlin and mCherry-Loop1.3. Both otoferlin and Loop1.3 precipitate. (A, Lower) Representative SDS/PAGE showing results of immunoprecipitation of YFP from lysate of HEK293 cotransfected with YFP and mCherry-Loop1.3. YFP but not Loop1.3 precipitates. IP, immunoprecipitated pellet; total lysate, lysate before immunoprecipitation. (B) Quantitation of coimmunoprecipitation showing the fraction of each protein in the IP and supernatant (n = 3 biological replicates; error = SE). (C) Cartoon depicting smCoBRA. Titration of a fluorescently labeled ligand onto immobilized YFP-otoferlin results in colocalized fluorescent puncta. The resulting saturation curve is fitted to obtain a dissociation constant Kd. (D) Dose–response for YFP-otoferlin titrated with Loop1.3 at increasing concentrations (0.1–50 µM) of free calcium. Each data point represents the mean of three biological replicates (n = 3). Experimental data are fit with a Langmuir isotherm (solid lines). Inset depicts 0–10 µM for clarity. (E) Determined Mander’s colocalization coefficients M1 (black) and M2 (red) for a dose–response of Loop1.3 titrated onto YFP-otoferlin (0.1 µM calcium). Inset depicts 0–10 µM. (F) Dose–response for immobilized synaptotagmin I titrated with Loop1.3 in the presence of 0.1 or 30 μM calcium (n = 3). Colocalization between Loop1.3 and YFP-otoferlin is included for comparison. (G) Dose–response for immobilized synaptotagmin I titrated with the loop II–III region of Cav2.2 in in the presence of 0.1–50 μM calcium (n = 3). Inset depicts 0–10 µM for clarity. MCC, Mander's correlation coefficients.
Fig. S1.
Loop1.3 interacts with regions of the N and C termini of otoferlin. Bead-immobilized GST-Loop1.3 cosedimented with recombinant forms of otoferlin composed of the first three C2 domains (C2ABC; Upper) or the last three domains (C2DEF; Lower). Bead-immobilized GST served as a control. Results represent the mean of three sample preparations (n = 3). Error = SEM.
Single-Molecule Studies of the Otoferlin–Loop1.3 Interaction.
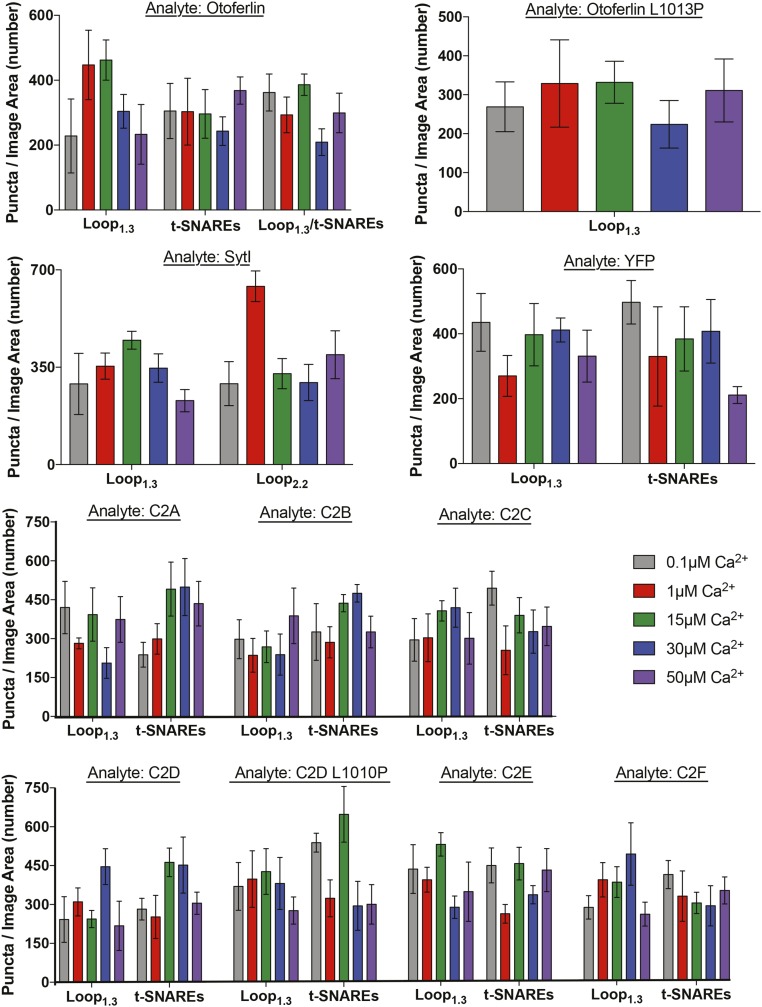
Although requiring low amounts of sample, coimmunoprecipitation assays and GST pulldowns cannot provide accurate affinity or stoichiometric binding information. By contrast, other more quantitative techniques require prohibitively high sample concentrations. To overcome these challenges, we developed a total internal reflection fluorescence microscopy (TIRFM)-based single-molecule colocalization binding titration method that we applied to quantitatively probe the interaction between Loop1.3 and YFP-otoferlin derived from transfected HEK293 cells. As depicted in Fig. 2C, the design principle involves immobilizing YFP-otoferlin onto a glass coverslip using a YFP antibody conjugated to a PEG-biotin surface (13, 14). This immobilization scheme orients the protein in a biomimetic manner and leaves the protein free to bind ligands. After extensive washing of the surface to remove nonspecifically bound cell lysate components, fluorescent puncta corresponding to YFP-otoferlin were observed, and subsequent stepwise titration of fluorescently tagged Loop1.3 resulted in colocalized puncta because of interaction between otoferlin and Loop1.3. Given that intracellular calcium concentrations in sensory hair cells can vary from less than 1 to over 30 µM, we conducted Loop1.3 titrations in the presence of 0.1, 1, 15, 30, and 50 µM free calcium. Incubation times adequate for reaching equilibrium were given for each concentration tested as determined by an invariant number of colocalized puncta over time at a given concentration. When titrated, an increasing number of colocalized Loop1.3-otoferlin puncta were observed that reached a maximum percentage colocalization at Loop1.3 concentrations of 10 µM (Fig. 2D). At this concentration, >90% of the YFP-otoferlin puncta colocalized with Loop1.3 (Fig. S2). The resulting colocalization data were fit to a Langmuir isotherm equation, and the best fit of the data indicates a 30-fold change in the Kd value (from 0.04 ± 0.02 to 1.14 ± 0.07 µM) when the free calcium concentration increased from 0.1 to 50 µM. Colocalization between otoferlin and Loop1.3 was further verified through calculation of Mander’s coefficients, M1 and M2 (Fig. 2E) (15). As expected, M1, which represents the analyte (otoferlin) channel colocalization coefficient, was found to increase over the course of the titrations, whereas M2, which represents the colocalization coefficient for the titrant (Loop1.3), remained at ∼1 and did not significantly change. To ensure that colocalization was not caused by Loop1.3 interaction with YFP, we immobilized YFP at surface densities similar to YFP-otoferlin surface densities (Fig. S3) and titrated Loop1.3. We found no colocalization between Loop1.3 and YFP to the limit of the Loop1.3 concentrations (50 µM) tested.
Fig. S2.
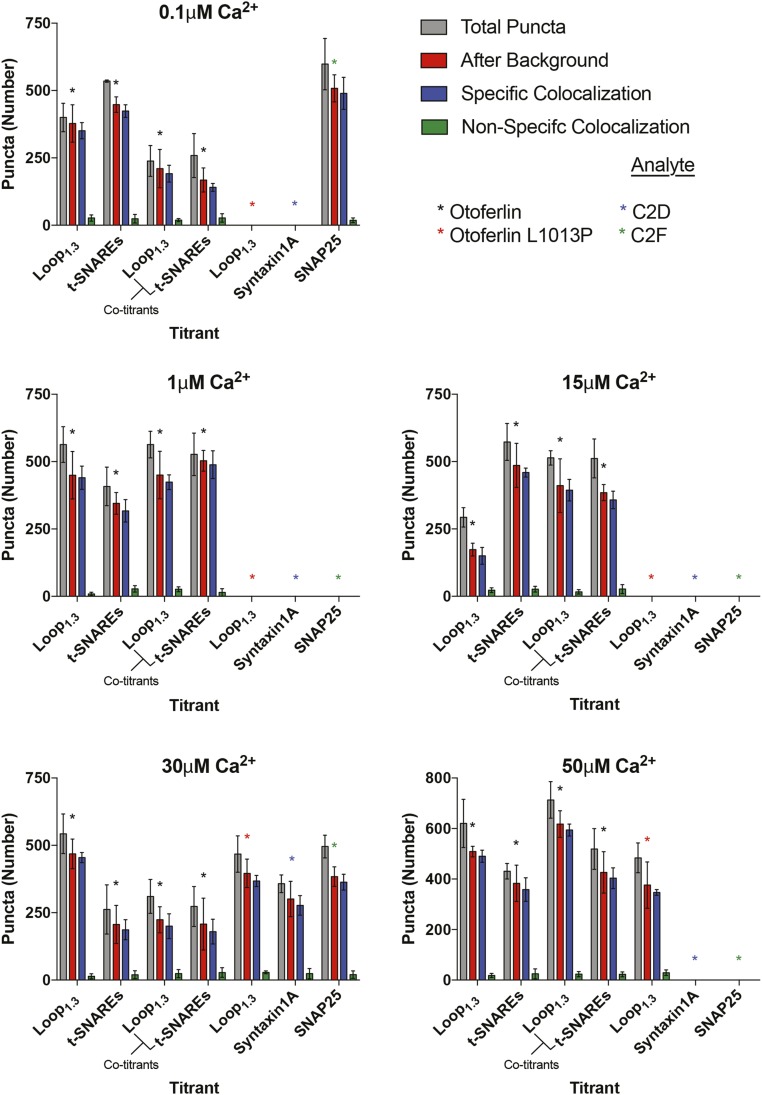
Number of colocalized and noncolocalized titrant puncta. Gray and red bars represent the numbers of puncta before and after background subtraction, respectively. Blue bars represent specific colocalized puncta after background subtraction, and green bars represent the number of Loop1.3 or t-SNARE puncta that do not colocalize with the immobilized YFP-tagged protein after background subtraction. Cotitrants represent puncta numbers from results shown in Fig. 7. Data represent mean and SEM from three separate coverslip samples (n = 3).
Fig. S3.
Mean number of immobilized analytes per viewing area. Error represents SEM from three separate coverslip samples (n = 3).
Synaptotagmin Does Not Interact with the Cytoplasmic Loop of Cav1.3.
At conventional neuronal presynapses, synaptotagmin I binds both the syntaxin1/SNAP-25 neuronal SNARE heterodimer and the intracellular loop connecting domains II and III of N-type calcium channels, serving as a direct link between calcium influx and neurotransmitter release (Fig. 1) (1, 16). This region of N-type channels is analogous to Loop1.3. To test whether synaptotagmin interacts with Loop1.3, we immobilized a recombinant form of synaptotagmin at surface densities similar to those of the otoferlin samples (Fig. S3) and titrated fluorescently labeled Loop1.3 (Fig. 2F). We found that Loop1.3 did not colocalize with synaptotagmin to the limit of the Loop1.3 concentrations tested, regardless of calcium concentration (Fig. 2F). In agreement with previous studies, however, we found that immobilized synaptotagmin did colocalize with the intracellular loop connecting domains II and III of Cav2.2 (Fig. 2G). This interaction was found to be calcium-sensitive, with a Kd of 1.06 ± 0.03 µM at 0.1 µM calcium and 0.10 ± 0.03 µM at 50 µM calcium. Thus, although synaptotagmin binds the loop spanning domains II and III in N-type channels, it does not appear to interact with the loop connecting domains II and III in L-type channels, suggesting that otoferlin and synaptotagmin differ in their calcium channel binding specificity.
Multiple Otoferlin C2 Domains Mediate Interaction with Loop1.3.
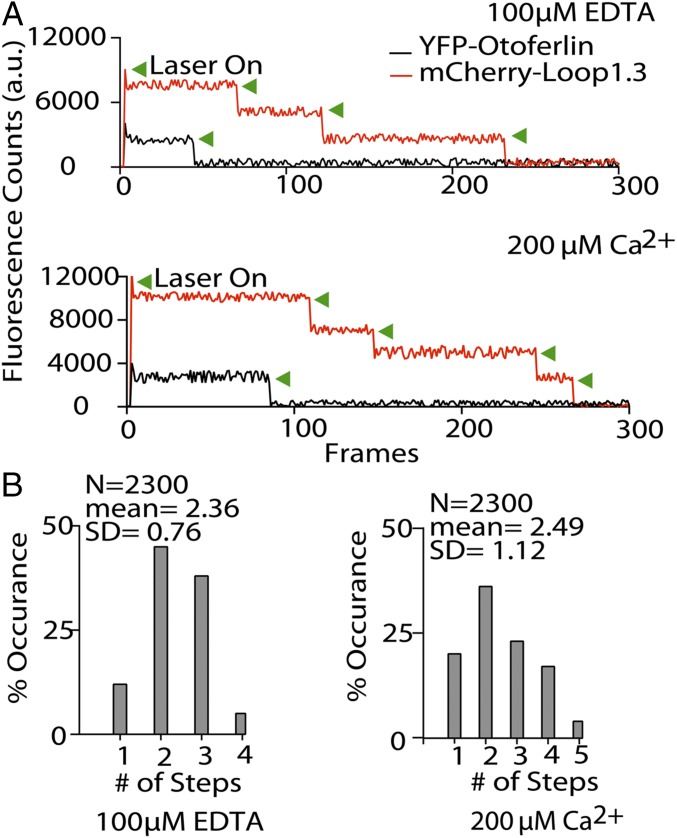
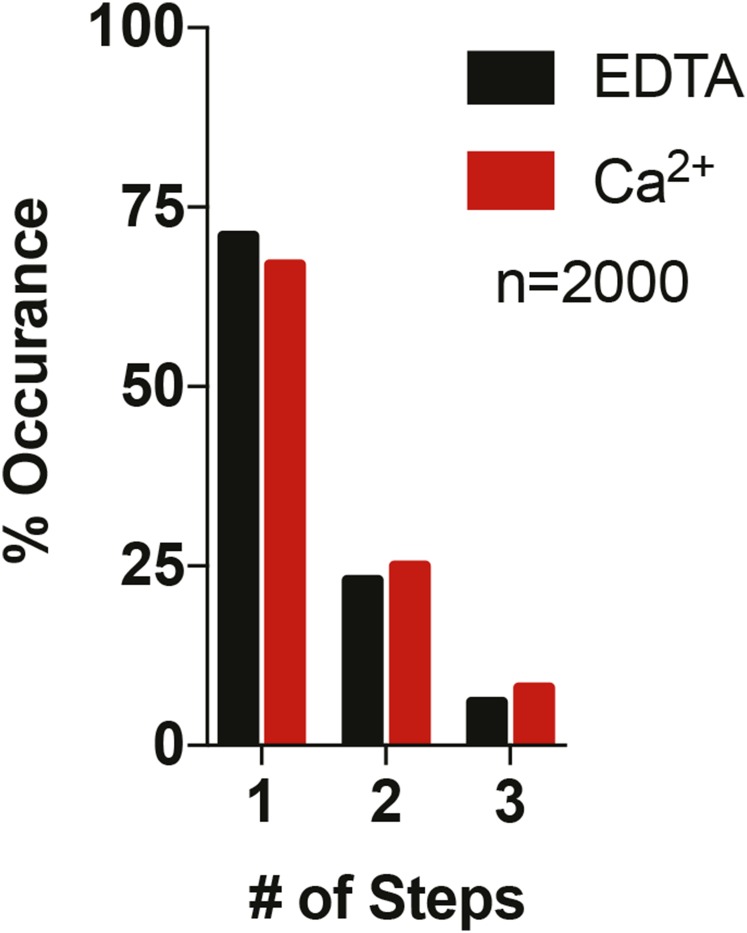
To determine the stoichiometry of the otoferlin–Loop1.3 interaction, we conducted single-molecule photobleaching assays on heteromers composed of YFP-otoferlin complexed with mCherry-Loop1.3 (17). mCherry is thought to be monomeric, and for our studies, we assume that the mCherry is properly folded and mature. We first measured the bleaching of YFP-otoferlin puncta and found that the majority (60%) of the observed YFP-otoferlin bleaching events were single step. However, a small number of two- and three-step bleaching events was detected, which may represent otoferlin oligomers or closely spaced monomers. To simplify interpretation, we choose only puncta with a single YFP-otoferlin bleaching step for study of otoferlin–Loop1.3 stoichiometry. Analysis of otoferlin–Loop1.3 colocalized puncta revealed one, two, and three Loop1.3 bleaching steps for a given single YFP-otoferlin in the presence of 1 mM EDTA (mean steps = 2.36; SD = 0.76; n = 2,300) and an increase in both the number of four-step bleaching events and the mean number of steps (mean steps = 2.49; SD = 1.12; n = 2,300) in the presence of 200 µM free calcium (Fig. 3) (18).
Fig. 3.
Otoferlin binds multiple Loop1.3 molecules. (A) Representative single-molecule photobleaching traces for Loop1.3-mCherry bound to YFP-otoferlin in the presence of 100 µM EDTA (Upper) and 200 µM calcium (Lower). Green arrowheads denote photobleaching events. (B) Single-molecule photobleaching distributions for EDTA and calcium conditions (n = 2,300).
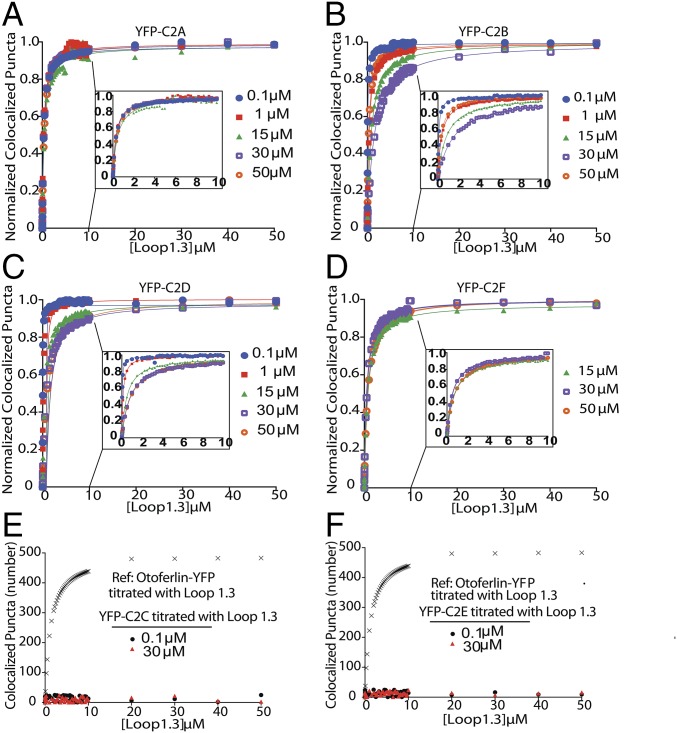
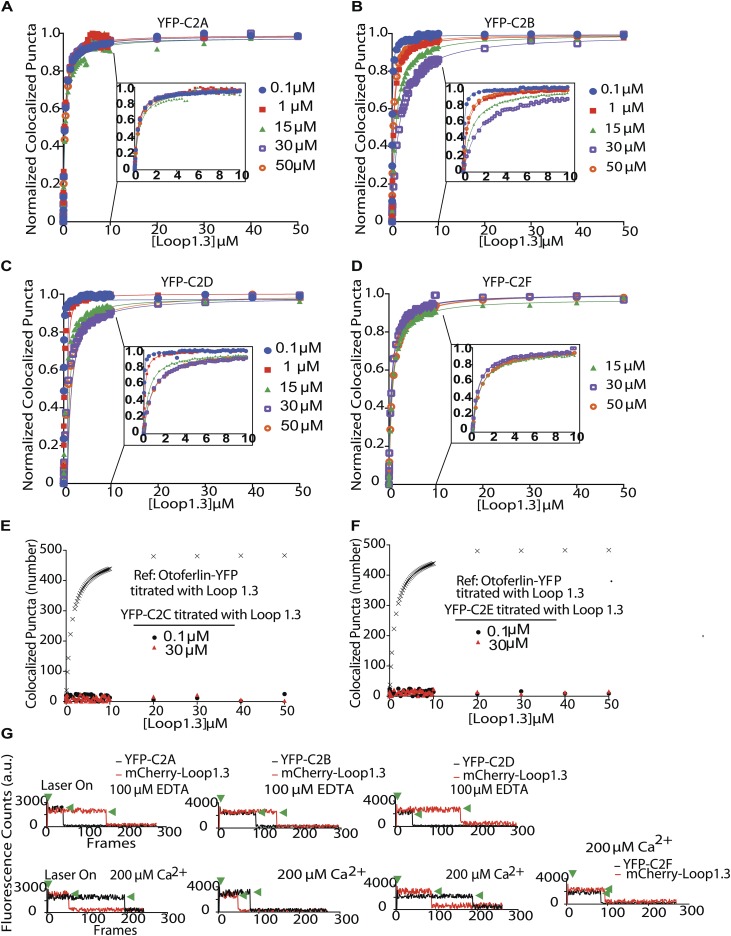
To identify the regions of otoferlin that mediate the interaction with Loop1.3, we repeated the smCoBRA measurements with individual C2 domains of otoferlin fused to YFP (Fig. 4). We found that YFP-tagged C2C and C2E domains did not colocalize with Loop1.3, regardless of Loop1.3 or calcium concentration. However, YFP-conjugated C2A, C2B, and C2D bound Loop1.3 at all calcium concentrations tested (from 0.1 to 50 µM). Interaction between the C2F domain and Loop1.3-mCherry was only detected in the presence of calcium concentration above 1 µM (Fig. 4D). To determine the stoichiometry of individual C2 domain–Loop1.3 interactions, we conducted single-molecule photobleaching assays on YFP-C2 domain and Loop1.3-mCherry complexes. Analysis of colocalized puncta revealed a single calcium-independent Loop1.3-mCherry bleaching step per single YFP-C2 domain for C2A, C2B, and C2D and a single calcium-dependent bleaching step for C2F, corroborating our observations of four Loop1.3 bleaching steps with the longer otoferlin construct. We conclude that four C2 domains can interact with Loop1.3, with the C2F domain interacting with Loop1.3 in a calcium-sensitive manner.
Fig. 4.
Multiple C2 domains mediate otoferlin–Loop1.3 interaction. (A–D) Binding curves for immobilized YFP-otoferlin C2A (A), C2B (B), C2D (C), and C2F (D) domains titrated against Loop1.3 at 0.1–50 µM free calcium. Data are fit with a Langmuir isotherm (solid lines). Insets depict 0–10 µM for clarity. Each experimental data point represents the mean value of n = 3. (E and F) Binding curves for immobilized YFP-otoferlin C2C and C2E domains titrated against Loop1.3. Colocalization between Loop1.3 and YFP-otoferlin (otoferlin amino acids 1–1,885) is included for comparison.
Otoferlin Can Bind Loop1.3 and SNAREs Simultaneously.
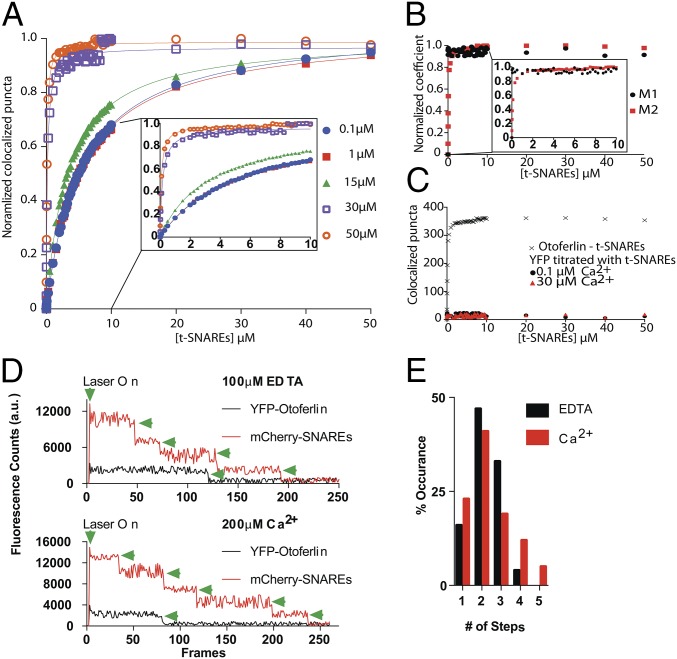
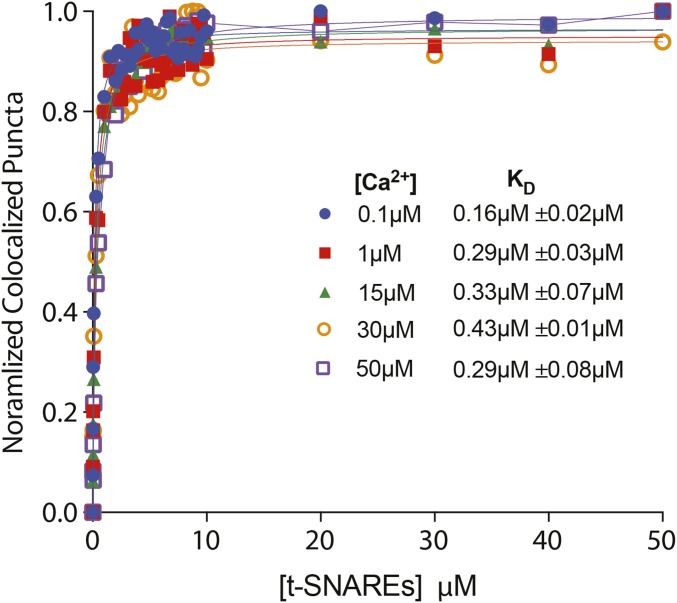
At neuronal presynapses, synaptotagmin I binds the syntaxin1/SNAP-25 neuronal soluble NSF attachment protein receptor (t-SNARE) heterodimer and functions as a calcium sensor for neurotransmitter release (1, 19). Although it is not completely clear which SNAREs drive exocytosis in sensory hair cells, previous studies have shown that the individual C2 domains of otoferlin bind the t-SNARE heterodimer (2, 9). However, no study has tested whether full-length otoferlin can bind multiple t-SNARE heterodimers or whether otoferlin can bind Loop1.3 and SNAREs simultaneously. To address this gap in our knowledge, we first verified the otoferlin–SNARE interaction using smCoBRA. When tested, a fluorescently labeled t-SNARE heterodimer colocalized with surface-immobilized YFP-otoferlin. Binding was determined to be calcium-sensitive, with an apparent Kd of 5.27 ± 0.04 µM at 0.1 µM and 0.17 ± 0.02 µM at 30 µM free calcium based on the best fit to a Langmuir equation (Fig. 5A). Colocalization between otoferlin and the SNARE heterodimer was validated by calculation of Mander’s coefficients M1 and M2 (Fig. 5B). No significant colocalization was observed between SNARE heterodimer and surface-immobilized YFP, despite similar densities to YFP-otoferlin (Fig. 5C), suggesting that otoferlin mediates the interaction with the SNARE heterodimer. Analysis of photobleaching measurements on otoferlin–SNARE complexes indicates that one otoferlin interacts with multiple t-SNAREs (Fig. 5 D and E). We also tested for synaptotagmin–t-SNARE interaction and found that, in agreement with previous studies, immobilized synaptotagmin bound t-SNAREs with an affinity of 0.29 µM at 50 µM calcium (Fig. S4), similar to the submicromolar affinity reported previously (20).
Fig. 5.
Otoferlin binds t-SNAREs. t-SNARE binding curve in the presence of increasing free calcium concentrations (0.1–50 µM). (A) Experimental data are fit with a Langmuir isotherm (solid lines).Each experimental data point represents the mean value of n = 3. Inset depicts 0–10 μM for clarity. (B) Mander’s coefficients M1 (black) and M2 (red) for YFP-otoferlin–t-SNARE colocalization. Inset depicts 0–10 μM for clarity. (C) Titration of t-SNARE with immobilized YFP in the presence of 0.1 or 30 µM free calcium. Each experimental data point represents the mean value of n = 3. (D) Representative single-molecule photobleaching traces for mCherry–t-SNARE bound to YFP-otoferlin in the presence of 100 µM ethylenediaminetetraacetic acid (EDTA) (Upper) and 200 µM calcium (Lower). Green arrowheads denote photobleaching events. a.u., arbitrary units. (E) Single-molecule photobleaching distributions for EDTA and calcium conditions (n = 2,300).
Fig. S4.
Binding curves for immobilized synaptotagmin I titrated with t-SNARE dimer at indicated calcium concentration. Each experimental data point represents the mean value of n = 3 sample preparations.
Fig. S5.
Multiple C2 domains mediate otoferlin–Loop1.3 interaction. Binding curves for YFP-otoferlin C2A (A), C2B (B), C2D (C), and C2F (D) domains titrated with Loop1.3 at indicated calcium concentrations. Insets in A–D depict 0–10 µM for clarity. Each experimental data point represents the mean value of n = 3 sample preparations. (E and F) Dose–response for immobilized YFP-C2C and YFP-C2E I titrated with Loop1.3 in the presence of 0.1 or 30 μM calcium (n = 3). Colocalization between Loop1.3 and YFP-otoferlin is included for comparison. (G) Representative single-molecule photobleaching traces for Loop1.3 bound to YFP-otoferlin C2A, C2B, C2D, and C2F domains in the presence of 100 μM EDTA (Top) or 200 μM free calcium (Bottom).
To determine the C2 domains of otoferlin responsible for the observed otoferlin–SNARE interaction, the SNARE heterodimer was titrated against each individual YFP-C2 domain. C2A, C2B, C2C, and C2E were found to colocalize with the t-SNARE heterodimer in a calcium-enhanced manner, whereas the C2F domain colocalized with the heterodimer only in the presence of greater than 1 µM free calcium. Best fits to a Langmuir equation yielded binding constants listed in Table S1.
Table S1.
Determined binding constants for the C2 domains of otoferlin with Loop1.3 or t-SNARE
| Free calcium concentration | C2A | C2B | C2C | C2D | C2E | C2F | ||||||
| Loop1.3 (μM) | SNAREs (μM) | Loop1.3 (μM) | SNAREs (μM) | Loop1.3 (μM) | SNAREs (μM) | Loop1.3 (μM) | SNAREs (μM) | Loop1.3 (μM) | SNAREs (μM) | Loop1.3 (μM) | SNAREs (μM) | |
| 0.1 μM Ca2+ | 0.31 ± 0.03 | 0.56 ± 0.06 | 0.07 ± 0.01 | 1.19 ± 0.01 | — | 1.04 ± 0.04 | 0.03 ± 0.02 | — | — | 1.17 ± 0.01 | — | — |
| 1 μM Ca2+ | 0.28 ± 0.02 | 0.57 ± 0.07 | 0.35 ± 0.04 | 1.00 ± 0.01 | — | 1.24 ± 0.01 | 0.12 ± 0.02 | — | — | 1.09 ± 0.01 | — | 1.79 ± 0.03 |
| 15 μM Ca2+ | 0.44 ± 0.03 | 0.46 ± 0.01 | 0.80 ± 0.01 | 0.09 ± 0.02 | — | 0.66 ± 0.01 | 0.50 ± 0.08 | — | — | 0.49 ± 0.09 | 0.75 ± 0.01 | 0.83 ± 0.01 |
| 30 μM Ca2+ | 0.31 ± 0.04 | 0.46 ± 0.02 | 1.51 ± 0.03 | 0.07 ± 0.01 | — | 0.10 ± 0.01 | 0.88 ± 0.02 | — | — | 0.30 ± 0.07 | 0.51 ± 0.01 | 0.05 ± 0.02 |
| 50 μM Ca2+ | 0.38 ± 0.04 | 0.59 ± 0.02 | 0.29 ± 0.03 | 0.07 ± 0.01 | — | 0.15 ± 0.05 | 0.90 ± 0.08 | — | — | 0.09 ± 0.01 | 0.74 ± 0.05 | 0.04 ± 0.02 |
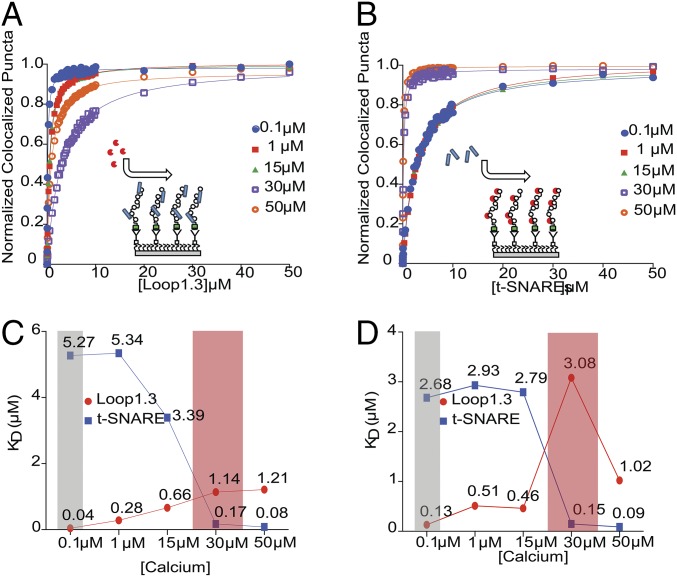
Although traditional techniques, including isothermal titration calorimetry and fluorescence anisotropy, can quantitatively characterize interactions in two-component systems, these techniques are not well-suited to measure three-component interactions. The ability to visualize three-color colocalization with smCoBRA distinguishes itself from these more traditional assays, and having established that otoferlin directly interacts with t-SNAREs and Loop1.3, we next sought to determine if binding occurs simultaneously or competitively through three-color colocalization. To test for simultaneous binding, we titrated Alexa647-Loop1.3 onto complexes composed of immobilized YFP-otoferlin bound to Alexa405 t-SNAREs (Fig. 6A). Alternatively, we titrated the t-SNARE heterodimer onto complexes composed of immobilized otoferlin bound to Loop1.3 (Fig. 6B). To ease interpretation, the titrations were conducted with a constant concentration of the ligand that composed the starting complex at near-saturating levels (2 µM Loop1.3 during t-SNARE titrations and 2 µM t-SNARE during Loop1.3 titrations). Regardless of the order, we found that Loop1.3/otoferlin/SNARE complexes could be formed in a dose-dependent manner as determined by colocalization of three distinct fluorophores, indicating that Loop1.3 and SNAREs can bind otoferlin simultaneously. Colocalization was validated by determination of Mander’s colocalization coefficients (Fig. S6). To test for calcium sensitivity, titrations were conducted at several calcium concentrations (0.1–50 µM), and the best fit parameters are reported in Table S2. No colocalization was detected when Alexa647-Loop1.3 was titrated onto samples containing immobilized Alexa405–t-SNARE, indicating that Loop1.3 does not interact with t-SNAREs. Fig. 6 shows a comparison of the dissociation constants for ligand binding separately (Fig. 6C) or simultaneously to otoferlin (Fig. 6D) as a function of calcium.
Fig. 6.
Titration of Loop1.3 or t-SNARE onto heteromeric complexes. (A) Titration of Loop1.3 with immobilized t-SNARE–YFP-otoferlin complexes at indicated calcium concentration (0.1–50 µM). (B) Titration of t-SNARE with immobilized Loop1.3-YFP-otoferlin complexes at indicated calcium concentration (0.1–50 µM). (C) Dissociation constants for YFP-otoferlin binding to either t-SNARE or Loop1.3 individually plotted as a function of calcium. (D) Dissociation constants for YFP-otoferlin heteromeric complex binding to t-SNARE or Loop1.3 plotted as a function of calcium. The shaded gray and red areas represent the calcium concentration ranges of hair cell synapses during inactive and active states, respectively.
Fig. S6.
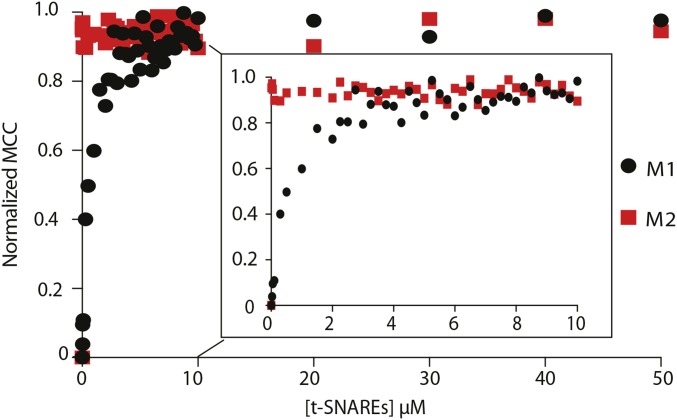
Mander’s colocalization coefficients associated with Fig. 7. M1 (black) represents the fraction of analyte prebound complex (otoferlin with t-SNARE dimer) colocalized with the titrant (Loop1.3). Colocalization coefficient M2 (red) represents the fraction of Loop1.3 titrant colocalized with the analyte prebound complex. Results depicted are in the presence of 1 μM calcium. Normalized MCC refers to the normalized Mander's correlation coefficient. Inset depicts 0–10 μM for clarity.
Table S2.
Determined binding constants for otoferlin
| Free calcium concentration | Otoferlin | Synaptotagmin I WT separate titrations | ||||||
| WT separate titrations | WT heterocomplex titrations | L1010P separate titrations | ||||||
| Loop1.3 (μM) | SNAREs (μM) | Loop1.3 (μM) | SNAREs (μM) | Loop1.3 (μM) | SNAREs (μM) | Loop1.3 (μM) | Loop2.2 (μM) | |
| 0.1 μM Ca2+ | 0.04 ± 0.02 | 5.27 ± 0.03 | 0.13 ± 0.03 | 2.68 ± 0.06 | — | — | — | 1.06 ± 0.03 |
| 1 μM Ca2+ | 0.28 ± 0.01 | 5.34 ± 0.05 | 0.51 ± 0.06 | 2.93 ± 0.02 | — | — | — | 0.37 ± 0.01 |
| 15 μM Ca2+ | 0.66 ± 0.02 | 3.39 ± 0.03 | 0.46 ± 0.05 | 2.79 ± 0.02 | — | — | — | 0.15 ± 0.02 |
| 30 μM Ca2+ | 1.14 ± 0.07 | 0.17 ± 0.01 | 3.08 ± 0.05 | 0.15 ± 0.04 | — | 10.15 ± 0.12 | — | 0.07 ± 0.04 |
| 50 μM Ca2+ | 1.21 ± 0.08 | 0.08 ± 0.02 | 1.02 ± 0.02 | 0.09 ± 0.01 | 5.20 ± 0.05 | 7.32 ± 0.07 | — | 0.10 ± 0.03 |
The Otoferlin L1011P Pathogenic Point Mutation Abrogates Binding Between C2D and Loop1.3.
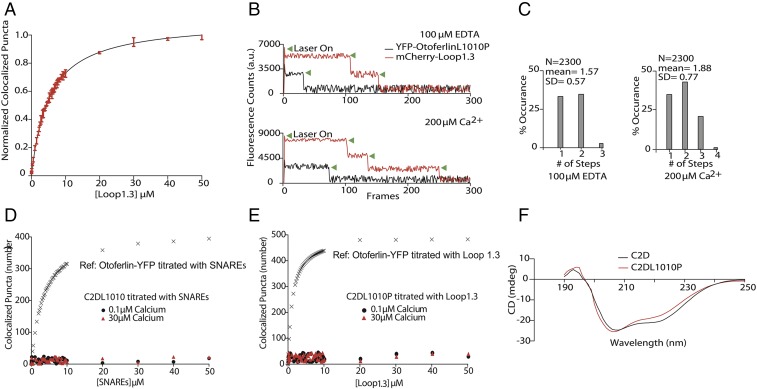
Mutations in otoferlin that prevent neurotransmitter release from sensory hair cells result in a form of nonsyndromic hearing loss known as DFNB9 (21, 22). One such pathogenic mutation in humans is L1011P in the C2D domain (L1010P in mouse), which has recently been shown to diminish binding to Loop1.3 (2). To better understand how this mutation affects otoferlin and further test smCoBRA, we used site-directed mutagenesis to introduce the L1010P point mutation into our YFP-otoferlin construct (otoferlinL1010P). We found that immobilized otoferlinL1010p required greater concentrations of mCherry-Loop1.3 to reach saturation and bound with diminished affinity relative to WT otoferlin (Fig. 7A; Kd values are listed in Table S2), despite immobilization surfaces densities similar to WT YFP-otoferlin (Fig. S3). In addition, the mean number of mCherry-Loop1.3 photobleaching steps was reduced in the mutant compared with the WT in EDTA (WT mean = 2.36; SD = 0.76; otoferlinL1010p mean = 1.57; SD = 0.57; P < 0.01) and 200 µM free calcium (WT mean = 2.49; SD = 1.12; otoferlinL1010p mean = 1.88; SD = 0.77; P < 0.01) (Fig. 7 B and C). We also found that samples composed of otoferlinL1010P–t-SNARE complexes had a reduction in the mean number of t-SNARE photobleaching events, indicating that the mutation attenuates SNARE binding (Fig. S7).
Fig. 7.
The pathogenic mutation L1010 reduces otoferlin–Loop1.3 interaction. (A) Titration curve of Loop1.3 with immobilized YFP-otoferlinL1010P in 50 μM free calcium. (B) Representative photobleaching time course for colocalized YFP-otoferlinL1010P-mCherry-Loop1.3 puncta. Green arrowheads represent individual bleaching steps. (C) Photobleaching distributions for YFP-otoferlinL1010P-mCherry-Loop1.3 puncta in EDTA and calcium (n =2,300 puncta). (D) Dose–response for immobilized YFP-C2DL1010P titrated with t-SNAREs in the presence of 0.1 or 30 μM calcium (n = 3). Colocalization between t-SNAREs and YFP-otoferlin is included for comparison. (E) Dose–response for immobilized YFP-C2DL1010P titrated with Loop1.3 in the presence of 0.1 or 30 μM calcium (n = 3). Colocalization between Loop1.3 and YFP-otoferlin is included for comparison. (F) CD spectrum for WT C2D and C2DL1010P.
Fig. S7.
Single-molecule photobleaching distribution for t-SNAREs–mCherry bound to YFP-otoferlinL1010P in the presence of 100 μM EDTA and 200 μM free calcium.
The loss in binding affinity and reduction in stoichiometry suggest that the L1010P mutation abrogates the C2D–Loop1.3 interaction. We, therefore, tested a single C2D domain mutant YFP-C2DL1010P for interaction with Loop1.3 or t-SNAREs. When tested, we found that the point mutation abrogated colocalization of the C2D domain with both the Loop1.3 and the t-SNARE heterodimer (Fig. 7, D and E). Lastly, to test whether the L1010P mutation resulted in loss of structure, we collected CD spectra of WT and C2DL1010P constructs (Fig. 7F). Both spectra displayed a minimum between 200 and 210 nm.
Discussion
Otoferlin plays an essential role as a calcium-sensitive regulator of exocytosis in sensory hair cells; however, the mechanism of otoferlin activity is currently unknown. The results of our studies indicate that otoferlin is a multivalent protein capable of binding multiple copies of the cytoplasmic loop of Cav1.3 and SNARE proteins simultaneously (Fig. 6). This interaction seem to be mediated by the C2 domains of otoferlin. Previous studies that we have conducted showed that the C2 domains of otoferlin bind calcium and phosphatidylinositol 4,5-bisphosphate [PI(4,5)P2] lipids (9, 10, 23, 24). We, therefore, propose a model where vesicle-associated otoferlin acts as a scaffolding protein that first targets the presynaptic membrane via interaction with PI(4,5)P2 and subsequently interacts with calcium channels and membrane fusion machinery (one or more SNARE isoforms). The linking of the synaptic vesicle, presynaptic calcium channel, and membrane fusion proteins in close spatial proximity would reduce the “reaction space” and increase the fidelity and precision of exocytosis in response to presynaptic calcium influx. Our observation that multiple C2 domains interact with Cav1.3 suggests that some C2 domains may be somewhat functionally redundant. Indeed, it was reported that exogenous truncated forms of otoferlin lacking one or more C2 domains could rescue balance and startle reflex in zebrafish lacking endogenous otoferlin (25). This observation may be explained if the truncated otoferlin constructs retained at least one C2 domain capable of binding Cav1.3.
We found that the neuronal synaptic calcium sensor synaptotagmin I interacted with the loop II–III region (synprint) of Cav2.2, in agreement with previous reports (Fig. 2G). Unexpectedly, however, synaptotagmin I did not interact with the loop II–III (Loop1.3) region of Cav1.3 (Fig. 2F). The loop II–III region of voltage-gated calcium channels is thought to contribute to exo- and endocytotic processes through direct interaction with synaptic proteins. We speculate that the inability of synaptotagmin I to rescue the otoferlin KO phenotype may be caused by the loss of interaction between Cav1.3 and the synaptic vesicle calcium sensor. Another important distinction between otoferlin and synaptotagmin is that the synaptotagmin–Cav2.2 interaction is reported to be mediated solely by the C2B domain in a 1:1 ratio, whereas multiple otoferlin C2 domains can interact with the II–III loop region of Cav1.3 (Fig. 4). Although it is thought that otoferlin does not influence channel activity, the characteristics of exocytosis proximal to the channel may be influenced by the biophysical properties of a given C2 domain and how many domains are bound to channels. In our studies, we also found that calcium increased the binding affinity of synaptotagmin for the loop region of Cav2.2, whereas calcium decreased slightly but significantly the affinity between otoferlin and Loop1.3.
In characterizing otoferlin, we developed the smCoBRA method, which quantitatively characterizes multicomponent heteromeric complexes. This method both allows for measurement of the multivalence, stoichiometry, and binding affinities of large multidomain proteins and is compatible with the small amounts of protein produced from mammalian cell culture. A distinguishing capability of smCoBRA is the ability to colocalize three fluorescently conjugated proteins simultaneously, titrate one of the proteins onto a complex of the other two, and obtain dissociation constants. smCoBRA is generally applicable and therefore, a viable method to interrogate proteins that are not obtainable at high concentrations.
Materials and Methods
SI Materials and Methods includes plasmid constructs, cell culture, transfection procedure, coimmunoprecipitation assay, GST pulldown, total internal reflection microscopy (TIRF) photobleaching, single-molecule titration assay, and CD protocols.
SI Materials and Methods
Plasmid Constructs.
Mouse otoferlin was provided as a gift from Christine Petit, Institut Pasteur, Paris. Otoferlin amino acids 1–1,885 were amplified via PCR from a PCDNA3 vector and subcloned into the HindIII and BamHI sites of the CKAR vector acquired from Addgene (plasmid 14860). Amino acids 752–891 of mouse Cav1.3, corresponding to Loop1.3, were amplified and subcloned into pGEX6p3 (GE Healthcare BioSciences) using restriction sites BamHI and XhoI. Similarly, mCherry-Loop1.3 was created by first subcloning mCherry plus a 30-nt 3′ linker, supplied by Addgene (plasmid 29722), into CKAR via HindIII and KpnI sites and then subsequently subcloning Loop1.3 amino acids 752–891 into the KpnI and XbaI sites via PCR. All constructs were confirmed using DNA sequencing.
Protein Purification and Fluorescent Labeling.
Both recombinant Loop1.3 and Loop1.3-mCherry were expressed similarly at 18 °C overnight in BL21(DE3) cells after being induced with β-d-1-thiogalactopyranoside (IPTG) at OD600 = 0.6. The cells were sonicated on 50% duty cycle for 3 min in Hepes (50 mM Hepes, pH 7.5, 150 mM NaCl), 1 mM PMSF, 1 mM Aprotinin, 1 mM Leupetin, and 0.5% Triton X-100. After centrifugation at 9,000 × g for 20 min at 4 °C, the soluble lysate was incubated for 1 h in GST resin at 4 °C with rotation. Fractions were eluted from the resin using Hepes supplemented with 200 mM reduced glutathione after being washed twice with wash buffer containing Hepes and 2 mM reduced glutathione. The eluted volume was dialyzed overnight at 4 °C in Hepes followed by GST tag cleavage at 4 °C for 2 h with PreScission Protease (GE Healthcare BioSciences) per the manufacturer’s instructions. Loop1.3 was collected as flow-through after incubation with GST beads for 1 h at 4 °C with rocking. The A280 concentration of the protein was measured using a Nanodrop 2000 UV-Vis Spectrophotometer (Thermo) and a predicted extinction coefficient of 2,980 M−1 cm−1. AlexaFluor568 or Alexa647 conjugation to Loop1.3, Alexa405 conjugation to the t-SNARE, and Alexa647 conjugation to synaptotagmin were conducted as described previously and directed by the product instructions (Life Technologies) (24). Degree of labeling was determined as directed by the product instructions. Excess dye was removed via PD-10 desalting columns (GE Healthcare BioSciences), and all fractions were assayed for purity using SDS/PAGE. Pure fractions were stored in small aliquots at −80 °C.
Cell Culture and Transfection.
HEK293 cells were grown in DMEM supplemented with 10% FBS and Pen Strep (5,000 U/mL and 5,000 μg/mL, respectively) and incubated at 37 °C with 5% CO2. Cells were cultured to 90% confluence (visually verified) before being transfected with 1 μg of YFP-otoferlin or Loop1.3-mCherry vector. Cells were transfected with calcium chloride in the presence of 50 mM N,N-bis[2-hydroxyethyl]-2-aminoethanesulfonic acid (BES), 280 mM NaCl, and 1.5 mM Na2HPO4. Cells were harvested 72 h posttransfection by scraping the culture dish in buffer containing PBS, pH 7.5, 2% octylglucoside, and a protease inhibitor mixture (Roche). The cells were then sonicated for 2 min in 10-s intervals. Soluble protein was recovered via centrifugation at 9,000 × g for 15 min at 4 °C. For coimmunoprecipitation, the lysis buffer lacked octylglucoside and included 50 mM Hepes, 120 mM NaCl, 1% Nonidet P-40, 1 mM EDTA, and a protease inhibitor mixture.
Coimmunoprecipitation.
Protein A/G MagBeads (GeneScript) were equilibrated in PBS, pH 7.5, and conjugated to 1 μg of anti-GFP antibody (Abcam) by rotational mixing for 1 h at room temperature. Beads were washed once with PBS to remove excess antibody and washed twice with 0.2 M triethanolamine, pH 8.2. Beads were resuspended in 20 mM dimetyl pimelimidate dihydrochloride in 0.2 M triethanolamine, pH 8.2, and rotated for 30 min at room temperature. To terminate the antibody cross-linking reaction, the beads were suspended in 50 mM Tris⋅HCl, pH 7.5, and again rotated at room temperature for 30 min. Beads were subsequently washed three times in PBS, pH 7.5. HEK293 cell lysate from one T75 transfected with YFP-otoferlin and mCherry-Loop1.3 was added and left to rotate overnight at 4 °C. The reaction was washed twice in PBS, pH 7.5, to remove nonspecific binding before the beads were suspended in nonreducing sample buffer and incubated at 90 °C for 5 min. Samples were briefly spun down and analyzed using SDS/PAGE.
GST Pulldown.
The PGEX6P3 containing GST, GST-Loop1.3, and pMCSG9 vectors containing the otoferlin C2ABC and C2DEF domains were transformed into BL21 Escherichia coli cells. The bacterial culture (OD600 = 0.6) was induced for 12 h at 18 °C with 1 mM IPTG. Cells were pelleted at 4,000 rpm and resuspended in lysis buffer containing 40 mM Hepes, pH 7.5, 200 mM NaCl, and 1 mM DTT. The cells were lysed by sonication in lysis buffer containing protease inhibitors (1 mM PMSF, 1–2 μg/mL aprotinin, leupeptin, pepstatin A). The soluble fraction of GST and GST-Cav 1.3 II–III loop lysate was incubated with Glutathione resin for 2 h at 4 °C, and the resin was washed with lysis buffer before the bound protein was eluted with elution buffer containing 40 mM Hepes, pH 7.5, 200 mM NaCl, and 1 and 200 mM reduced glutathione. While MBP-C2ABC and MBP-C2DEF domains of otoferlin lysate were incubated with nickel-nitrilotriacetic acid (Ni-NTA) resin for 2 h at 4 °C, the resin was washed with lysis buffer and then eluted with elution buffer containing 40 mM Hepes, pH 7.5, 200 mM NaCl, 1 mM DTT, and 500 mM Imidazole. Purified proteins were extensively dialyzed in buffer containing 40 mM Hepes, pH 7.5, 200 mM NaCl, and 1 mM DTT and concentrated using an Ultrafree-10 centrifugal filter unit (Pall Corporation). Protein concentrations were determined by UV absorbance at 280 nm.
The GST-Loop1.3 and GST protein were incubated with Glutathione-Sepharose beads (50 µL of a 50% slurry) for 1 h at 4 °C and washed with lysis buffer (40 mM Hepes, pH 7.5, 150 mM NaCl, 1 mM DTT, protease inhibitor mixture). Then, MBP-C2ABC (5 µM) and C2DEF (5 µM) domains were mixed with washed beads of GST and GST-Loop1.3 and incubated for 2 h at 4 °C with either 200 µM EDTA or calcium followed by centrifugation for 2 min at 1,000 × g. The beads were washed three times in the lysis buffer with either 200 µM EDTA or calcium, and the GST-Sepharose beads were heat-denatured at 95 °C for 5 min in SDS sample buffer and analyzed by SDS/PAGE. GST protein was used as a negative control. The amount of MBP-ABC and MBP-DEF domains bound to GST-Loop1.3 loop was quantified by densitometry.
CD.
CD experiments were conducted on a JASCO 715 spectropolarimeter at 25 °C. Before data collection, samples were dialyzed against 10 mM potassium phosphate and 100 mM sodium fluoride buffer, pH 7.4, and then equilibrated at room temperature for 16 h.
TIRF and Photobleaching Measurements.
Coverslips were functionalized with PEG-Biotin. Flow cells were assembled by attaching a functionalized coverslip to glass slides layered with a 0.24-mm double-sided adhesive sheet (Grace Bio-Labs) and epoxy resin. For all TIRF experiments, biotinylated 6xHis, RFP (Abcam), or YFP antibodies were tethered to coverslips via streptavidin. To accomplish this surface chemistry, flow cells were first hydrated in Hepes for 4 min and then successively incubated for 2 min in 0.1 mg/mL streptavidin and 15 nM biotinylated antibody. After rinsing off excess antibody, HEK293 cell lysate containing otoferlin-YFP was incubated in the flow cells for 2 min before being washed with Hepes buffer supplemented with 0.4% glucose, 45 μg/mL catalase, and 0.2 U glucose oxidase (HOXS buffer). For all smCoBRA measurements, titrant dilutions made in HOXS buffer were flowed over the immobilized protein and allowed to incubate inside the flow chamber for 3 min at room temperature before an image was captured. Single- and multiwavelength TIRF imaging was performed using a Zeiss TIRF3 laser system. To reduce fluorescent bleed-through, TIRF filter set 46 (Zeiss) was used for YFP imaging, and filter set 72 was used for mCherry and AlexaFluor568 imaging. During measurements, focus was maintained using definite focus provided by Zen Imaging Software (Zeiss). For single-molecule photobleaching experiments, HOXS buffer was omitted, and images were acquired every insert switching time at 85% laser power, resulting in >90% photobleaching within the range of the TIRF field. Three-color colocalization studies were performed with Alexa405-labeled syntaxin 1/SNAP25 SNAREs, Alexa647-labeled Loop1.3, and otoferlin-YFP.
Analysis of smCoBRA Measurements.
All TIRF images were analyzed using ImageJ software (NIH). Before analysis, the background was subtracted using the standard background subtraction tool. For each concentration, colocalized puncta were validated using Pearson’s coefficient and used to construct a binding saturation curve. Binding affinities, curve fitting, and other statistical analysis were performed using customized Matlab scripts.
Analysis of Photobleaching Measurements.
After background correction, the intensity of the region of interest was calculated frame by frame using ImageJ. Individual photobleaching steps were assigned by visual analysis of graphs representing puncta intensity as a function of time. Total subunit frequencies were fit to both Poisson and binomial distributions.
Acknowledgments
This work was supported by NIH National Institute of Deafness and Other Communication Disorders (NIDCD) Grant 1R01DC014588.
Footnotes
The authors declare no conflict of interest.
This article is a PNAS Direct Submission.
This article contains supporting information online at www.pnas.org/lookup/suppl/doi:10.1073/pnas.1703240114/-/DCSupplemental.
References
- 1.Sheng ZH, Yokoyama CT, Catterall WA. Interaction of the synprint site of N-type Ca2+ channels with the C2B domain of synaptotagmin I. Proc Natl Acad Sci USA. 1997;94:5405–5410. doi: 10.1073/pnas.94.10.5405. [DOI] [PMC free article] [PubMed] [Google Scholar]
- 2.Ramakrishnan NA, Drescher MJ, Drescher DG. Direct interaction of otoferlin with syntaxin 1A, SNAP-25, and the L-type voltage-gated calcium channel Cav1.3. J Biol Chem. 2009;284:1364–1372. doi: 10.1074/jbc.M803605200. [DOI] [PMC free article] [PubMed] [Google Scholar]
- 3.Sheets L, Kindt KS, Nicolson T. Presynaptic CaV1.3 channels regulate synaptic ribbon size and are required for synaptic maintenance in sensory hair cells. J Neurosci. 2012;32:17273–17286. doi: 10.1523/JNEUROSCI.3005-12.2012. [DOI] [PMC free article] [PubMed] [Google Scholar]
- 4.Jing Z, et al. Disruption of the presynaptic cytomatrix protein bassoon degrades ribbon anchorage, multiquantal release, and sound encoding at the hair cell afferent synapse. J Neurosci. 2013;33:4456–4467. doi: 10.1523/JNEUROSCI.3491-12.2013. [DOI] [PMC free article] [PubMed] [Google Scholar]
- 5.Vincent PF, Bouleau Y, Safieddine S, Petit C, Dulon D. Exocytotic machineries of vestibular type I and cochlear ribbon synapses display similar intrinsic otoferlin-dependent Ca2+ sensitivity but a different coupling to Ca2+ channels. J Neurosci. 2014;34:10853–10869. doi: 10.1523/JNEUROSCI.0947-14.2014. [DOI] [PMC free article] [PubMed] [Google Scholar]
- 6.Vincent PF, Bouleau Y, Petit C, Dulon D. A synaptic F-actin network controls otoferlin-dependent exocytosis in auditory inner hair cells. eLife. 2015;4:4. doi: 10.7554/eLife.10988. [DOI] [PMC free article] [PubMed] [Google Scholar]
- 7.Pangršič T, Reisinger E, Moser T. Otoferlin: A multi-C2 domain protein essential for hearing. Trends Neurosci. 2012;35:671–680. doi: 10.1016/j.tins.2012.08.002. [DOI] [PubMed] [Google Scholar]
- 8.Roux I, et al. Otoferlin, defective in a human deafness form, is essential for exocytosis at the auditory ribbon synapse. Cell. 2006;127:277–289. doi: 10.1016/j.cell.2006.08.040. [DOI] [PubMed] [Google Scholar]
- 9.Johnson CP, Chapman ER. Otoferlin is a calcium sensor that directly regulates SNARE-mediated membrane fusion. J Cell Biol. 2010;191:187–197. doi: 10.1083/jcb.201002089. [DOI] [PMC free article] [PubMed] [Google Scholar]
- 10.Padmanarayana M, et al. Characterization of the lipid binding properties of Otoferlin reveals specific interactions between PI(4,5)P2 and the C2C and C2F domains. Biochemistry. 2014;53:5023–5033. doi: 10.1021/bi5004469. [DOI] [PMC free article] [PubMed] [Google Scholar]
- 11.Reisinger E, et al. Probing the functional equivalence of otoferlin and synaptotagmin 1 in exocytosis. J Neurosci. 2011;31:4886–4895. doi: 10.1523/JNEUROSCI.5122-10.2011. [DOI] [PMC free article] [PubMed] [Google Scholar]
- 12.Pangrsic T, et al. Hearing requires otoferlin-dependent efficient replenishment of synaptic vesicles in hair cells. Nat Neurosci. 2010;13:869–876. doi: 10.1038/nn.2578. [DOI] [PubMed] [Google Scholar]
- 13.Jain A, et al. Probing cellular protein complexes using single-molecule pull-down. Nature. 2011;473:484–488. doi: 10.1038/nature10016. [DOI] [PMC free article] [PubMed] [Google Scholar]
- 14.Jain A, Liu R, Xiang YK, Ha T. Single-molecule pull-down for studying protein interactions. Nat Protoc. 2012;7:445–452. doi: 10.1038/nprot.2011.452. [DOI] [PMC free article] [PubMed] [Google Scholar]
- 15.Adler J, Parmryd I. Quantifying colocalization by correlation: The Pearson correlation coefficient is superior to the Mander’s overlap coefficient. Cytometry A. 2010;77:733–742. doi: 10.1002/cyto.a.20896. [DOI] [PubMed] [Google Scholar]
- 16.Chapman ER. How does synaptotagmin trigger neurotransmitter release? Annu Rev Biochem. 2008;77:615–641. doi: 10.1146/annurev.biochem.77.062005.101135. [DOI] [PubMed] [Google Scholar]
- 17.Gordon MP, Ha T, Selvin PR. Single-molecule high-resolution imaging with photobleaching. Proc Natl Acad Sci USA. 2004;101:6462–6465. doi: 10.1073/pnas.0401638101. [DOI] [PMC free article] [PubMed] [Google Scholar]
- 18.Hines KE. Inferring subunit stoichiometry from single molecule photobleaching. J Gen Physiol. 2013;141:737–746. doi: 10.1085/jgp.201310988. [DOI] [PMC free article] [PubMed] [Google Scholar]
- 19.Rickman C, Davletov B. Mechanism of calcium-independent synaptotagmin binding to target SNAREs. J Biol Chem. 2003;278:5501–5504. doi: 10.1074/jbc.C200692200. [DOI] [PubMed] [Google Scholar]
- 20.Zhou A, Brewer KD, Rizo J. Analysis of SNARE complex/synaptotagmin-1 interactions by one-dimensional NMR spectroscopy. Biochemistry. 2013;52:3446–3456. doi: 10.1021/bi400230u. [DOI] [PMC free article] [PubMed] [Google Scholar]
- 21.Yasunaga S, et al. A mutation in OTOF, encoding otoferlin, a FER-1-like protein, causes DFNB9, a nonsyndromic form of deafness. Nat Genet. 1999;21:363–369. doi: 10.1038/7693. [DOI] [PubMed] [Google Scholar]
- 22.Choi BY, et al. Identities and frequencies of mutations of the otoferlin gene (OTOF) causing DFNB9 deafness in Pakistan. Clin Genet. 2009;75:237–243. doi: 10.1111/j.1399-0004.2008.01128.x. [DOI] [PMC free article] [PubMed] [Google Scholar]
- 23.Marty NJ, Holman CL, Abdullah N, Johnson CP. The C2 domains of otoferlin, dysferlin, and myoferlin alter the packing of lipid bilayers. Biochemistry. 2013;52:5585–5592. doi: 10.1021/bi400432f. [DOI] [PMC free article] [PubMed] [Google Scholar]
- 24.Codding SJ, Marty N, Abdullah N, Johnson CP. Dysferlin binds SNAREs (soluble N-ethylmaleimide-sensitive factor (NSF) attachment protein receptors) and stimulates membrane fusion in a calcium-sensitive manner. J Biol Chem. 2016;291:14575–14584. doi: 10.1074/jbc.M116.727016. [DOI] [PMC free article] [PubMed] [Google Scholar]
- 25.Chatterjee P, et al. Otoferlin deficiency in zebrafish results in defects in balance and hearing: Rescue of the balance and hearing phenotype with full-length and truncated forms of mouse otoferlin. Mol Cell Biol. 2015;35:1043–1054. doi: 10.1128/MCB.01439-14. [DOI] [PMC free article] [PubMed] [Google Scholar]


