Significance
Through unknown mechanisms mTORC1 triggers translocation of SREBP-2, an endoplasmic reticulum (ER) resident protein, to the Golgi to produce mature SREBP-2, which translocates to the nucleus to act as a transcription factor. Low ER cholesterol is a well-known inducer of SREBP-2 activation. We thus investigated whether mTORC1 activates SREBP-2 by reducing ER cholesterol levels. We report that, in cultured mammalian cells, an increase in mTORC1 activity is accompanied by a decrease in ER cholesterol and by SREBP-2 activation. Conversely, a decrease in mTORC1 activity coincides with higher ER cholesterol and lower SERBP-2 activity. We demonstrate that, by suppressing autophagy and by maintaining endosomal recycling, mTORC1 actively prevents membrane-derived cholesterol from reaching lysosomes, thereby reducing cholesterol ER and activating SREBP-2.
Keywords: mTORC1, SREBP-2, cholesterol, autophagy, endosomal recycling
Abstract
mTORC1 is known to activate sterol regulatory element-binding proteins (SREBPs) including SREBP-2, a master regulator of cholesterol synthesis. Through incompletely understood mechanisms, activated mTORC1 triggers translocation of SREBP-2, an endoplasmic reticulum (ER) resident protein, to the Golgi where SREBP-2 is cleaved to translocate to the nucleus and activate gene expression for cholesterol synthesis. Low ER cholesterol is a well-established trigger for SREBP-2 activation. We thus investigated whether mTORC1 activates SREBP-2 by reducing cholesterol delivery to the ER. We report here that mTORC1 activation is accompanied by low ER cholesterol and an increase of SREBP-2 activation. Conversely, a decrease in mTORC1 activity coincides with a rise in ER cholesterol and a decrease in SERBP-2 activity. This rise in ER cholesterol is of lysosomal origin: blocking the exit of cholesterol from lysosomes by U18666A or NPC1 siRNA prevents ER cholesterol from increasing and, consequently, SREBP-2 is activated without mTORC1 activation. Furthermore, when mTORC1 activity is low, cholesterol is delivered to lysosomes through two membrane trafficking pathways: autophagy and rerouting of endosomes to lysosomes. Indeed, with dual blockade of both pathways by Atg5−/− and dominant-negative rab5, ER cholesterol fails to increase when mTORC1 activity is low, and SREBP-2 is activated. Conversely, overexpressing constitutively active Atg7, which forces autophagy and raises ER cholesterol even when mTORC1 activity is high, suppresses SREBP-2 activation. We conclude that mTORC1 actively suppresses autophagy and maintains endosomal recycling, thereby preventing endosomes and autophagosomes from reaching lysosomes. This results in a reduction of cholesterol in the ER and activation of SREBP-2.
It is well-established that mTORC1 functions as a nutrient/energy/stress sensor (1). Activated mTORC1 promotes cell growth by inducing anabolic processes while inhibiting catabolic events, such as autophagy (1). For instance, nutrient-rich conditions activate mTORC1 to increase adipogenesis (2), to up-regulate mitochondrial biogenesis in muscle (1), and to promote hepatic lipogenesis by activating sterol regulatory element-binding proteins (SREBPs) (3), the master transcriptional regulators of lipid and sterol biosynthesis. SREBPs consist of three isoforms: 1a, 1c, and 2. SREBP-1a and -2 are the predominant forms in cultured cells. They activate fatty acid and cholesterol synthesis, respectively. SREBP-1c is expressed primarily in the liver, where it is regulated by multiple signals related to nutrient and energy status. With obesity and overnutrition mTORC1 is hyperactivated, resulting in persistent activation of SREBP 1c in the liver (4). This leads to overproduction of lipids and hence hepatic steatosis and hypertriglyceridemia. Furthermore, constitutively activated mTORC1 greatly elevates de novo lipid synthesis (5). mTORC1 also activates SREBPs including SREBP-2 in cultured fibroblasts (6). In these cells, mTORC1 promotes SREBPs translocation from the endoplasmic reticulum (ER) to the Golgi, where SREBP is proteolytically cleaved to translocate to the nucleus and acts as a transcription factor to activate target gene expression (6). SREBP translocation, proteolytic processing, and nuclear entry is also under the control of ER cholesterol levels (7). It is unclear whether and how mTORC1 influences ER cholesterol to regulate SREBPs.
In addition to activating SREBPs, mTORC1 is known to play a key regulatory role in two membrane trafficking events. Low mTORC1 activity triggers autophagy (8) and also reroutes cholesterol-rich endosomes, which are normally recycled (9), to lysosomes (10, 11). From there, amino acids and membrane components, including cholesterol, can be released for reuse. Thus, mTORC1 could influence ER cholesterol through these membrane trafficking events to modulate SREBPs.
Here we present evidence that, when mTORC1 is inactive, autophagosomes and rerouted endosomes are delivered to lysosomes. This results in cholesterol-rich lysosomes and hence an increase in ER cholesterol, which suppresses SREBP-2. Conversely, high mTORC1 activity suppresses autophagy and promotes endosome recycling, so that less membrane cholesterol reaches lysosomes and ER cholesterol is lower. This activates SREBP-2.
Results
Inactivation of mTORC1 Promotes Cholesterol Trafficking to the ER Through Lysosomes.
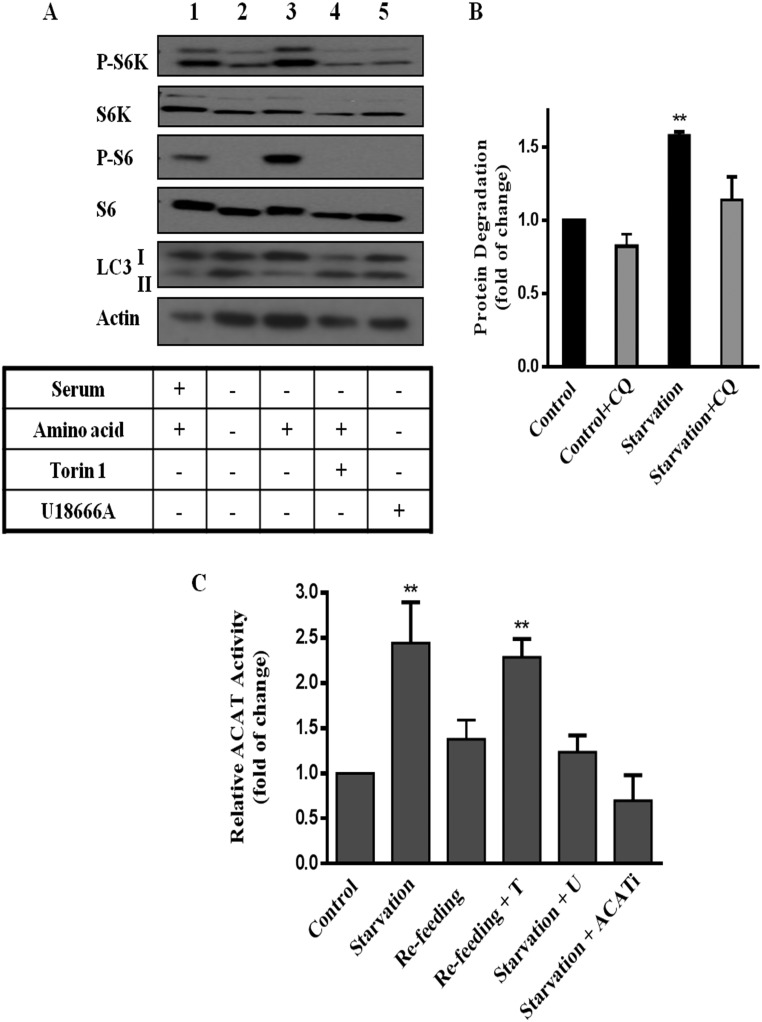
We first established that, in mouse embryonic fibroblasts (MEFs), mTORC1 activity, assessed by P-S6K1 and P-S6, is high in full growth medium with serum (Fig. 1A, lane 1) or in the presence of amino acids (control) (Fig. 1A, lane 3) but diminished in the presence of mTORC1 inhibitor Torin 1 (Fig. 1A, lane 4). Furthermore, 4-h amino acid removal (starvation) lowered mTORC1 activity (Fig. 1A, lane 2), and triggered lysosomal protein degradation (Fig. 1B), a hallmark of autophagy (12, 13). Autophagy is known to deliver membrane-rich organelles and cell debris to lysosomes, which release amino acids and, inevitably, membrane lipids including cholesterol. Because lysosome-derived cholesterol is intimately linked to ER cholesterol (14), we next assessed ER cholesterol by whole-cell ACAT (acyl-CoA cholesterol acyltransferase) activity assay. ACAT is an ER resident enzyme that converts free cholesterol (hereafter referred to as cholesterol) to cholesteryl ester (CE). Its activity (i.e., the amount of CE formed) is generally governed by cholesterol availability in the ER membrane (15). We observed that ACAT activity was elevated by amino acid starvation (Fig. 1C), suggesting high levels of cholesterol in the ER. However, cells with activated mTORC1 [in amino acid-containing medium (control) or in medium resupplied with amino acids for another 4 h after starvation (refeed)] exhibit lower ACAT activity, indicative of low ER cholesterol. However, if mTORC1 activity is blocked by Torin1, ACAT activity is high even with refeeding (Fig. 1C). This suggests mTORC1 plays a direct role to lower ER cholesterol in refeeding.
Fig. 1.
mTORC1 regulates cholesterol trafficking from the lysosomes. (A) MEFs were incubated in serum-containing medium (control) for 4 h (lane 1) or medium without serum and amino acids (starvation) for 4 h (lane 2) or starvation medium plus 1 μM U18666A (lane 5). Some of cells were in starvation medium for 4 h and then switched to medium containing amino acids (refeeding) for 4 h, with or without Torin 1 (250 nM) (lanes 3 and 4). Cells were then lysed, subjected to SDS/PAGE and immunoblotted with indicated antibodies. Data are representative of at least three experiments. (B) MEFs were grown in normal serum medium containing [14C]l-valine for 3 d and then shifted to fresh medium containing 0.1% BSA for 1 h. Cells were then subjected to 4 h incubation with control or starvation medium for 4 h, with or without chloroquine (30 μM). Medium was then collected and analyzed for TCA-soluble [14C]l-valine as described in Materials and Methods. Results are expressed as fold increase of cellular protein degraded in 4 h in starvation medium, relative to that in control medium. Data are the average ± SEM of three independent experiments. (C and D) MEFs were subjected to control or starvation medium for 4 h or starvation 4 h followed by 4 h in refeed medium; [3H]oleate was added to cells during the last 30 min to measure ACAT activity. Results are represented as fold increase of CE formation, relative to cells in control medium. Data are the average ± SEM of three independent experiments. *P < 0.05, **P < 0.005, ***P < 0.0001.
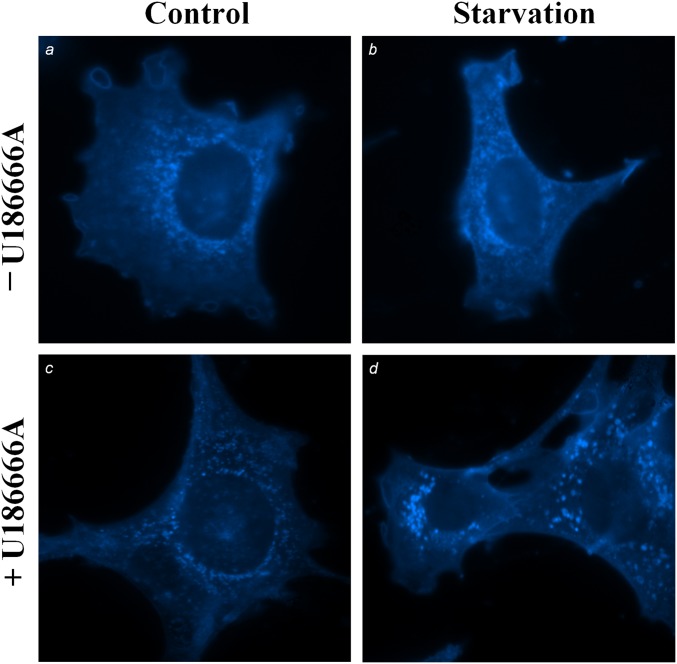
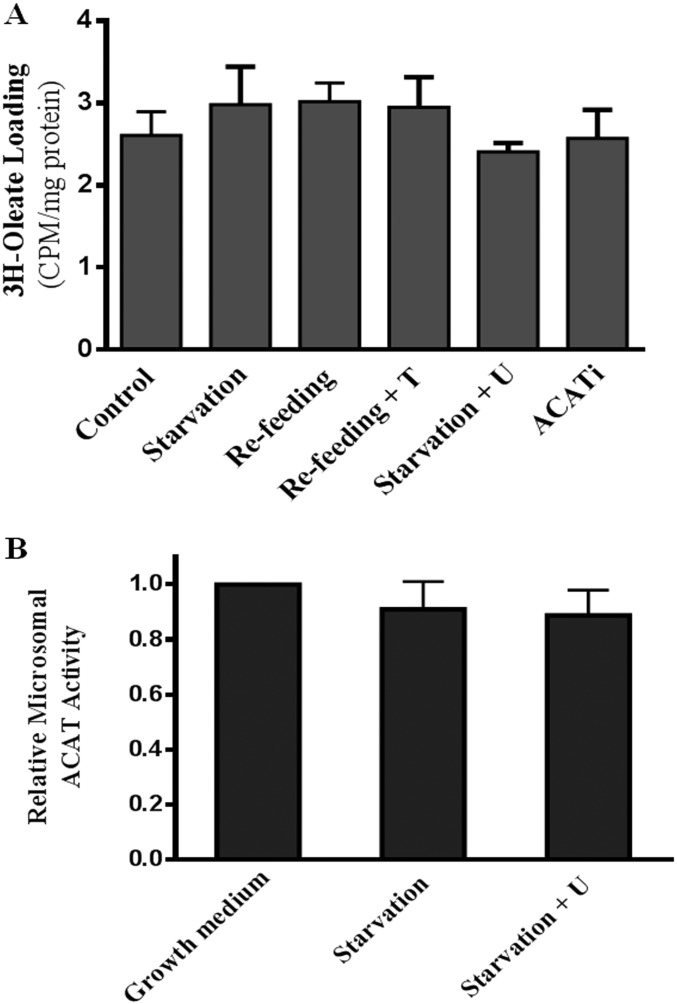
The source of the higher ER cholesterol during starvation is likely the lysosomes: U18666A, which specifically inhibits the exit of cholesterol from lysosomes (16), blocked the increase of ACAT activity during starvation (Fig. 1D). U18666A at the dose used here (1 μM) had no effect on mTORC1 activity (Fig. 1A, lane 5). Indeed, we detected cholesterol accumulation in the lysosomes of cells in starvation medium and in the presence of U18666A (Fig. S1). As expected, specific inhibitor ACATi verified that ACAT is solely responsible for the CE formed during starvation (Fig. 1D). Additionally, the levels of cellular [3H]oleate, which forms [3H]CE with ER cholesterol in the ACAT assay, and ACAT activities in isolated ER membrane (microsome fraction) were identical among cells treated with different nutrient conditions or inhibitors (Fig. S2 A and B). Thus, the changes in whole-cell ACAT activity most likely reflect changes in cholesterol content in the ER membrane and this change in ER cholesterol is related to lysosomal cholesterol release.
Fig. S1.
Cholesterol distribution in MEFs under various nutrient conditions. MEFs were incubated in growth medium (A and C) or starvation medium (B and D), with or without U18666A for 4 h. Cells were then fixed and stained with fillipin.
Fig. S2.
(A) MEFs were treated as in Fig. 1C, [3H]-oleate loading was analyzed by measuring the radioactivity in whole-cell lysates and normalized to the protein content. Data ± are represented as average and STD (n = 3). (B) Microsomal ACAT activity. MEFs were grown for 2 d then starved for 4 h with or without U18666A (1 μM). Cells were then collected and microsomal fractions isolated. ACAT activity was measured as described in Materials and Methods. Results represent the fold increase in enzyme activity relative to cells in control medium. Data are the average ± STD (n = 3).
Similar correlations between mTORC1 activity, protein degradation, and ACAT activity can be seen in HEK cells (Fig. S3 A–C), another mammalian cultured cell line responsive to nutrient conditions (6). Again, U18666A lowered ACAT activity during starvation, Torin 1 maintained high ACAT activity during refeeding, and ACATi blocked CE formation during starvation (Fig. S3C).
Fig. S3.
HEK293T cells were grown and treated as in Fig. 1A. (A) Cells were then lysed and subjected to SDS/PAGE followed by Western blot analysis against indicated antibodies. (B) Rate of turnover of [14C]L-valine–labeled long-lived proteins measured in HEK293T cells as in Fig. 1B. Results are expressed as fold increase of cellular protein degraded in 4 h, relative to cells in control medium. Data represent average of three independent experiments with SEM. (C) ACAT activity was measured in HEK293T cells. Results are represented as fold increases of CE formation, relative to cells in control medium. Data are averages of three independent experiments with SEM. **P < 0.005.
We conclude that starvation not only increases lysosomal protein degradation but also triggers cholesterol release from lysosomes, leading to higher ER cholesterol levels.
mTORC1 Activates SREBP-2 by Inhibiting Cholesterol Trafficking from Lysosome to the ER.
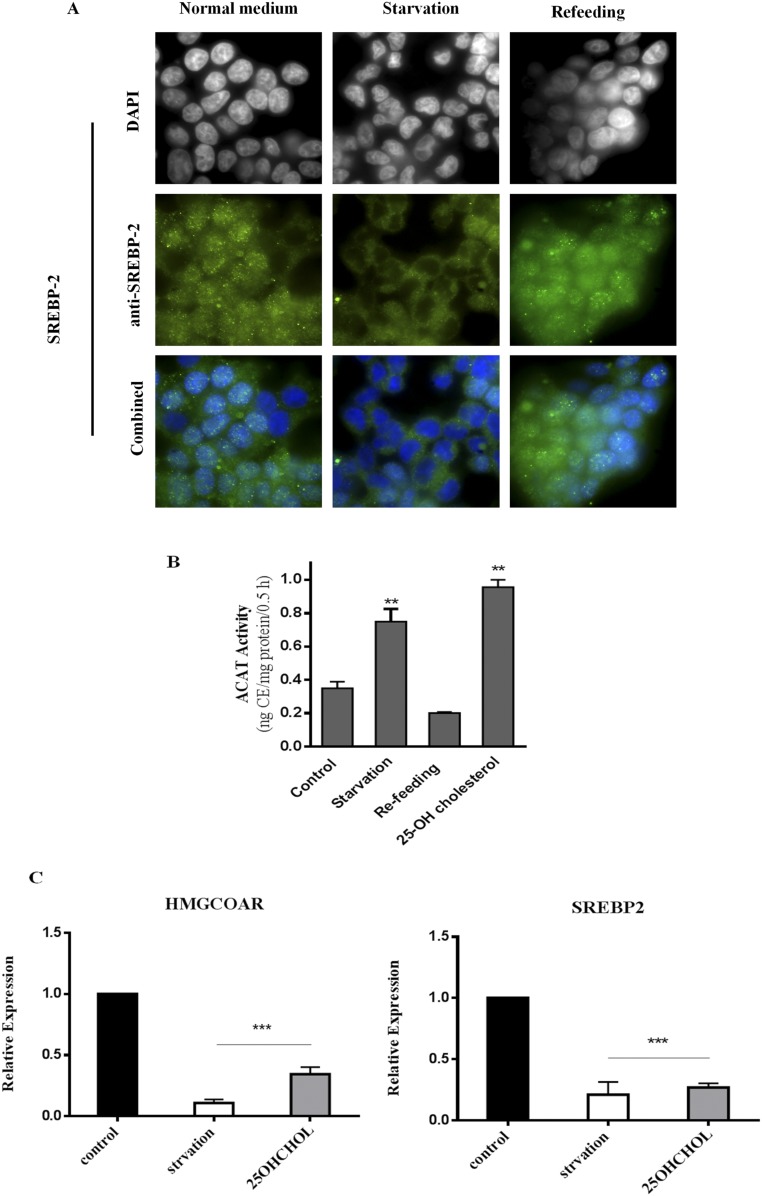
We next established that, in MEFs, this increase in ER cholesterol, during starvation or with mTORC1 inhibition, is of sufficient magnitude to affect SREBP-2. First, as seen by immunofluorescence staining, SREBP-2 is predominantly in the nucleus in normal growth medium or after amino acid refeeding (Fig. S4A, first and third columns), indicating activation. During starvation, however, SREBP-2 is excluded from the nucleus, consistent with its inactivated state (Fig. S4A, middle column). Second, the magnitude of the increase in ACAT activity during starvation is similar to that observed in cells treated with 10 μg/mL 25-hydroxy-cholesterol (25HC) (Fig. S4B); 25HC at this concentration indeed suppressed SREBP-2 activity (Fig. S4C).
Fig. S4.
(A) Immunofluorescence staining of MEFs with anti-SREBP2 (green) and DAPI (blue) under indicated conditions. (B) ACAT activity in MEFs treated with 25-hydroxyl-cholesterol (25-OH CH). Cells were incubated in starvation or starvation/refeeding medium. Parallel dishes were treated with control medium containing 25-OH CH (10 μM) for 4 h. Data represent the average ± STD (n = 3). (C) Relative expression of SREBP-2 target genes in cells treated as above. Data represent the average ± STD (n = 4). **P < 0.005, ***P < 0.0001.
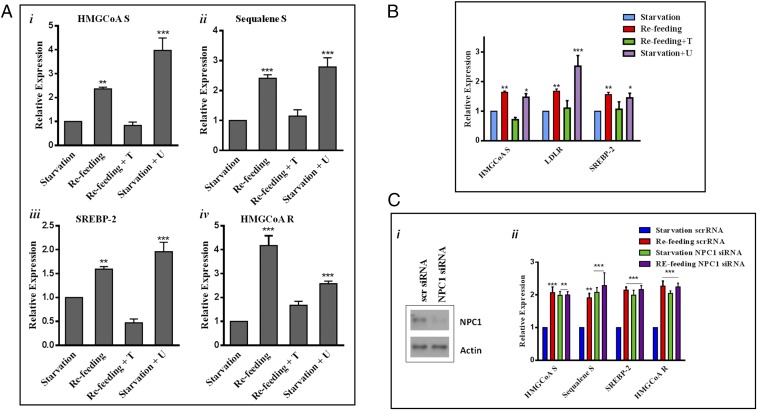
Mature SREBP-2, produced by low ER cholesterol, is expected to enter the nucleus and bind sterol-responsive elements (SRE) in target promoters to initiate transcription of genes involved in cholesterol synthesis (7). We observed that transcriptional expression of HMG-CoA synthetase was low during starvation (Fig. 2 A, i, first bar), when mTORC1 activity is low (Fig. 1A, second lane) and ACAT activity (thus ER cholesterol) is high (Fig. 1C, second bar). Also, as shown in Fig. 1, Torin 1 and U18666A changed ER cholesterol. We reasoned that SREBP-2 transcriptional activity could change accordingly. Consistent with its inhibition of the rise in ER cholesterol, U18666A abrogated the suppression of HMG-CoA synthetase expression by starvation (Fig. 2 A, i, fourth bar). Adding back amino acids (refeeding) increased HMG-CoA synthetase expression (Fig. 2 A, i, second bar) in a manner dependent on mTORC1 activity, as Torin 1 blocked this effect (Fig. 2 A, i, third bar). The regulation of other SBEBP-2–dependent genes followed a similar pattern, including SREBP-2 itself (17) (Fig. 2 A, ii–iv) (primers are listed in Table S1).
Fig. 2.
mTORC1 regulates SREPB-2 transcriptional activity through cholesterol trafficking via lysosomes. (A) Relative expression of SREBP-2 target genes in MEF cells subjected to the conditions indicated. mRNA levels were determined by real‐time qPCR and normalized to 18S mRNA. Data are presented as the fold increase in gene expression relative to cells in starvation medium and represent the average ± SEM of four independent experiments. (B) Relative expression of SREBP-2 genes in HEK293T cells (i–iv). Data are presented as the fold increases in transcription activity relative to cells in starvation medium and represent averages of four independent experiments with SEM. (C, i) Western blotting showing MEFs transfected with either scrambled or NPC1 siRNA. (C, ii) Gene expression, assessed by RT-PCR, in cells transfected with scrambled or NPC1 siRNA. Results show fold increases of transcriptional activity relative to starvation. Data are the average ± SEM from four independent experiments.*P < 0.05, **P < 0.005, ***P < 0.0001.
Table S1.
Primer sequences used for real-time PCR
| Gene name | Species | Sequences for forward and reverse primers (5′–3′) | |
| Forward | Reverse | ||
| HMGCOAS | Mouse | GCCGTGAACTGGGTCGAA | GCATATATAGCAATGTCTCCTGCAA |
| Human | AGCAAGTTTCTTTTCATTTCGAGTATC | GATGTGCTGGACACCAACTTGT | |
| HMGCOAR | Mouse | CTTGTGGAATGCCTTGTGAT | AGCCGAAGCAGCACATGAT |
| Human | GGGAACCTCGGCCTAATGAA | CACCACGCTCATGAGTTTCCA | |
| SREBP2 | Mouse | GCGTTCTGGAGACCATGGA | ACAAAGTTGCTCTGAAAACAAATCA |
| Human | AGGAGAACATGGTGCTGA | TAAAGGAGAGGCACAGGA | |
| LDLR | Human | GTCTTGGCACTGGAACTCGT | CTGGAAATTGCGCTGGAC |
| Squalene synthase | Mouse | CCAACTCAATGGGTCTGTTCCT | TGGCTTAGCAAAGTCTTCCAACT |
| 18S | Mouse | TGACTCAACACGGGAAACCT | AACCAGACAAATCCAC |
| Human | AACCCGTTGAACCCCATT | CCATCCAATCGGTAGTAGCG | |
Significantly, the expression of SREBP-2-targeted genes correlated positively with mTORC1 activity and negatively with ACAT activity (Fig. 2B) in HEK cells, in agreement with observations made in the MEFs.
Also, we observed effects similar to those of U18666A on SREBP-2 target gene expression by silencing NPC1 (Fig. 2 C, i), a protein necessary for cholesterol exit from lysosomes and the pharmacological target of U18666A (18, 19). Because lysosomes cannot release cholesterol without NPC1, starvation no longer suppressed SREBP-2 targeted genes (Fig. 2 C, ii, green bars): Their expression levels were comparable to those of refed cells (Fig. 2 C, ii, purple bars). This again supports the notion that lysosomal-derived cholesterol is crucial for the suppression of SREBP-2 activity to lower the expression of its target genes, when mTORC1 activity is low.
Taking these results together, we conclude that activation of mTORC1 coincides with low ER cholesterol, indicated by ACAT activity, and with activation of SREBP-2. Conversely, suppression of mTORC1, by starvation or pharmacological inhibition, is accompanied by high ER cholesterol, due to increased cholesterol release from lysosomes. This suppresses the transcription of SREBP-2 target genes.
mTORC1 Regulates Autophagy and Endosomal Recycling to Govern Cholesterol Supply to the Lysosomes, Thereby Regulating SREBP-2.
Lysosomes are primarily digestive organelles that degrade macromolecules and cell debris delivered to them via various mechanisms. The products, such as amino acid and cholesterol, are then released for reuse. Given that mTORC1 controls cholesterol availability to ER through lysosomes, mTORC1 may regulate the delivery of cholesterol-containing material to lysosomes. We thus searched for potential sources of cholesterol that can reach lysosomes when mTORC1 activity is low.
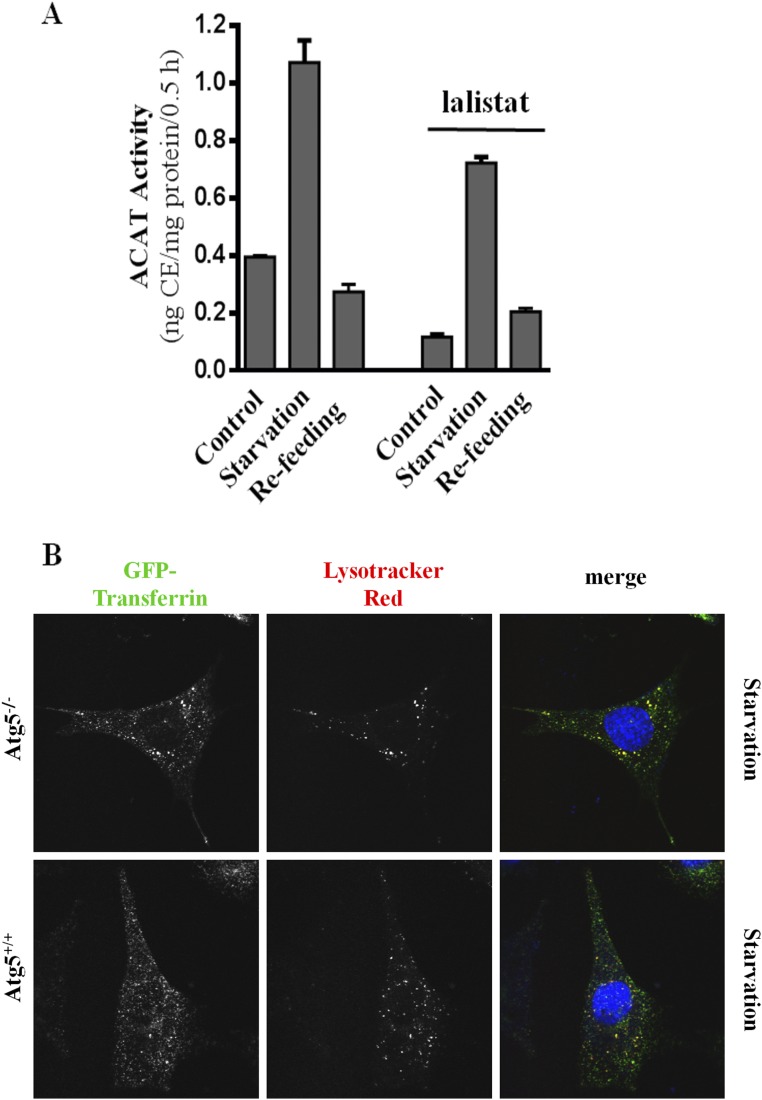
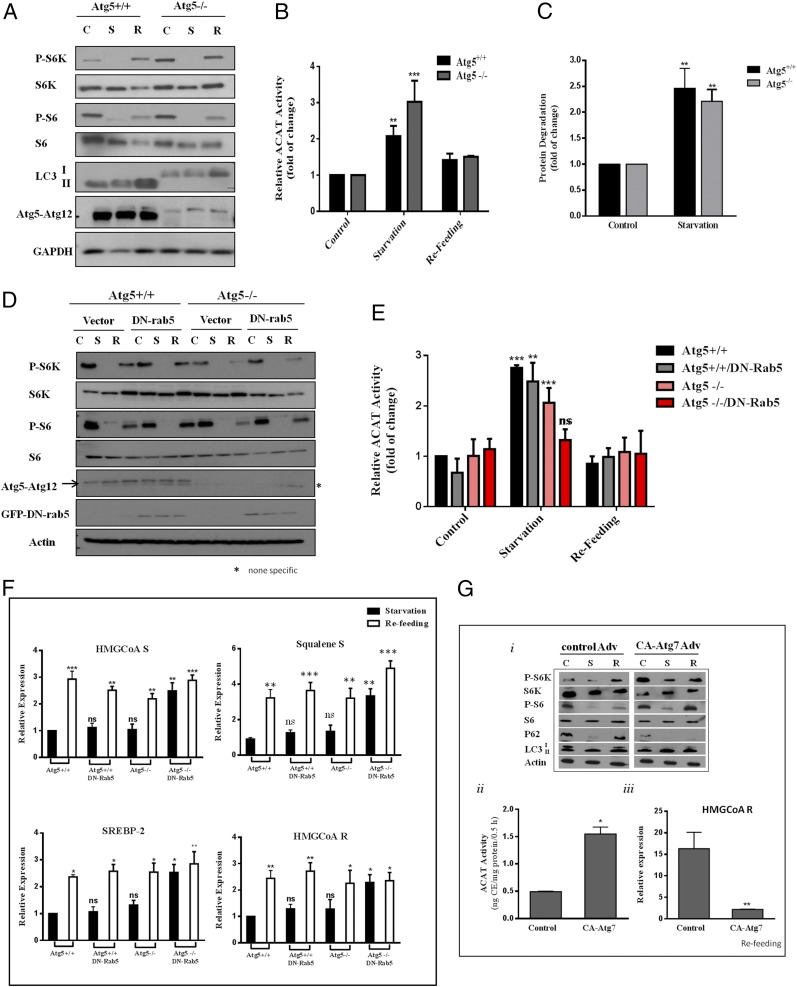
We first considered lipid droplets, a rich source of CE. CE would have to be hydrolyzed by lipases in the lysosomes to produce cholesterol. However, we found that lalistat 1, a lysosomal lipase inhibitor (20), had a limited impact on nutrient-dependent changes in ER cholesterol (Fig. S5A). This suggested that cholesterol-containing membranes were more likely the source of cholesterol. mTORC1 is known to suppress autophagy (8). In the absence of mTORC1 activity, autophagy sends membrane-rich autophagosomes, a potential source of cholesterol, to lysosomes. Hence, we investigated MEFs lacking Atg5 (Atg5−/−). Although defective in LC3-defined autophagy (Fig. 3A), Atg5−/− MEFs responded to starvation normally with an increase in ER cholesterol (Fig. 3B) and in protein degradation (Fig. 3C), agreeing with a previous report (21). However, there was no alteration of SREBP-2 target gene expression patterns in Atg5−/− MEFs, relative to that in WT MEFs (discussed below). We then considered that other entities besides autophagosomes might also deliver cholesterol-rich membranes to lysosomes during starvation when mTORC1 activity is low.
Fig. S5.
(A) MEFs were incubated in control, starvation or starvation/refeeding medium, with or without lalistat 1 (10 μM). ACAT activity was measured and is presented as average ± STD (n = 3). (B) Atg 5+/+ and Atg 5−/− MEF cells were incubated under starvation medium. AF488-transferrin (Tf) and Lysotracker Red were added in the last 30 min. Tf is rerouted to the lysosomes in both genotypes, indicated by an overlap of the AF488 Tf fluorescence with the Lysotracker Red staining.
Fig. 3.
Combination of autophagy and rerouted endosomal trafficking contributes to cholesterol trafficking from the lysosome to the ER to suppress SREBP-2. (A) Atg5+/+ and Atg5−/− MEFs were incubated in control (C), starvation (S), and starvation/refeeding (R) medium as in Fig. 1A. Cells were then lysed, subjected to SDS/PAGE, and Western-blotted with indicated antibodies. (B) ACAT activity was measured in Atg5+/+ and Atg5−/− MEFs. Results represent the fold increase of CE formation in relative to cells in control medium. Data are the average ± SEM of three independent experiments. (C) Protein degradation in Atg5+/+ and Atg5−/− MEFs. Data represent the average ± SEM of three independent experiments. (D) Atg5 Tet-off–inducible MEFs were grown in growth medium for 4 d in the presence or absence of doxycycline (10 ng/mL). Some cells were transfected with either a control vector or DN rab5 DNA on day 2. Cells were then subjected to starvation or starvation/refeed as in Fig. 1A; cells were lysed and protein was analyzed by SDS/PAGE followed by Western blotting with indicated antibodies. (E) ACAT activity in Atg5 Tet-off–inducible MEFs with or without DN rab5 transfection. Data are the average ± SEM of three independent experiments. (F) Relative expression of SREBP-2 target genes in Atg5 Tet-off–inducible MEFs with or without DN rab5 transfection. Result shows fold increase of gene expression in cells after refeeding relative to cells in starvation. Results are the average ± SEM of four independent experiments. (G, i) Western analysis of WT MEFs transfected with CA-Atg7 or control adenovirus for 1 d then grown for 3 d. (G, ii) ACAT activity of cells transfected with CA-Atg7 or control adenovirus. Data represent the cells in the refeeding condition. (G, iii) HMGCoA R mRNA expression in MEFs transfected with CA-Atg7 or control adenovirus. Data are the average ± SEM of three independent experiments. *P < 0.05, **P < 0.005, ***P < 0.0001. ns, not significant.
Endosomes are derived from cholesterol-rich plasma membrane. In normal proliferating cultured cells, such as fibroblasts, endosomes deliver nutrients (LDL, iron, etc.) to lysosomes while efficiently recycling to the plasma membrane (22). However, we recently discovered a significant rerouting of endosomes to lysosomes when mTORC1 activity is low (10) (also see Fig. S5B, WT MEF). This suggests that mTORC1 may actively maintain endosomal recycling and thus divert endosomes away from lysosomes, in addition to suppressing autophagy. When mTORC1 is low, endosomes are delivered to lysosomes, even when autophagosomes were blocked by Atg5 knockout (Fig. S5B, Atg5−/−). This could lead to high ER cholesterol and suppression of SREBP-2.
To test this possibility, we expressed dominant-negative (DN) rab5 in Atg5−/− MEFs. DN rab5 is known to block endocytosis and as well as the fusion of early endosomes (23). DN rab5 or Atg5−/− or in combination had little effect on mTORC1 activity upon nutrient conditions (Fig. 3D). The rise of ER cholesterol during starvation is minimally affected by blocking either pathway alone (Atg5−/− or DN rab5, Fig. 3E, gray and pink bars). However, when both pathways are blocked simultaneously (DN rab5-expressing Atg5−/− MEFs), ER cholesterol failed to rise during starvation (Fig. 3E, red bars). This correlated with high SREBP-2 activity during starvation (Fig. 3F, Atg5−/− + DN rab5).
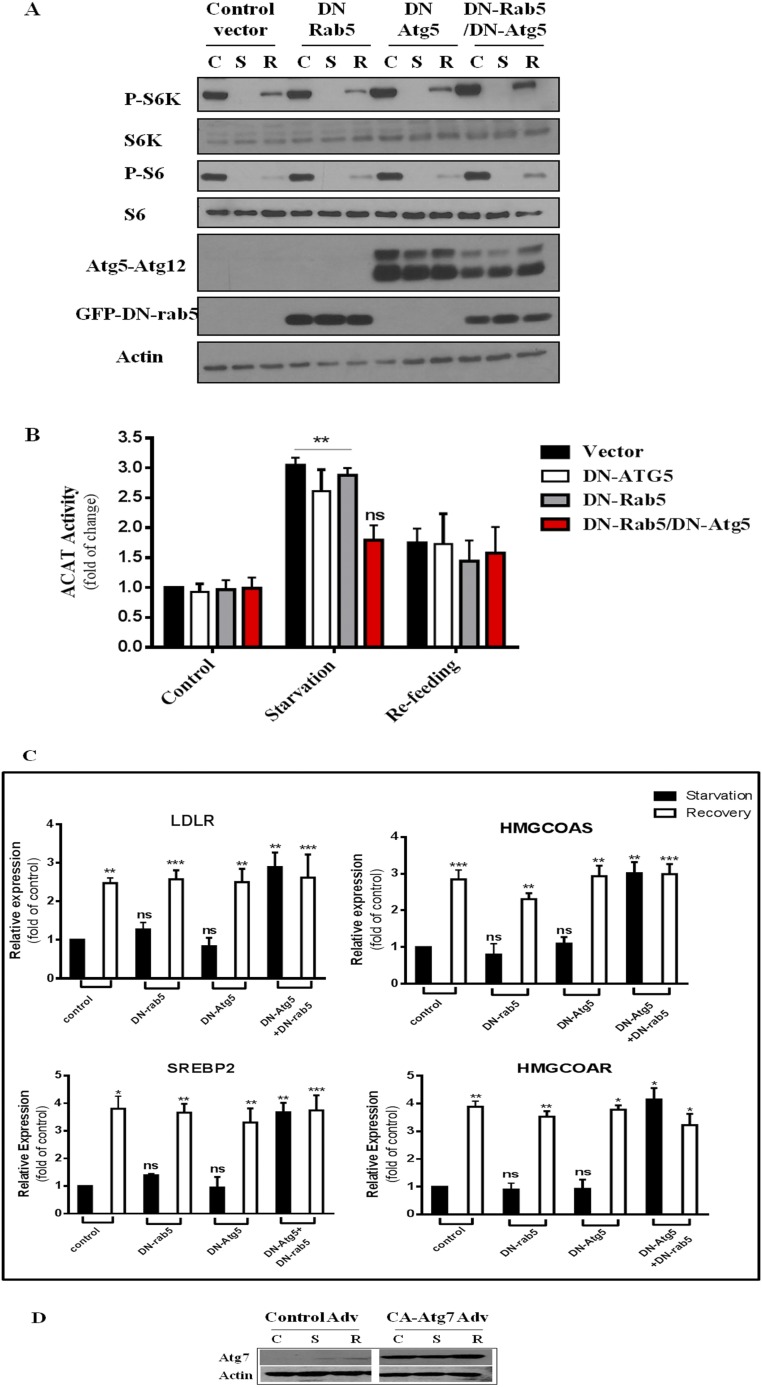
Similar results were observed with HEK cells, expressing DN Atg5 or DN rab5 or both (Fig. S6A). Only dual blockade of both pathways prevented ER cholesterol) from increasing (Fig. S6B, red bars) and, as a result, SREBP-2-dependent gene expression was high regardless of nutrient conditions (Fig. S6C).
Fig. S6.
(A) Western blot of HEK 293T cells transfected with either a control vector, DN-Atg5, DN rab5, or a combination of DN-Atg5/DN rab5. Cells were then subjected to the same treatment as in Fig. 1A, lysed, and processed SDS/PAGE followed by Western blot analysis for the indicated antibodies. (B) ACAT activity of HEK293T cells. Results represent fold increase of CE formation relative to cells in control medium. Data are the average ± SEM of three independent experiments. (C) Relative expression of SREBP-2 target genes in transfected HEK cells. Results show fold increase after refeeding relative to cells in starvation. Data are the average ± SEM of four independent experiments. (D) Western blotting of MEFs infected with control or CA Atg7 viruses. *P < 0.05, **P < 0.005, ***P < 0.0001. ns, not significant.
Furthermore, we overexpressed constitutive-active (CA) Atg7 in MEFs (Fig. S6D). This forces autophagy even when mTORC1 activity is high, as reported previously (24). Little p62 remained in CA Atg7-expressing cells, even in refeeding medium (Fig. 3 G, i). Indeed, CA Atg7 raised ER cholesterol in refed cells (Fig. 3 G, ii), compared with control virus-infected cells. This correlated with suppression of HMG-CoA reductase gene expression (Fig. 3 G, iii).
Overall, our data support the notion that, when mTORC1 is low, lysosomes obtain cholesterol from Atg5-related autophagy and from rerouted endosomes. Lysosomal exit of the cholesterol to the ER raises ER cholesterol and suppresses SREBP-2 activity. When both endocytosis and autophagy are blocked, as in DN rab5-expressing Atg5−/− MEFs, SREBP-2 activity is no longer suppressed, even though mTORC1 is inactivated by starvation. Conversely, with forced autophagy, ER cholesterol is high and SREBP-2 activity is suppressed, even when mTORC1 is high.
Discussion
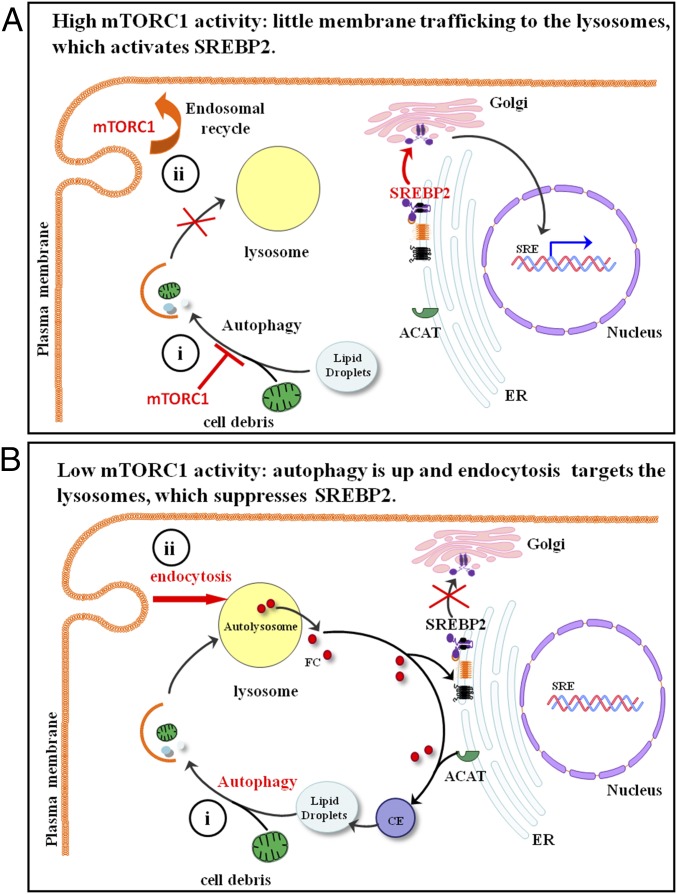
The present study demonstrates that mTORC1 plays a significant role in regulating cholesterol trafficking to lysosomes. mTORC1 is usually activated in proliferating cells and also some cancer cells (25). High mTORC1 activity (Fig. 4A) has two effects on membrane trafficking: (i) suppressing autophagy and (ii) maintaining endosomal recycling to the plasma membrane. The net effect is that membrane organelles and cell debris do not reach lysosomes. Little cholesterol is then available to be released from lysosomes to the ER. This activates SREBP-2 translocation, processing, and eventual transcriptional regulation. However, low mTORC1 activity (Fig. 4B) (i) triggers autophagy that directs cholesterol, as part of cell membrane debris, to lysosomes and (ii) redirects cholesterol-rich endosomes to lysosomes. Lysosomes then become enriched in cholesterol, which leads to the rise of the ER cholesterol levels and suppression SREBP-2. In the cell types we used here, lipid droplets do not contribute to this process. However, these organelles could play a role in lipid-rich cells, such as hepatocytes or adipocytes (24). It remains to be seen whether the regulatory pathways we have observed in cultured cell models occurs in vivo.
Fig. 4.
Model of mTORC1/autophagy/endocytosis dependent regulation of SREBP-2 transcriptional activities during (A) high mTORC1 activity (growth condition) and (B) low mTORC1 activity (starvation condition).
SREBP-1a and -2 are the predominant isoforms in cultured cells and they activate fatty acid and cholesterol synthesis, respectively. SREBP-1c is expressed primarily in the liver, where it regulated by multiple signals related to nutrient and energy status. For example, insulin activates liver SREBP-1c through mTORC1 (26). Our objective here was to determine whether the regulation of cholesterol trafficking by mTORC1 would affect the functions of SREBP-2. We concentrated our studies on genes in the cholesterol biosynthesis pathway under the regulation of SREBP-2. We present a mechanism for the interaction between mTORC1 activity and cholesterol trafficking, which governs the expression of genes normally targeted by SREBP-2. Within this particular context, our data indicate mTORC1 modulates autophagy and endosomal recycling to regulate SREBP-2 activity. We note that FAS, a typical SREBP-1a–controlled gene, displayed responses similar to those of SREBP-2 targeted genes. More in-depth studies, however, will be necessary to determine whether SREBP-1a activity is similarly regulated.
It was reported that mTORC1 prevents the nuclear entry of lipin-1 (6). In the absence of mTORC1, nuclear translocated lipin-1 promotes degradation of mature SREBP proteins, potentially by an autophagy-related process (6). Less-mature SREBP then reduces target gene expression. Our study here emphasizes the role of mTORC1 in the regulation of SREBP-2 activity by assessing target gene expression, which is a consequence of the translocation and proteolytic cleavage of SREBP-2 and its entry to the nucleus. Lipin-1 may represent an additional layer of regulation over SREBP transcriptional activity. When both autophagy and endocytosis are blocked, SREBP-2 activity remains high even without active mTORC1 (implicating lipin-1 nuclear localization). This is consistent with the idea that lipin-1 is not capable of degrading mature SREBP-2 in the nucleus in the absence of autophagy, as suggested previously (6). Future studies will be required to understand the role of lipin-1 in these situations.
It should be noted that we do not directly measure ER cholesterol in live cells here. ER cholesterol concentration is inferred by ACAT activity instead. ER membranes only have 5% cholesterol. This makes them sensitive to cholesterol changes in the cells but also difficult to directly measure (27). Nevertheless, cholesterol accumulation in the lysosomes of starved cells (filipin staining) supports the subsequent rise of cholesterol in the ER, as indicated by whole-cell ACAT assay.
The current study does not define the exact route by which cholesterol moves from the lysosomes to the ER. However, it is accepted that cholesterol is mostly in equilibrium among different cellular pools in live cells. Any “newly” appeared cholesterol is rapidly incorporated into many types of cellular membranes by both vesicular and nonvesicular means, including vesicular transport, carrier proteins, or membrane–membrane contact sites (28). Interestingly, an elegant study recently found that cholesterol released from the lysosomes appears exclusively in the plasma membrane, probed by a cholesterol-bind domain 4 of anthrolysin O (ALOD4) (29). This could imply the existence of a specific cholesterol-transport mechanism from the lysosomes to the plasma membrane. Alternatively, ALOD4 bound on the plasma membrane may have created a powerful sink for newly released cholesterol, thereby preventing it from reaching other cellular membranes. Regardless, this study refreshingly reminds us of the delicate balance of cholesterol levels among different membrane pools: As little as 1% trapping of cholesterol by ALOD4 on the plasma membrane can lower ER cholesterol and activate major cellular pathways such as SREBP. It also reflects cells’ capacity to rapidly rebalance cholesterol among cellular pools after perturbation, which inevitably includes ER membrane and regulates related pathways. Our study is perhaps such an example: by altering the membrane trafficking through the lysosomes, cholesterol redistributes and regulates SREBP-2.
In summary, we present evidence that mTORC1, through its regulation of autophagy and endosomal membrane trafficking, directs the delivery of cholesterol to lysosomes and thereby modulates ER cholesterol. This process controls SREBP-2 activation and transcriptional activity.
Materials and Methods
WT, Atg5−/−, and Atg5 (Tet-Off) MEFs were generously provided by N. Mizushima, University of Tokyo, Tokyo. TSC1/2−/− MEFs were provided by K. L. Guan, University of California, San Diego, La Jolla, CA and HEK cells (HEK293T) by J. Bell, University of Ottawa, Ottawa. All cell lines were grown and maintained in DMEM (Thermo Fisher Scientific) supplemented with 1% antibiotics (100 units/mL penicillin and 100 µg/mL streptomycin; Life Technologies) and 10% FBS (Wisent) at 37 °C in a 5% CO2 incubator. Amino acid starvation was performed using RPMI 1640 modified without l-glutamine, without amino acids, and without glucose (USBiological) supplemented with 25 mM glucose and 1% penicillin/streptomycin. Refeeding was performed using regular RPMI1640 medium (Life Technologies).
Additional information on materials and methods can be found in SI Materials and Methods.
SI Materials and Methods
Materials and Reagents.
The following reagents were purchased: QuantiTect SYBR Green PCR Kit (Qiagen), [1,2-3H(N)]-cholesterol (PerkinElmer), [9,10-3H(N)]oleic acid (PerkinElmer), ATP, CoA hydrate, chloroquine, oleic acid, cholesterol (Sigma), Torin 1 (Cedarlane Laboratories), U-18666A (Cayman), LysoTracker Red DND-99 and DAPI (dihydrochloride) (Fisher), doxycycline hydrochloride (VWR), and ChemiBLOCKER (Merck Millipore). Antibodies included SREBP-2 (sc-13552; Santa Cruz), p70 S6 kinase rabbit mAb (49D7) and phospho-p70 S6 kinase (Thr389) (2708S and 9205S; Cell Signaling), phospho-S6 ribosomal protein (Ser235/236) and S6 ribosomal protein (54D2) mouse mAb (2211S and 2317S; Cell Signaling), LC3B (2775S; Cell Signaling), anti-actin (sc-1616; Santa Cruz), HSP-70 (554243; BD Biosciences), anti-Atg5 (8540P; New England Biolabs), anti-Atg7 (ABGAP1813C; MJS Biolynx), anti-Niemann pick C1 (ab36983; Abcam), GAPDH (2118; Cell Signaling), GFP (2555S; Cell Signaling), anti-SQTSM1/p62 (ab56416; Abcam), peroxidase-AffiniPure donkey anti-rabbit IgG, and peroxidase-AffiniPure sheep anti-mouse IgG (Cedarlane Laboratories).
DN Atg5 DNA and CA-Atg7 adenovirus were generously provided by G. Hotamisligi, Harvard University, Cambridge, MA, and DN rab5 DNA was kindly provided by M. Zerial, Max Planck Institute, Dresden, Germany. Lalistat 1 was kindly provided by Y. L. Marcel, University of Ottawa Heart Institute, Ottawa.
Gene Expression Analysis.
Total RNA was isolated using RNeasy Mini Kit (Qiagen) and then reverse-transcribed using M-MLV reverse transcriptase (Life Technologies), according to the manufacturer’s instructions. The synthesized cDNA was then quantified by real-time PCR using a 7500 fast real-time PCR system (Applied Biosystem). Primers are listed in Table S1. All data were normalized to endogenous 18S RNA and expressed as fold of change to the starvation condition as indicated.
siRNA Knockdown.
Cells were grown for 24 h to 40–60% confluence then transfected using siRNA Transfection Medium and reagent (Santa Cruz). The transfection was performed according to the manufacturer’s instructions.
Protein Degradation Assay.
Long-lived protein degradation assay was performed using the methods previous described (29, 30). Briefly, cells were incubated for 2 d at 37 °C with 0.2 μCi/mL [14C]l-valine (PerkinElmer). Cells were washed with PBS to remove unincorporated radioisotope and incubated for 60 min with fresh medium containing 0.1% BSA (Sigma) and cold 10 mM valine (Sigma-Aldrich) to allow the short-lived proteins to be degraded. The medium was then removed and replaced with fresh growth medium containing 10% FBS or starvation medium for 4 h. The medium was then collected and precipitated with 10% TCA (Sigma) at 4 °C. TCA-soluble radioactivity was measured using a scintillation counter. The cells were then washed with 10% TCA and dissolved using 0.5 mL of 0.2 M sodium hydroxide (Sigma) and radioactivity was measured by liquid scintillation counting. The rate of protein degradation was calculated from the ratio of radioactivity in the TCA-soluble fraction vs. cell associated radioactivity. Parallel cell samples were treated with lysosome inhibition reagent chloroquine (30 μM; Sigma-Aldrich) to distinguish the autophagic vs. nonautophagic protein degradation and were then subtracted from the total.
Western Blot Analysis.
Cells were washed twice with cold PBS and then lysed with 200 μl of SDS buffer (50 mM Tris⋅Cl, pH 6.8, 100 mM DTT, 2% SDS, 10% glycerol, and 1 tablet each protease and phosphatase inhibitor per 10 mL buffer). Lysates were sonicated for 10–15 s to shear DNA and then heated to 75 °C for 5 min. Lysates were centrifuged for 1 min at 13,000 × g and protein contents in the supernatant were quantified using DC Protein Assay Kit II (Bio-Rad). For protein separation, samples were prepared by mixing 4× SDS loading buffer (200 mM Tris⋅HCl, pH 6.8, 400 mM DTT, 8% SDS, 40% glycerol, and 0.4% bromophenol blue) with 10–25 µg of cell lysates and separated using SDS/PAGE 10–15% gels. Proteins were then transferred to PVDF membranes and blocked with TBS-T (50 mM Tris⋅HCl, pH 7.4, 150 mM NaCl, and 0.1% Tween-20) containing 1% milk powder for 30 min and then incubated with primary antibody overnight at 4 °C. The next day membranes were incubated and gently agitated for 2 h in secondary antibodies, in TBS-T with 1% milk. The chemiluminescence was detected via Immobilon Western Chemiluminescent HRP Substrate (Millipore) using UltraCruz Autoradiography Film (Santa Cruz). Due to difficulties of stripping some plots were blotted with two different membranes but from same cell lysates.
Whole-Cell Cholesterol Esterification Assay (ACAT Assay).
Cells were grown for 24 h in growth medium and then subjected to different treatments as indicated. During the last 30 min of the incubation, cells were pulsed at 37 °C with [3H]oleate–albumin complex (10 mM with 1.2 mg/mL BSA). Excess radioactivity was washed twice with PBS. Cellular lipids were extracted using 3 mL of hexane:isopropanol (3:2, vol:vol), and CE was separated using TLC (EMD Millipore) and determined by scintillation counter. The remaining cell debris after extraction were then dissolved in 1 mL 1 N NaOH and assayed for protein content using Bio-Rad Protein Assay Dye Reagent (Bio-Rad).
Microsomal ACAT Assay.
The assay was performed as described previously (31–33). Briefly, MEF cells were preincubated and treated as indicated in the figure legends. The cells were washed, scraped, and collected in cold PBS by centrifugation and stored at −70 °C for next-day use. Microsomal fractions were prepared by taking cell pellets and thawing them in 2 mL of 20 mM potassium phosphate (pH 7.4) containing 2 mM DTT. Cells were then homogenized at 4 °C with 60 strokes using a tight-fitting type A pestle homogenizer. The homogenate was then centrifuged at 800 × g for 10 min. The postnuclear supernatant was further centrifuged at 100,000 × g for 1 h. The pellet, containing microsomal fractions, was collected and resuspended in 0.5 mL of 0.1 M potassium phosphate, pH 7.4, containing 2 mM DTT. For the ACAT assay, aliquots of 50 μg of protein were incubated for 15 min at 37 °C in 0.2 mL containing 100 mM potassium phosphate, pH 7.4, 2 mM DTT, 1.2 mg of fatty acid-free BSA, 2 mM ATP, 4 mM MgCl2, 0.2 mM CoA, and 20 μg of cholesterol added in 2 μL acetone where indicated. The reaction was started by adding [3H]oleic acid (100 μM) for 15 min at 37 °C. The reaction was stopped by adding 4 mL of chloroform/methanol (2/1, vol/vol). The cholesterol ester was separated from the mixture using TLC and the radioactivity was read using a scintillation counter.
Cell Transfection.
DNA transfections were performed using Effectene transfection reagent (Qiagen). One microgram of DN-ATG5, DN rab5, and control plasmid was used according to the manufacturer’s instructions.
Adenovirus Production and Infection.
Adenoviruses were amplified in HEK293 cells and purified following the protocol described by Ross and Parks (34). For infection, cells were seeded at a density of 1.4 × 10⁹ in a six-well plate and one multiplicity of infection was used to transduce the virus in the cells. The cells are then washed and new, fresh medium was added. The cells were then grown for 3 d before performing the experiments.
Immunofluorescence Assays.
Cells were plated and grown in glass coverslip-bottomed microscopy dishes to 50–70% confluency. The cells are then subjected to 4 h of starvation followed by 4 h of refeeding as indicated. Cells were washed with PBS then fixed with 4% paraformaldehyde in PBS for 10 min, followed by permeabilization with 0.1 mg/mL saponin in PBS for 30 min. Cells were blocked with 5% calf serum and 50 mM NH4Cl in PBS for 20 min. The primary SREBP2-specific antibody was then added at a concentration of 1:500 in a solution of 5% calf serum/PBS for 30 min. After washing with PBS and incubating with 5% calf serum/PBS for 20 min, secondary antibody (Alexa Fluo 488 goat anti-rabbit IgG) was then added at a concentration of 1:200 for 30 min, followed by a 45-min incubation in 5% calf serum/PBS. The cellular localization of immunofluorescence was observed and recorded using a C1 confocal module on a Nikon TE2000-E inverted fluorescent microscope with a 60× objective.
Statistics.
Data were analyzed using the ANOVA as applicable using PRISM software (GraphPad). The statistical significance of differences between groups was analyzed by Tukey tests. Differences were considered significant at a P < 0.05.
Acknowledgments
We thank Dr. Thomas Legace for numerous excellent suggestions throughout the study. X. Z. thanks Dr. Marek Mirski for inspiration and the opportunity to complete this study. W.E. acknowledges a scholarship from King Abdullah International Medical Research Centre (KAIMRC) and the Saudi Ministry of High Education, Saudi Arabia. This work was supported by Canadian Institutes of Health Research Grant MOP-130453.
Footnotes
The authors declare no conflict of interest.
This article is a PNAS Direct Submission.
This article contains supporting information online at www.pnas.org/lookup/suppl/doi:10.1073/pnas.1705304114/-/DCSupplemental.
References
- 1.Laplante M, Sabatini DM. mTOR signaling in growth control and disease. Cell. 2012;149:274–293. doi: 10.1016/j.cell.2012.03.017. [DOI] [PMC free article] [PubMed] [Google Scholar]
- 2.Polak P, et al. Adipose-specific knockout of raptor results in lean mice with enhanced mitochondrial respiration. Cell Metab. 2008;8:399–410. doi: 10.1016/j.cmet.2008.09.003. [DOI] [PubMed] [Google Scholar]
- 3.Sengupta S, Peterson TR, Laplante M, Oh S, Sabatini DM. mTORC1 controls fasting-induced ketogenesis and its modulation by ageing. Nature. 2010;468:1100–1104. doi: 10.1038/nature09584. [DOI] [PubMed] [Google Scholar]
- 4.Ai D, et al. Activation of ER stress and mTORC1 suppresses hepatic sortilin-1 levels in obese mice. J Clin Invest. 2012;122:1677–1687. doi: 10.1172/JCI61248. [DOI] [PMC free article] [PubMed] [Google Scholar]
- 5.Düvel K, et al. Activation of a metabolic gene regulatory network downstream of mTOR complex 1. Mol Cell. 2010;39:171–183. doi: 10.1016/j.molcel.2010.06.022. [DOI] [PMC free article] [PubMed] [Google Scholar]
- 6.Peterson TR, et al. mTOR complex 1 regulates lipin 1 localization to control the SREBP pathway. Cell. 2011;146:408–420. doi: 10.1016/j.cell.2011.06.034. [DOI] [PMC free article] [PubMed] [Google Scholar]
- 7.Brown MS, Goldstein JL. The SREBP pathway: Regulation of cholesterol metabolism by proteolysis of a membrane-bound transcription factor. Cell. 1997;89:331–340. doi: 10.1016/s0092-8674(00)80213-5. [DOI] [PubMed] [Google Scholar]
- 8.Kim J, Guan KL. Regulation of the autophagy initiating kinase ULK1 by nutrients: Roles of mTORC1 and AMPK. Cell Cycle. 2011;10:1337–1338. doi: 10.4161/cc.10.9.15291. [DOI] [PubMed] [Google Scholar]
- 9.Hao M, et al. Vesicular and non-vesicular sterol transport in living cells. The endocytic recycling compartment is a major sterol storage organelle. J Biol Chem. 2002;277:609–617. doi: 10.1074/jbc.M108861200. [DOI] [PubMed] [Google Scholar]
- 10.Dauner K, Eid W, Raghupathy R, Presley JF, Zha X. mTOR complex 1 activity is required to maintain the canonical endocytic recycling pathway against lysosomal delivery. J Biol Chem. 2017;292:5737–5747. doi: 10.1074/jbc.M116.771451. [DOI] [PMC free article] [PubMed] [Google Scholar]
- 11.Du X, Kazim AS, Brown AJ, Yang H. An essential role of Hrs/Vps27 in endosomal cholesterol trafficking. Cell Rep. 2012;1:29–35. doi: 10.1016/j.celrep.2011.10.004. [DOI] [PubMed] [Google Scholar]
- 12.Ashford TP, Porter KR. Cytoplasmic components in hepatic cell lysosomes. J Cell Biol. 1962;12:198–202. doi: 10.1083/jcb.12.1.198. [DOI] [PMC free article] [PubMed] [Google Scholar]
- 13.Arstila AU, Trump BF. Studies on cellular autophagocytosis. The formation of autophagic vacuoles in the liver after glucagon administration. Am J Pathol. 1968;53:687–733. [PMC free article] [PubMed] [Google Scholar]
- 14.Brown MS, Goldstein JL. A receptor-mediated pathway for cholesterol homeostasis. Science. 1986;232:34–47. doi: 10.1126/science.3513311. [DOI] [PubMed] [Google Scholar]
- 15.Suckling KE, Stange EF. Role of acyl-CoA: Cholesterol acyltransferase in cellular cholesterol metabolism. J Lipid Res. 1985;26:647–671. [PubMed] [Google Scholar]
- 16.Lange Y, Ye J, Chin J. The fate of cholesterol exiting lysosomes. J Biol Chem. 1997;272:17018–17022. doi: 10.1074/jbc.272.27.17018. [DOI] [PubMed] [Google Scholar]
- 17.Miserez AR, Cao G, Probst LC, Hobbs HH. Structure of the human gene encoding sterol regulatory element binding protein 2 (SREBF2) Genomics. 1997;40:31–40. doi: 10.1006/geno.1996.4525. [DOI] [PubMed] [Google Scholar]
- 18.Infante RE, et al. NPC2 facilitates bidirectional transfer of cholesterol between NPC1 and lipid bilayers, a step in cholesterol egress from lysosomes. Proc Natl Acad Sci USA. 2008;105:15287–15292. doi: 10.1073/pnas.0807328105. [DOI] [PMC free article] [PubMed] [Google Scholar]
- 19.Lu F, et al. Identification of NPC1 as the target of U18666A, an inhibitor of lysosomal cholesterol export and Ebola infection. Elife. 2015;4:e12177. doi: 10.7554/eLife.12177. [DOI] [PMC free article] [PubMed] [Google Scholar]
- 20.Rosenbaum AI, et al. Thiadiazole carbamates: Potent inhibitors of lysosomal acid lipase and potential Niemann-Pick type C disease therapeutics. J Med Chem. 2010;53:5281–5289. doi: 10.1021/jm100499s. [DOI] [PMC free article] [PubMed] [Google Scholar]
- 21.Nishida Y, et al. Discovery of Atg5/Atg7-independent alternative macroautophagy. Nature. 2009;461:654–658. doi: 10.1038/nature08455. [DOI] [PubMed] [Google Scholar]
- 22.Mayor S, Presley JF, Maxfield FR. Sorting of membrane components from endosomes and subsequent recycling to the cell surface occurs by a bulk flow process. J Cell Biol. 1993;121:1257–1269. doi: 10.1083/jcb.121.6.1257. [DOI] [PMC free article] [PubMed] [Google Scholar]
- 23.Bucci C, et al. The small GTPase rab5 functions as a regulatory factor in the early endocytic pathway. Cell. 1992;70:715–728. doi: 10.1016/0092-8674(92)90306-w. [DOI] [PubMed] [Google Scholar]
- 24.Yang L, Li P, Fu S, Calay ES, Hotamisligil GS. Defective hepatic autophagy in obesity promotes ER stress and causes insulin resistance. Cell Metab. 2010;11:467–478. doi: 10.1016/j.cmet.2010.04.005. [DOI] [PMC free article] [PubMed] [Google Scholar]
- 25.Saxton RA, Sabatini DM. mTOR signaling in growth, metabolism, and disease. Cell. 2017;168:960–976. doi: 10.1016/j.cell.2017.02.004. [DOI] [PMC free article] [PubMed] [Google Scholar]
- 26.Li S, Brown MS, Goldstein JL. Bifurcation of insulin signaling pathway in rat liver: mTORC1 required for stimulation of lipogenesis, but not inhibition of gluconeogenesis. Proc Natl Acad Sci USA. 2010;107:3441–3446. doi: 10.1073/pnas.0914798107. [DOI] [PMC free article] [PubMed] [Google Scholar]
- 27.Radhakrishnan A, Goldstein JL, McDonald JG, Brown MS. Switch-like control of SREBP-2 transport triggered by small changes in ER cholesterol: A delicate balance. Cell Metab. 2008;8:512–521. doi: 10.1016/j.cmet.2008.10.008. [DOI] [PMC free article] [PubMed] [Google Scholar]
- 28.Steck TL, Lange Y. Cell cholesterol homeostasis: Mediation by active cholesterol. Trends Cell Biol. 2010;20:680–687. doi: 10.1016/j.tcb.2010.08.007. [DOI] [PMC free article] [PubMed] [Google Scholar]
- 29.Infante RE, Radhakrishnan A. Continuous transport of a small fraction of plasma membrane cholesterol to endoplasmic reticulum regulates total cellular cholesterol. Elife. 2017;6:e25466. doi: 10.7554/eLife.25466. [DOI] [PMC free article] [PubMed] [Google Scholar]
- 30.Ogier-Denis E, Houri JJ, Bauvy C, Codogno P. Guanine nucleotide exchange on heterotrimeric Gi3 protein controls autophagic sequestration in HT-29 cells. J Biol Chem. 1996;271:28593–28600. doi: 10.1074/jbc.271.45.28593. [DOI] [PubMed] [Google Scholar]
- 31.Pattingre S, Petiot A, Codogno P. Analyses of Galpha-interacting protein and activator of G-protein-signaling-3 functions in macroautophagy. Methods Enzymol. 2004;390:17–31. doi: 10.1016/S0076-6879(04)90002-X. [DOI] [PubMed] [Google Scholar]
- 32.Tabas I, Boykow GC, Tall AR. Foam cell-forming J774 macrophages have markedly elevated acyl coenzyme A:cholesterol acyl transferase activity compared with mouse peritoneal macrophages in the presence of low density lipoprotein (LDL) despite similar LDL receptor activity. J Clin Invest. 1987;79:418–426. doi: 10.1172/JCI112828. [DOI] [PMC free article] [PubMed] [Google Scholar]
- 33.Balasubramaniam S, Mitropoulos KA, Venkatesan S. Rat-liver acyl-CoA: Cholesterol acyltransferase. Eur J Biochem. 1978;90:377–383. doi: 10.1111/j.1432-1033.1978.tb12614.x. [DOI] [PubMed] [Google Scholar]
- 34.Ross PJ, Parks RJ. Construction and characterization of adenovirus vectors. Cold Spring Harb Protoc. 2009;2009:pdb.prot5011. doi: 10.1101/pdb.prot5011. [DOI] [PubMed] [Google Scholar]


