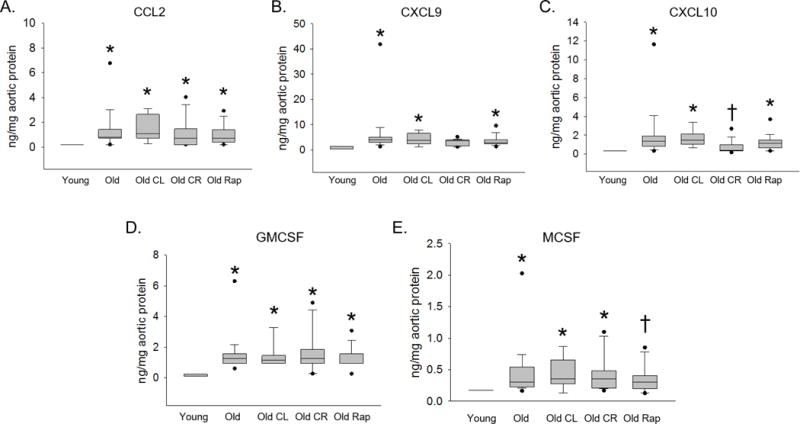
Figure 1. Age-related increases in aortic concentrations of cytokines involved in immune cell recruitment.

Aortas from Young (4–6 months), Old (22 months), Old crowded litter (CL), Old caloric restriction (CR) and Old Rapamycin treated (Rap) mice were homogenized and chemokine and cytokine concentrations were assessed using Luminex Multi Analyte Profiling data for chemokines CCL2 (A), CXCL9 (B), CXCL10 (C), GMCSF (D) and MCSF (E) are shown. n = 8–29/group. Differences were assessed with Kruskal-Wallis one-way ANOVA on ranks and Dunn’s pairwise comparison post hoc test. An asterisk (*) indicates different from Young, † different from Old, p ≤ 0.05. Data are expressed as box and whisker plots where the horizontal line within the box indicates the median, boundaries of the box indicate the 25th- and 75th -percentile, the whiskers indicate the 5th- and 95th-percentile, dots represent outlying values.
