

Abstract
Introduction:
the effects of malignant tumors of oral cavity may be reflected through mental, physical, social and emotional well-being and quality of life of patients. Those suffering from malignancies show a large degree of psychological problems (fear, anxiety, depression, panic disorders, phobias) both at the time of diagnosis and during the treatment.
Aim:
to determine a level of depression in patients with oral cavity cancer and to link quality of life and level of depression of patients with oral cavity cancer.
Patients and methods:
The study was conducted at the Clinic of Maxillofacial Surgery of the Clinical Center University of Sarajevo (CCUS) in the period from July to late October 2015, through a survey of patients with verified oral cavity cancer, questionnaire related to socio-demographic characteristics of the patients, the University of Washington Quality of Life Questionnaire (UW-QOL), and the Beck Depression Inventory (BDI).
Results:
Majority of patients from our study, specifically 50 (56%) of them, did not suffer from depression, 8 (9%) respondents suffered from mild depression, 14 (16%) respondents had moderate depression, whereas 17 (19%) of them had severe depression.
Conclusion:
quality of life and level of depression of patients with oral cavity cancer are in negative and almost linear correlation. The worse the evaluation results of one’s physical or socio-emotional health, the higher degree of depression.
Keywords: depression, quality of life, oral cavity cancer
1. INTRODUCTION
Malignant oral cavity tumors present a large socio medical problem. Progression of oral cavity cancer as well as surgical treatment may result in esthetic and functional deficiencies of the head and neck region. The consequences may affect mental, physical, social and emotional well-being and quality of life of patients (1, 2).
Malignant disease patients show a large degree of psychological problems (fear, anxiety, depression, panic disorders, phobias) both at the time of diagnosis and during the treatment (3, 4).
Recent studies have pointed to rather high incidence of mental disorders in those with malignant diseases (5), and shown that depression is an important predictor of poor quality of life of patients with malignant diseases (6).
2. AIM
The aim of the study was to determine a level of depression in patients with oral cavity cancer and to link quality of life and level of depression of patients with oral cavity cancer.
3. MATERIALS AND METHODS
The study was conducted at the Clinic of Maxillofacial Surgery of the CCUS in the period from July to late October 2015. The inclusion criteria implied that all patients had verified oral cavity cancer diagnosis, that they were treated at the UCCS, and were over 18 years of age, whereas the exclusion criteria related to all patients under the age of 18 without verified oral cavity cancer.
Instruments of the study included: questionnaire related to socio-demographic characteristics of the patients, the University of Washington Quality of Life Questionnaire (UW-QOL) and the Beck Depression Inventory (BDI).
The UW-QOL is used to evaluate the quality of life of patients treated for head and neck cancer. It consists of 12 domains divided into two components: physical function and socio-emotional function, which describe the important areas of everyday life influencing the treatment. Each of the stated categories has several possibilities enabling the patient to describe his/her functional status. Scoring is scaled so that a score of 0 represents the worst possible response and a score of 100 represents the best possible response (7).
BDI is used for measuring the severity of depression. It was developed in the early 60s of the last century, focusing on behavioral and cognitive dimensions of depression. Current version is adjusted to DSM-IV criteria for diagnosing depression and covers symptoms registered in the last two weeks. BDI contains 21 questions. Each question has a set of at least four possible responses, ranging in intensity. A value of 0 to 3 is assigned for each answer. The total score of 0-13 indicates minimal depression, 14-19 mild depression, 20-29 moderate depression, and the total score of over 30 (30-63) indicates severe depression (8).
4. RESULTS
During the course of the study one hundred questionnaires were divided. Out of the total number of questionnaires 96 (96%) were returned of which seven were not adequately completed and therefore could not be included in the study. Accordingly, the final overall sample included 89 respondents.
The study included 55 (62%) male and significantly smaller number of female respondents, specifically 34 (38%), whereas the age structure of respondents was balanced, p=0.089. Based on the age structure male respondents were somewhat older (M=58.50 ± 13.4) than female respondents (M=52.88 ± 15), with no statistically significant difference.
With regard to marital status, there were 58 (65%) married and 14 (16%) single respondents, 12 (13%) of them were widows/widowers and 5 (6%) respondents were divorced. Analysis of professional qualification revealed that majority of respondents were with high school, specifically 39 (44%) of them, followed by 23 (26%) respondents with elementary education, whereas 27 (30%) respondents had higher education and university degree. The BDI showed that majority of respondents, specifically 50 (56%) of them, did not suffer from depression, 8 (9%) had mild depression, 14 (16%) moderate depression and 17 (19%) respondents suffered from severe depression. A chi-squared test showed that level of depression does not depend on gender structure, χ2=1.13; p=0.769. Among the male and female respondents, the percentage related to those with no depression, with mild, moderate and severe depression was even. Using the chi-squared test on the entire sample of 89 respondents we showed that level of depression depended on age structure, χ2=113.3; p=0.037. Majority of respondents under 40 years of age showed no signs of depression, specifically 10 (83.3%) of them, whereas one respondent (8.3%) suffered from severe and modest depression respectively. Majority of respondents aged between 41 and 60, specifically 17 (54.8%) of them, did not show any signs of depression, whereas 5 (16.1%) suffered from severe depression, 4 (12.9%) from moderate depression, and 5 (16.1%) from mild depression. Also, majority of older respondents (61+), specifically 16 (41%) of them, did not show any signs of depression. Only two respondents (5.1%) suffered from mild depression, 10 (25.6%) from moderate depression, whereas 11 (28.2%) respondents suffered from severe depression.
The chi-squared test showed that level of depression does not depend on marital status of respondents, χ2=10.6, p=0.302. Among married, single and divorced respondents or widows/widowers the percentage of those with no depression, with mild, moderate and severe depression was even. Given the relatively small number of the sample (N=89) for χ2-test, the presented evident difference (percentage) is not statistically significant.
The chi-squared test showed that level of depression in our sample (N=88), does not depend on professional qualification of respondents, χ2=7.8 p=0.549. Among the respondents with elementary education, high school education, higher education or university degree the percentage related to those with no depression, with mild, moderate and severe depression was even; specifically evident difference (percentage) is not statistically significant. Effects of depression on physical and socio-emotional health measured by UW-QOL.
Figure 1 shows the level of depression in respect to physical health component. It is evident that with the increase of depression level respondents move “to the left side”. In other words, the value of physical health component decreases which means that more significant depression is present in respondents with lower physical health component quality.
Figure 1.
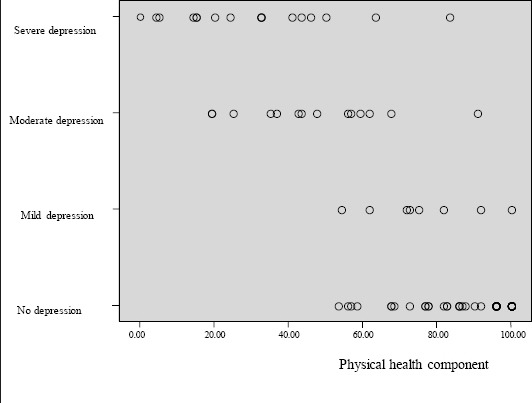
Level of depression in respect to physical health component
Figure 2 shows the level of depression in respect to socio-emotional health component. It is evident that by the increase of depression level respondents move “to the left side”. In other words, the value of socio-emotional health component decreases which means that more significant depression is present in respondents with lower socio-emotional health component quality.
Figure 2.
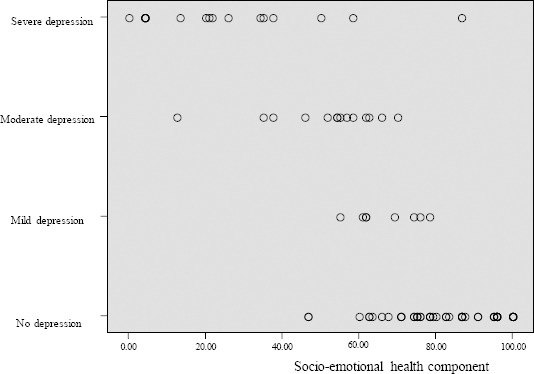
Level of depression in respect to socio-emotional health component
Physical health component and depression are in negative correlation. This correlation is statistically significant, p=0.0001. Increase of physical health component results in decrease of depression, R2=0.734, which can be presented in a dispersion diagram and linear regression equation.
Figure 3 shows dispersion diagram of correlation between depression and physical health component. This correlation is strong, negative and almost linear, R2=0.734. We can see that better socio-emotional health contributes to a lower level of depression.
Figure 3.
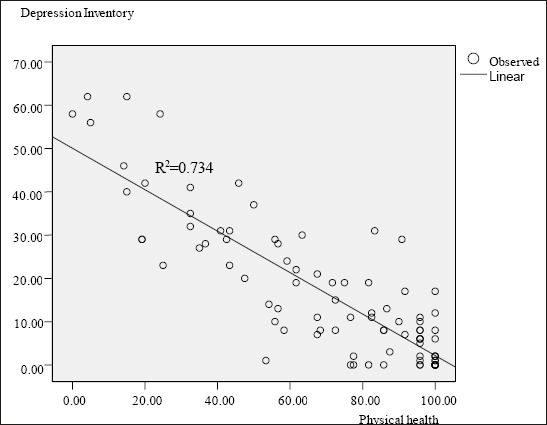
Dispersion diagram of correlation between depression and physical health.
Based on the diagram, a linear regression equation can be derived to predict the level of depression based on the depression scale: Depression = 50.066–(physical health x 0.479). Socio-emotional health component and depression are in negative correlation. This correlation is statistically significant, p=0.0001. Increase of socio-emotional component results in decrease of depression, R2=0.734, which can be presented in a dispersion diagram and linear regression equation.
Figure 4. shows dispersion diagram of correlation between depression and socio-emotional health component. This correlation is strong, negative and almost linear, R2=0.767. We can see that better socio-emotional health contributes to a lower level of depression. Based on the diagram, a linear regression equation can be derived to predict the level of depression based on the depression scale: Depression = 50.043–(socio-emotional health x 0.519).
Figure 4.
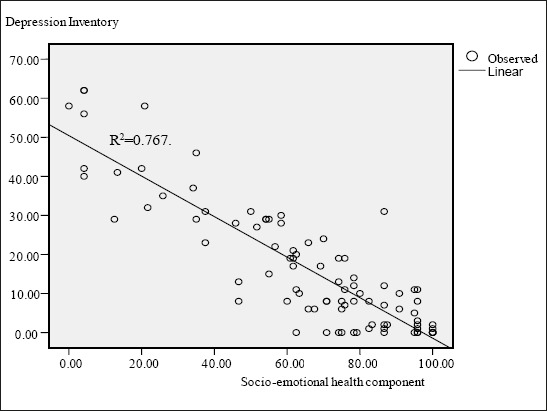
Dispersion diagram of correlation between depression and socio-emotional health component
5. DISCUSSION
Majority of respondents included in the study, specifically 50 (56%) of them, did not have any signs of depression, 17 (19%) suffered from severe depression, 14 (16%) from moderate depression, whereas 8 (9%) of them suffered from mild depression.
A study conducted in B&H by Vukojević M, et al. showed that 53.7% of respondents suffered from certain level of depression, of which 26.3% from mild depression, 22.5% from moderate depression, whereas 5% of respondents suffered from severe depression (9).
Our sample proved that level of depression does not depend on gender, marital status or professional qualification of respondents. The same conclusions were reached by Vukojević M, et al. (9).
The study of Vukojević M, et al. showed that older oncology patients were less depressive, which can be explained by the fact that older patients also suffer from other associated chronic diseases and are more accustomed to limitations unlike younger patients (9). On the other hand, our study showed that majority of respondents over 61 years of age suffered from depression.
Following the research and data processing we proved that both physical health and depression and socio-emotional health and depression have strong, negative and almost linear correlation and that better physical and socio-emotional health respectively, contributes to lower level of depression and vice verse.
Lack of research related to this topic in the available literature, especially in our country, proves the necessity for conducting alike and similar researches which would contribute to improvement of health care and overall health protection of this nosological group.
5. CONCLUSION
Values of quality of life, specifically physical and socio-emotional health, as components representing quality of health in our questionnaire, and presence of depression among our respondents are in a strong, direct correlation. The worse the evaluation results of one’s physical or socio-emotional health, the higher degree of depression.
Footnotes
• Conflict of interest: none declared.
REFERENCES
- 1.Rhee JS, Matthews BA, Neuburg M, Logan BR, Burzynski M, Nattinger AB. Validation of a quality-of-life instrument for patients with nonmelanoma skin cancer. Arch Facial Plast Surg. 2006;8(5):314–8. doi: 10.1001/archfaci.8.5.314. [DOI] [PMC free article] [PubMed] [Google Scholar]
- 2.Rhee JS, Matthews BA, Neuburg M, Logan BR, Burzynski M, Nattinger AB. The skin cancer index: clinical responsiveness and predictors of quality of life. Laryngoscope. 2007;117:399–405. doi: 10.1097/MLG.0b013e31802e2d88. [DOI] [PMC free article] [PubMed] [Google Scholar]
- 3.Korfage IJ, Essink-Bot ML, Janssens AC, Schröder FH, de Koning HJ. Anxiety and depression after prostate cancer diagnosis and treatment:5-year follow-up. Br J Cancer. 2006;94(8):1093–8. doi: 10.1038/sj.bjc.6603057. [DOI] [PMC free article] [PubMed] [Google Scholar]
- 4.Strong V, Waters R, Hibberd C, Rush R, Cargill A, Storey D, et al. Emotional distress in cancer patients: the Edinburgh Cancer Centre symptom study. Br J Cancer. 2007;96(6):868–74. doi: 10.1038/sj.bjc.6603626. [DOI] [PMC free article] [PubMed] [Google Scholar]
- 5.Kangas M, Henry JL, Bryant RA. The course of psychological disorders in the 1st year after cancer diagnosis. J Consult Clin Psychol. 2005;73(4):763–8. doi: 10.1037/0022-006X.73.4.763. [DOI] [PubMed] [Google Scholar]
- 6.Bugarski V, Biro M, Novović Z. Povezanost kvaliteta života i depresivnih obeležja kod pacijenata na hemodijaliznom tretmanu. Primenjena psihologija. 2008;2(1):5–24. [Google Scholar]
- 7.Ringash J, Bezjak A. A structured review of quality of life instruments for head and neck cancer patients. Head Neck. 2001;23:201–13. doi: 10.1002/1097-0347(200103)23:3<201::aid-hed1019>3.0.co;2-m. [DOI] [PubMed] [Google Scholar]
- 8.Beck AT, Steer RA, Garbin MG. Psychometric properties of the Beck Depression Inventory. Twenty-five years of evaluation. Clin Psychol Rev. 1998;8:77–100. [Google Scholar]
- 9.Vukojević M, Perić I, Kordić M. Anksioznost i depresivnost kod onkoloških bolesnika u Sveučilišnoj kliničkoj bolnici Mostar. LiječVjesn. 2012;134:208–14. [PubMed] [Google Scholar]