

Abstract
Background and aims
The full burden of the opioid epidemic on U.S. hospitals has not been described. We aimed to estimate how heroin (HOD) and prescription opioid (POD) overdose-associated admissions, costs, outcomes, and patient characteristics have changed from 2001 – 2012.
Design
Retrospective cohort study of hospital admissions from the National Inpatient Sample.
Setting
United States of America.
Participants
Hospital admissions in patients 18 years of age or older admitted with a diagnosis of HOD or POD. The NIS sample included 94,492,438 admissions from 2001 – 2012. The final unweighted study sample included 138,610 admissions (POD – 122,147 and HOD – 16,463).
Measurements
Primary outcomes were rates of admissions per 100,000 persons using U.S. Census Bureau annual estimates. Other outcomes included inpatient mortality, hospital length-of-stay, cumulative and mean hospital costs, and patient demographics. All analyses were weighted to provide national estimates.
Findings
Between 2001 and 2012, an estimated 663,715 POD and HOD admissions occurred nationwide. HOD admissions increased 0.11 per 100,000 persons per year (95% CI 0.04, 0.17), while POD admissions increased 1.25 per 100,000 persons per year (95% CI 1.15, 1.34). Total inpatient costs increased by $4.1 million dollars per year (95% CI 2.7, 5.5) for HOD admissions and by $46.0 million dollars per year (95% CI 43.1, 48.9) for POD admissions, with an associated increase in hospitalization costs to over $700 million annually. The adjusted odds of death in the POD group declined modestly per year (OR 0.98, 95% CI 0.97, 0.99), with no difference in HOD mortality or length-of-stay. Patients with POD were older, more likely to be female, and more likely to be white compared with HOD patients.
Conclusions
Rates and costs of heroin and prescription opioid overdose related admissions in the U.S. increased substantially from 2001 to 2012. The rapid and ongoing rise in both numbers of hospitalizations and their costs suggests that the burden of POD may threaten the infrastructure and finances of U.S. hospitals.
Keywords: Prescription opioid, heroin, overdose, hospitalization, admission
INTRODUCTION
Opioid overdoses are a global public health concern, with an estimated 99,000–253,000 deaths attributed to opioid overdoses worldwide in 2010 (1). In the United States, unintentional drug overdoses are the leading cause of injury death among all individuals between 1980–2008 (2). Of the 41,340 deaths by unintentional poisoning in 2011, 41% involved prescription opioid analgesics and 10% involved heroin (3,4). The death rates from prescription opioid analgesic related overdoses (POD) and heroin related overdoses (HOD) have increased 2-fold from 2000 – 2014 (5). There also appear to be racial and gender differences in the pattern of HOD and POD hospitalizations. Women have higher rates of POD admissions compared to men, while the admissions for white HOD patients increased at a faster rate than black HOD patients from 1993 – 2008 (6).
In the larger opioid-use disorder population, recent research has also demonstrated an 64% increase in opioid-related emergency department visits and a 100% increase in opioid-related inpatient stays (7) with an associated increase in costs (8). While U.S. opioid-related poisoning admissions increased from 12,786 in 1999 to 27,765 in 2006 (9) and the estimated direct costs of opioid-related overdoses in 2009 were nearly $2.2 billion dollars in 2009 (10), there are no updated trends in opioid overdose hospitalizations and their associated costs.
In this context, we sought to examine recent trends in opioid overdose-related admissions, outcomes, and hospital costs and differences in admissions for POD and HOD. The aims of this study were to: (1) Estimate and test if HOD and POD admissions changed from 2001 – 2012; (2) Estimate and test if HOD and POD outcomes and hospital costs changed from 2001 – 2012; (3) Estimate and test if HOD and POD patient demographic characteristics changed from 2001 – 2012.
METHODS
Design
We analyzed data from the 2001–2012 Nationwide Inpatient Sample (NIS). The NIS is the largest all-payer inpatient care database available in the United States. The NIS samples from the State Inpatient Databases participating in the Healthcare Cost and Utilization Project (HCUP), which is a family of healthcare databases sponsored by the Agency for Healthcare Research and Quality. During the time period examined, the NIS approximates a 20%-stratified sample of discharges from U.S. community hospitals, excluding rehabilitation and long-term acute care hospitals. As defined by the American Hospital Association, U.S. community hospitals include “all nonfederal, short-term (with an average length of stay less than 30 days), general, and other specialty hospitals, excluding hospital units of institutions.” Institutional Review Board exemption was granted by the Beth Israel Deaconess Medical Center.
Study Sample
The NIS includes information on primary and secondary discharge diagnoses according to the International Classification of Diseases, 9th revision, Clinical Modification (ICD-9-CM). We included all admissions among patients 18 years of age or older admitted with a diagnosis (either primary or secondary) of heroin or opioid overdose using ICD-9-CM diagnosis codes previously defined for heroin and opioid overdoses (6,11). The presence of any primary or secondary ICD-9-CM diagnosis code and/or external-cause-of-injury (E-code) has been found previously to be the most sensitive for capturing drug overdoses (12). Heroin overdose (HOD) cases were defined by ICD-9-CM code 965.01 or E-code E850.0. Prescription opioid overdose (POD) cases, which included both illicit and unintentional accidental, were defined similarly by ICD-9-CM codes 965.00, 965.02, or 965.09 or E-code E850.01 or E850.2. Of note, a small percentage of admissions met criteria for both HOD and POD admissions (0.6%), and these admissions were assigned to the HOD group. The NIS sample included 94,492,438 admissions between 2001 and 2012. The final unweighted study sample included 138,610 admissions (POD – 122,147 and HOD – 16,463) from the 2001–2012 NIS sample.
Measures
Outcome and utilization measures examined include length-of-stay (LOS), in-hospital death, disposition, and cost of admission. Total hospital costs for each admissions were calculated by converting total hospital charges to costs using the HCUP cost-to-charge ratio, which is based on hospital account reports from the Centers for Medicare & Medicaid Services (CMS) (13). All hospital costs are reported in 2012 dollars, with inflation adjusted using the Gross Domestic Product (GDP) Price Index from the U.S. Department of Commerce, Bureau of Economic Analysis with 2012 as the index base (14).
Patient characteristics available in NIS include age, sex, race/ethnicity, and primary payer. Chronic comorbidities were classified using Comorbidity Software maintained by HCUP to produce an Elixhauser Comorbidity Index score (15). Hospital characteristics include U.S. census region, teaching status, urban or rural location, and hospital bed size. Hospital bed size was characterized as small, medium, or large based on the number of hospital beds, region, and teaching status according to HCUP specifications.
Statistical Analysis
Rates of HOD and POD admissions per 100,000 persons in the United States were estimated from 2001–2012 using the overall population from U.S. Census Bureau annual estimates for the appropriate year. Patient, hospital characteristics, and outcomes are reported as means with standard errors for continuous variables and proportions for binary or categorical variables. We used analysis of variance or the chi-squared test for univariate within group comparisons. Between group differences were assessed using linear or logistic regression with the inclusion of an interaction term between HOD or POD and year grouping. For presentation and ease of interpretability, the study sample was divided into three-year groups, and all univariate analyses were performed on these groupings. We then estimated separate multivariate linear or logistic regression models for the HOD and POD groups to examine the within group relationships between outcomes and year adjusting for age, race/ethnicity, number of comorbidities, and hospital region. Effect estimates (beta coefficients or odds ratios) and 95% confidence intervals (CIs) are reported. To account for the complex sampling design in NIS, all data were weighted to reflect national estimates, and sample sizes and weighted percentages are reported. Data were analyzed with SAS 9.3 (SAS Institute, Inc., Cary, NC) and SUDAAN (RTI International, Research Triangle Park, NC) to account for the complex sampling design.
RESULTS
Between 2001–2012, an estimated 663,715 POD and HOD admissions occurred in the U.S. HOD admissions increased 1.9-fold from 1.7 admissions per 100,000 persons in 2001 to 3.3 in 2012, while POD admissions increased 2.5-fold from 8.9 admissions per 100,000 persons in 2001 to 22.3 in 2012 (Figure 1). Similarly, total HOD hospital days increased 2-fold from 19,463 total days in 2001 to 39,390 days in 2012, while total POD hospital days increased 3.2-fold from 87,663 in 2001 to 280,080 in 2012. Both HOD and POD admissions increased over the study period after adjustment for patient age, race/ethnicity, comorbidities, and hospital region (Table 2).
Figure 1. Total Opioid Overdose Hospitalization Costs and Admissions 2001 – 2012.
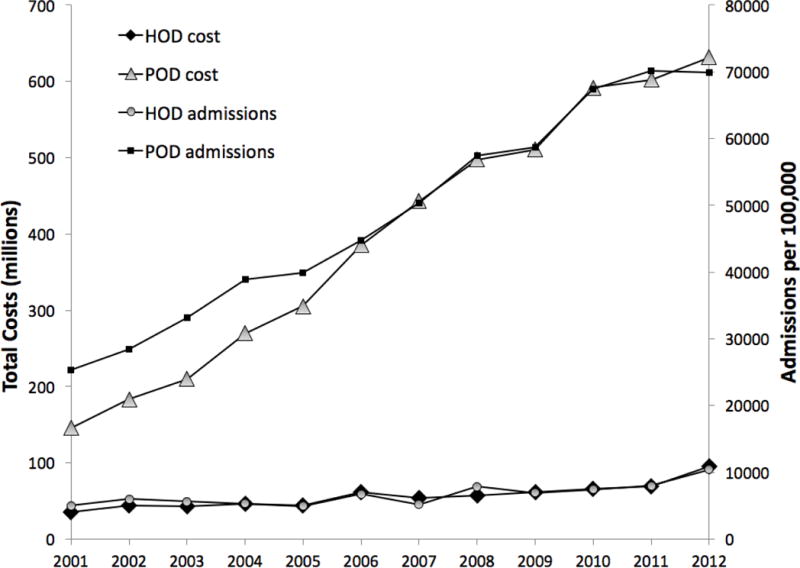
1. Costs reported in 2012 U.S. dollars
Table 2.
Adjusted Inpatient Mortality, Hospital Resource Utilization and Costs of Heroin and Prescription Opioid Overdose Admissions in the United States from 2001–2012
| Heroin Overdose (HOD) | Prescription Opioid Overdose (POD) | |||
|---|---|---|---|---|
| Effect Estimate3 | 95% CI | Effect Estimate | 95% CI | |
| Admissions1 | 0.11 | 0.04, 0.17 | 1.25 | 1.15, 1.34 |
| Total Cost2 | 0.41 | 0.27, 0.55 | 4.60 | 4.31, 4.89 |
| Cost per Admission | 54.04 | −52.51, 156.60 | 97.28 | 57.28, 137.28 |
| Length-of-stay | 0.00 | −0.03, 0.03 | 0.004 | −0.01, 0.02 |
| In-hospital death | 1.00 | 0.98, 1.03 | 0.98 | 0.97, 0.99 |
Admissions per 100,000 persons
Costs reported to the 7th power
Effect estimates reported as beta coefficients (Admissions, Total Cost, Cost per Admission, Length-of-stay) or odds ratio (In-hospital death)
Hospital Costs
Over the entire 2001–2012 study period, the cumulative hospital costs for opioid-related hospitalizations were $5.5 billion dollars. The cumulative costs per year for HOD hospitalizations increased from $35.4 million in 2002 to $95.6 million in 2012, while the cumulative costs for POD hospitalizations increased from $143.8 million in 2002 to $653.7 million in 2012 (Figure 1). The mean cost per admission did not change for HOD admissions during the study period, whereas the POD cost per admission increased slightly over time. In 2012, the cumulative hospital costs for all opioid-related hospitalizations totaled $727.3 million dollars.
Outcomes
Unadjusted patient outcomes, resource utilization, and costs are reported in Table 1 and adjusted outcomes are reported in Table 2. LOS increased significantly over time for POD admissions. POD LOS was significantly, if modestly, longer than HOD LOS. Most were routine discharges to home. There were 687 HOD deaths and 2,795 POD deaths during the study period. Total mortality rates during hospitalization remained stable over time, with 4.5% of HOD hospitalizations and 2.2% of POD hospitalizations resulting in death in 2012 despite the younger age and lower comorbidity burden among patients hospitalized with HOD. After adjustment, there was a small decrease in the odds of death per year in the POD group, whereas we observed no change in HOD mortality during the study period. HOD patients were twice as likely to leave against medical advice as compared to POD patients.
Table 1.
Unadjusted Inpatient Mortality, Hospital Resource Utilization and Costs of Heroin and Prescription Opioid Overdose Admissions in the United States from 2001–2012
| Heroin Overdose (HOD) | Prescription Opioid Overdose (POD) | ||||||||
|---|---|---|---|---|---|---|---|---|---|
| 2001–2004 (n= 4,611) |
2005–2008 (n=5,102) |
2009–2012 (n=6,750) |
p-value | 2001–2004 (n=26,729) |
2005–2008 (n=40,689) |
2009–2012 (n=54,729) |
p-value | Between group p-value | |
| Length-of-stay (days)1 | 3.81 (0.11) | 3.98 (0.15) | 3.77 (0.09) | 0.48 | 3.57 (0.04) | 3.96 (0.05) | 3.99 (0.04) | <0.0001 | 0.03 |
| Disposition2 | |||||||||
| Routine | 2,892 (63.1%) | 3,379 (66.3%) | 4,402 (65.3%) | 0.08 | 15,755 (59.0%) | 23,772 (58.5%) | 31,305 (57.2%) | <0.0001 | 0.0002 |
| Transfer to short-term hospital | 114 (2.4%) | 135 (2.6%) | 168 (2.5%) | 1,242 (4.7%) | 1,633 (4.0%) | 2,101 (3.8%) | |||
| Other transfer | 666 (14.5%) | 612 (12.1%) | 891 (13.3%) | 6,378 (23.9%) | 9,632 (23.7%) | 12,999 (23.8%) | |||
| Home health care | 36 (0.8%) | 51 (1.0%) | 87 (1.3%) | 1,146 (4.3%) | 2,500 (6.1%) | 3,926 (7.2%) | |||
| Against medical advice | 661 (14.5%) | 739 (14.4%) | 876 (13.0%) | 1,440 (5.4%) | 2,121 (5.2%) | 3,015 (5.5%) | |||
| Died | 210 (4.6%) | 176 (3.5%) | 210 (4.5%) | 631 (2.4%) | 911 (2.3%) | 1,253 (2.3%) | |||
| Destination unknown | 3 (0.1%) | 13 (0.1%) | 3 (0.1%) | 58 (0.3%) | 68 (0.2%) | 61 (0.2%) | |||
| Cost in U.S. dollars1 | 8,929.01 (317.07) |
9,050.23 (552.78) |
9,416.86 (245.40) |
0.46 | 7,364.22 (115.85) |
8,825.72 (128.32) |
9,163.55 (103.86) |
<0.0001 | <0.0001 |
Reported as mean (SE).
Sample size (weighted percentage). Other transfer includes skilled nursing facility (SNF), intermediate care, and another type of facility. Destination unknown patients discharged alive.
HOD and POD Patient Characteristics
Selected patient and hospital characteristics are displayed in Table 3. The mean age of HOD patients was younger than for POD and decreased further over the study period, while the mean age of POD patients increased. The proportion of white patients increased over time among admissions for HOD, with corresponding decreases in the proportion of black and Hispanic patients. While no changes in race/ethnicity over time occurred among admissions for POD, we observed significant differences between admissions for POD and HOD, with the former having a higher proportion of white patients.
Table 3.
Patient Demographic and Hospital Characteristics of Heroin and Prescription Overdoses Admissions, 2001–2012
| Heroin | Prescription Opioid | ||||||||
|---|---|---|---|---|---|---|---|---|---|
| 2001–2004 (n= 4,611) |
2005–2008 (n=5,102)) |
2009–2012 (n=6,750) |
p-value | 2001–2004 (n=26,729) |
2005–2008 (n=40,689) |
2009–2012 (n=54,729) |
p-value | Between group p-value | |
| Patient Characteristics | |||||||||
| Age, mean (SE) | 36.0 (0.26) | 36.8 (0.74) | 34.9 (0.26) | 0.0009 | 43.8 (0.16) | 45.9 (0.15) | 47.3 (0.13) | <0.0001 | <0.0001 |
| Female | 1,313 (28.5) | 1,471 (28.9) | 1,920 (28.4) | 0.84 | 15,090 (56.4) | 22,286 (54.8) | 30,521 (55.8) | 0.48 | <0.0001 |
| Race/Ethnicity | |||||||||
| White | 2,321 (64.3) | 2,366 (67.9) | 4,310 (71.5) | 0.002 | 16,128 (82.0) | 25,757 (83.2) | 40,191 (81.7) | 0.07 | <0.0001 |
| Black | 619 (17.2) | 517 (14.8) | 767 (12.8) | 1,734 (8.8) | 2,264 (7.3) | 4,062 (8.2) | |||
| Hispanic | 520 (14.4) | 470 (13.6) | 666 (11.2) | 1,193 (6.0) | 1,750 (5.7) | 2,976 (6.0) | |||
| Other | 143 (4.1) | 131 (3.7) | 270 (4.5) | 622 (3.2) | 1,158 (3.8) | 1,996 (4.1) | |||
| Primary payer | |||||||||
| Medicare | 342 (7.5) | 452 (8.9) | 598 (8.9) | 0.11 | 7,212 (27.1) | 12,735 (31.4) | 19,070 (35.0) | < 0.0001 | <0.0001 |
| Medicaid | 1,440 (31.6) | 1,600 (31.9) | 2,007 (30.0) | 5,955 (22.4) | 8,603 (21.3) | 12,370 (22.7) | |||
| Private | 996 (21.6) | 1,005 (19.8) | 1,399 (20.8) | 8,292 (31.1) | 10,784 (26.5) | 12,387 (22.6) | |||
| Self-pay | 1,575 (34.2) | 1,766 (34.3) | 2,346 (34.7) | 4,087 (15.3) | 6,587 (16.2) | 8,351 (15.4) | |||
| Other | 236 (5.1) | 267 (5.1) | 383 (5.7) | 1,116 (4.1) | 1,887 (4.6) | 2,340 (4.3) | |||
| Number of Comorbidities, mean (SE) | 2.05 (0.03) | 2.27 (0.09) | 2.63 (0.03) | <0.0001 | 1.97 (0.02) | 2.48 (0.02) | 3.14 (0.02) | <0.0001 | <0.0001 |
| Hospital Characteristics | |||||||||
| Hospital location/teaching status | |||||||||
| Rural | 204 (4.6) | 143 (2.8) | 316 (4.7) | 0.91 | 4,659 (18.1) | 6,673 (16.6) | 7,917 (14.9) | 0.002 | 0.03 |
| Urban non-teaching | 1,906 (40.3) | 2,210 (43.2) | 2,741 (40.9) | 12,611 (46.3) | 19,028 (46.5) | 24,169 (44.8) | |||
| Urban teaching | 2,500 (55.1) | 2,747 (54.0) | 3,627 (54.4) | 9,459 (35.6) | 14,910 (36.9) | 21,819 (40.3) | |||
| Hospital size | |||||||||
| Small | 633 (12.9) | 608 (11.5) | 865 (12.5) | 0.28 | 3,307 (11.7) | 5,372 (12.6) | 6,632 (11.9) | 0.64 | 0.43 |
| Medium | 1,441 (31.4) | 1,431 (28.0) | 1776 (27.0) | 7,735 (28.5) | 10,671 (26.6) | 14,252 (26.5) | |||
| Large | 2,536 (55.7) | 3,061 (60.5) | 4043 (60.5) | 15,687 (59.8) | 24,568 (60.8) | 33,021 (61.6) | |||
| Hospital region | |||||||||
| Northeast | 1,782 (39.2) | 1,613 (32.1) | 2,032 (30.4) | 0.0006 | 4,204 (16.0) | 6,017 (15.3) | 8,406 (15.3) | 0.91 | 0.01 |
| Midwest | 1,014 (22.8) | 1,738 (34.9) | 2,221 (32.6) | 5,229 (20.5) | 8,289 (21.0) | 11,664 (21.0) | |||
| South | 1,087 (22.3) | 9,91 (18.5) | 1,200 (17.8) | 11,289 (41.0) | 17,116 (41.2) | 22,497 (41.8) | |||
| West | 728 (15.7) | 7,60 (14.4) | 1,297 (19.2) | 6,007 (22.5) | 9,267 (22.6) | 12,162 (21.9) | |||
Data presented are sample sizes (weighted percentages) and means (SE) to reflect estimates of the population
The mean number of chronic comorbidities increased among admissions for both HOD and POD. Similarly, although the primary payer for HOD admissions did not change over time, the proportion of Medicare-covered admissions for POD increased with a corresponding decrease over the same periods in private insurance.
The hospital location and teaching status differed between admissions for POD and HOD. The majority of HOD admissions occurred in urban teaching and non-teaching hospitals and remained stable over the study period. In contrast, the hospital location/teaching status in POD admissions changed over time, with a shift toward more urban hospitals. Hospital size was similar and remained stable for both diagnoses over the study period, with over 50% of admissions occurring in large hospitals in both groups. Hospital region for HOD admissions changed significantly over the study period, with the proportion of admissions in the Northeast region decreasing and the largest increase occurring in the Midwest. While the geographic distribution was stable among POD admissions over time, POD patients were particularly likely to be hospitalized in the South.
DISCUSSION
We report the trends in the rate, outcomes, and costs for opioid overdose-related admissions in the United States from 2001–2012. Over a 12-year study period, heroin overdose related admissions increased 1.9-fold and prescription opioid admissions increased 2.5-fold. There was a corresponding increase in the total costs for HOD admissions of 2.7-fold and 3.6-fold for POD admissions. The cost per admission for POD admissions increased over the study period, and total costs in both POD and HOD groups increased over time. In-hospital mortality did not improve over time for HOD patients, whereas there was a slight decrease in the adjusted odds of death in POD patients. Overall, HOD overdose admissions were twice as likely to lead to in-hospital death as compared to POD admissions.
These findings of an increasing rate of heroin and prescription opioid overdose admissions are consistent with and extend those from prior reports demonstrating the increase (6,9). POD patients were older, more likely to be female, and to be white as compared to HOD patients. Further, the primary health insurance for HOD admissions was most commonly either Medicaid or no health insurance, whereas the primary insurance was Medicare for the older patients hospitalized with POD. With regards to hospital characteristics, the majority of HOD and POD admissions occurred in large, urban teaching and non-teaching hospitals, with an increasing shift to such hospitals over time. Given the increases in both numbers of admissions and the proportion hospitalized in urban settings, large urban hospitals are at the forefront with regards to facing this aspect of the epidemic, while also exposing these institutions to a greater financial burden.
Demographics, hospital characteristics, and geographic patterns differ between prescription opioid and heroin overdoses that result in hospitalizations. Our results expand on a prior study demonstrating that HOD and POD admissions are actually interdependent by providing updated trends, patient characteristics and outcomes, as well as hospital characteristics (6). In that study, each additional HOD increased the subsequent year’s POD admission rate by a factor of 1.57, whereas each additional POD increased the rate of HOD admissions by a factor of 1.26 the following year. The recognition that the heroin and prescription opioid hospitalized patients are drawn from different but inter-related populations has important implications for interventions aimed at slowing the opioid epidemic. If an overdose hospitalization is viewed as an opportunity to change the course of addiction, potential obstacles or barriers to entry into opioid use disorder care may be anticipated based on the primary agent responsible for the overdose. For example, 1 in 7 HOD patients “leaves against medical advice,” a rate much higher than observed in POD patients. The differences in POD and HOD patients may also be an opportunity for further examination into tailored interventions, including medication assisted therapies or psychosocial interventions (16,17).
Our findings highlight the sobering downstream ramifications of the opioid epidemic. Despite increasing recognition of the opioid epidemic, inpatient mortality in opioid overdose-related hospital admissions has not changed over time. Further, 35% of HOD patients and 15% of POD patients have no insurance over the study period, which has financial ramifications on healthcare systems that are at the forefront of the epidemic.
A primary strength of this analysis is the use of large, nationally representative data, as our results are generalizable to all hospitalizations occurring in the United States. The study also has limitations. NIS is an administrative database collected from hospital administrative records, and thus there are inherent limitations to the granularity of these data. The findings we report from these data are limited to direct inpatient costs due to heroin and prescription opioid overdose-related hospitalization costs, which is only a small part of the financial burden of this epidemic. Health care costs not captured in this analysis include health care costs not captured in NIS, such as emergency department and outpatient visits, as well as opioid related diagnosis not related to overdoses. Further, while the use of ICD-9-CM diagnoses for identifying heroin and prescription opioid overdoses has been demonstrated to be sensitive in capturing these events (12), there remains the possibility of misclassification, which may lead to higher or lower estimates of the true burden of opioid overdose on U.S. hospitalizations.
In summary, our study demonstrates a powerful trend in increasing heroin and prescription opioid overdose-related admissions, with a massive associated increase in cumulative hospitalization costs particularly for POD-related hospitalizations.
Acknowledgments
Sources of Support: National Institute of Alcohol Abuse and Alcoholism (F32AA024664)
Footnotes
Disclosure: The authors report that no potential conflicts of interest exist with any companies/organizations whose products or services may be discussed in this article.
References
- 1.UNODC. World Drug Report 2012. (United Nations publication. Report No.: Sales No. E. 12.XI.1). [Google Scholar]
- 2.Warner M, Chen LH, Makuc DM, Anderson RN, Miniño AM. Drug poisoning deaths in the United States, 1980–2008. NCHS Data Brief. 2011 Dec;(81):1–8. [PubMed] [Google Scholar]
- 3.Chen LH, Hedegaard H, Warner M. Drug-poisoning Deaths Involving Opioid Analgesics: United States, 1999– 2011. NCHS Data Brief. 2014 Sep;(166):1–8. [PubMed] [Google Scholar]
- 4.Hedegaard H, Chen LH, Warner M. Drug-poisoning deaths involving heroin: United States, 2000–2013. NCHS Data Brief. 2015 Mar;(190):1–8. [PubMed] [Google Scholar]
- 5.Rudd A, Aleshire N, Zibbell JE, Gladden RM. Increases in Drug and Opioid Overdose Deaths — United States, 2000–2014. MMWR. 2016 Jan;64(50):1378–82. doi: 10.15585/mmwr.mm6450a3. [DOI] [PubMed] [Google Scholar]
- 6.Unick GJ, Rosenblum D, Mars S, Ciccarone D. Intertwined epidemics: national demographic trends in hospitalizations for heroin-and opioid-related overdoses, 1993–2009. PLoS ONE. 2013 Feb;8(2):eS5496. doi: 10.1371/journal.pone.0054496. [DOI] [PMC free article] [PubMed] [Google Scholar]
- 7.Weiss A, Elixhauser A, Barrett M, Steiner CA, Bailey MK, O’Malley L. Opioid-Related Inpatient Stays and Emergency Department Visits by State, 2009–2014. HCUP Statistical Brief. 2016 Dec;:219. [Google Scholar]
- 8.Ronan MV, Herzig SJ. Hospitalizations related to opioid abuse/dependence and associated serious infections increased sharply, 2002–12. Health Affairs. 2016;35(5):832–7. doi: 10.1377/hlthaff.2015.1424. [DOI] [PMC free article] [PubMed] [Google Scholar]
- 9.Coben JH, Davis SM, Furbee PM, Sikora RD, Tillotson RD, Bossarte RM. Hospitalizations for poisoning by prescription opioids, sedatives, and tranquilizers. Am J Prev Med. 2010 May;38(5):517–24. doi: 10.1016/j.amepre.2010.01.022. [DOI] [PubMed] [Google Scholar]
- 10.Inocencio TJ, Carroll NV, Read EJ, Holdford DA. The economic burden of opioid-related poisoning in the United States. Pain Med. 2013 Oct;14(10):1534–47. doi: 10.1111/pme.12183. [DOI] [PubMed] [Google Scholar]
- 11.Meiman J, Tomasallo C, Paulozzi L. Drug and Alcohol Dependence. Drug Alcohol Depend. Elsevier Ireland Ltd. 2015 Jul 1;152:177–84. doi: 10.1016/j.drugalcdep.2015.04.002. [DOI] [PubMed] [Google Scholar]
- 12.Slavova S, Bunn TL, Talbert J. Drug overdose surveillance using hospital discharge data. Public Health Rep. 2014 Sep;129(5):437–45. doi: 10.1177/003335491412900507. [DOI] [PMC free article] [PubMed] [Google Scholar]
- 13.Agency for Healthcare Research, Quality. HCUP Cost-to-Charge Ratio (CCR) Files. Healthcare Cost and Utilization Project (HCUP); Rockville, MD: 2001–2011. [Google Scholar]
- 14.Analysis USBOE. National Income and Product Account Tables, Table 1.1.4 Price Indexes for Gross Domestic Product [Internet] www.bea.gov. [cited 2015 Sep 23]. Available from: http://www.bea.gov/iTable/iTable.cfmReqID=9&step=1#reqid=9&step=1&isuri=1.
- 15.Elixhauser A, Steiner C, Harris DR, Coffey RM. Comorbidity measures for use with administrative data. Med Care. 1998 Jan;36(1):8–27. doi: 10.1097/00005650-199801000-00004. [DOI] [PubMed] [Google Scholar]
- 16.Nielsen S, Larance B, Degenhardt L, Growing L, Kehler C, Lintzeris N. Opioid agonist treatment for pharmaceutical opioid dependent people. Cochrane Database of Systematic Reviews. 2016;5:CD011117. doi: 10.1002/14651858.CD011117.pub2. [DOI] [PubMed] [Google Scholar]
- 17.Dugosh K, Abraham A, Seymour B, McLoyd K, Chalk M, Festinger D. A systematic review on the use of psychosocial interventions in conjunction with medications for the treatment of opioid addiction. J Addict Med. 2016;10(2):91–101. doi: 10.1097/ADM.0000000000000193. [DOI] [PMC free article] [PubMed] [Google Scholar]