

Abstract
Temperature-sensitive liposomal formulations of chemotherapeutics, such as doxorubicin, can achieve locally high drug concentrations within a tumor and tumor vasculature while maintaining low systemic toxicity. Further, doxorubicin delivery by temperature-sensitive liposomes can reliably cure local cancer in mouse models. Histological sections of treated tumors have detected red blood cell extravasation within tumors treated with temperature-sensitive doxorubicin and ultrasound hyperthermia. We hypothesize that the local release of drug into the tumor vasculature and resulting high drug concentration can alter vascular transport rate constants along with having direct tumoricidal effects. Dynamic contrast enhanced MRI (DCE-MRI) coupled with a pharmacokinetic model can detect and quantify changes in such vascular transport rate constants. Here, we set out to determine whether changes in rate constants resulting from intravascular drug release were detectable by MRI. We found that the accumulation of gadoteridol was enhanced in tumors treated with temperature-sensitive liposomal doxorubicin and ultrasound hyperthermia. While the initial uptake rate of the small molecule tracer was slower in treated compared to untreated tumors (k1 = 0.0478 ± 0.011 s-1 versus 0.116 ± 0.047 s-1), the tracer was retained after treatment due to a larger reduction in the rate of clearance (k2 = 0.291 ± 0.030 s-1 versus 0.747 ± 0.24 s-1). While DCE-MRI assesses a combination of blood flow and permeability, ultrasound imaging of microvascular flow rate is sensitive only to changes in vascular flow rate; based on this technique, blood flow was not significantly altered 30 minutes after treatment. In summary, DCE-MRI provides a means to detect changes that are associated with treatment by thermally-activated particles and such changes can be exploited to enhance local delivery.
Keywords: DCE-MRI, Doxorubicin, Liposomes, Hyperthermia, Vascular permeability
1. Introduction
Successful chemotherapy requires sufficient drug accumulation in cancerous lesions while minimizing off-target accumulation. Temperature-sensitive liposomal formulations of chemotherapeutics can reduce systemic toxicity as compared with free drug, while simultaneously achieving lethal concentrations within a tumor via localized release within the tumor vasculature [1-5]. Such a strategy overcomes issues associated with the limited accumulation of nanotherapeutics through the enhanced permeability and retention effect [4]. We have previously developed strategies to improve the in vivo stability of doxorubicin-loaded liposomes, including a remote loading strategy utilizing copper gluconate and triethanolamine (TEA) to load temperature-sensitive liposomes (DoxTSLs) [3] and long-circulating liposomes [6]. Doxorubicin has also been encapsulated in temperature-sensitive liposomes using ammonium sulfate remote loading (AsDoxTSLs) and these particles are in clinical trials for liver and breast cancer treatment [7]. DoxTSLs, in combination with ultrasound (US)-induced hyperthermia, have been previously shown to result in complete regression of local tumors while maintaining a favorable toxicity profile [1-3]. In addition to facilitating the release of doxorubicin from the liposome, hyperthermia increases perfusion [8] and drug extravasation and penetration [5, 9] while sensitizing cells to drug-mediated toxicity [10]. US-induced hyperthermia further limits systemic toxicity by generating focal temperature increases with spatial selectivity [11].
The sustained and enhanced free doxorubicin concentrations within tumor vasculature achieved by local release are hypothesized to further alter vascular permeability and perfusion [1, 12, 13]. Our previous work demonstrated red blood cell extravasation immediately following treatment with an optimized protocol involving DoxTSLs [3]. In addition to aiding the design of an optimal drug delivery strategy, alterations in vascular permeability arising from treatment can potentially be used to estimate treatment success. Estimating the effects of chemotherapeutics on tumor tissue is especially challenging shortly after treatment. Thus, having a quantifiable surrogate measure available, such as changes in perfusion or permeability, could be beneficial. Vascular permeability has previously been used to differentiate malignant tissue from surrounding benign regions, stage malignancies [14] and predict treatment outcome [15, 16].
Effective vascular transport of molecules into tissue can be quantified when dynamic contrast enhanced MRI (DCE-MRI) data are analyzed with a pharmacokinetic model [17]. DCE-MRI analysis is based on a series of acquisitions, where gradient echo sequences are often used to provide sufficient temporal resolution and adequate signal level. T1-weighted (T1w) images are acquired before and for several minutes after an intravenous (IV) injection of gadoteridol [18]. The increase in signal over the time course of T1w images is quantified as the tracer travels through the vasculature and extravasates into tissue. The properties of the tracer, including hydrodynamic size and hydrophilicity, can be chosen to mimic drugs of interest or to paint a more general picture of vascular permeability and perfusion. Further, the concentration of gadoteridol can be derived for each T1w image if the chelate's longitudinal relaxivity and the pre-contrast T1 value of the tissue are known [19]. This concentration-versus-time curve and the arterial-input function (AIF) are input to a pharmacokinetic (PK) model, the simplest being a two-compartment model which consists of tissue and blood plasma compartments. The output of the PK model includes rate constants, which quantify a tracer's kinetics into and out of a tissue compartment. The PK output provides a composite measure of the permeability of the tissue vasculature, perfusion [20, 21] and the extravascular-extracellular space [22-24]. Changes in the rate constants of the tracer correlate with alterations in tissue properties and therefore DCE-MRI can be used to assess drug efficacy and predict treatment outcome [16, 25-29].
The permeability and perfusion data provided by DCE-MRI are complemented by the quantitative measure of perfusion provided by contrast-enhanced ultrasound imaging. Microbubbles, typically lipid-shelled vesicles of 1 to 5 μm in diameter and containing a perfluorocarbon gas core, are much larger than gadolinium chelates (typically 0.5 – 25 kDa). As a result of their large diameter, microbubbles are entirely contained within the tumor microvasculature. Specially-designed ultrasound pulse sequences detect their location non-invasively in order to map a tumor's microvascular structure in vivo [30, 31]. Furthermore, destroying microbubbles via a high intensity ultrasound pulse within a volume of interest and measuring the time required for reperfusion to occur is applied to locally map vascular flow rate [31-34]. Thus, the combination of DCE-MRI, which quantifies vascular permeability and perfusion, and ultrasound imaging, which strictly measures local microvascular flow rate, can be applied to separate the effects of vascular flow rate and permeability.
A third complementary imaging modality for probing permeability is fluorescence imaging of selected tracers. Fluorescence can directly and non-invasively probe the quantity of drug delivered to a tissue for a fluorescent drug, such as doxorubicin, as previously shown in [1, 3, 6]. In addition, fluorescence imaging of conjugates, such as albumin bound to a fluorescent dye, can be applied to image the extravasation and accumulation of larger molecules [35]. Albumin is typically retained within the vasculature to maintain osmotic pressure, thus its extravasation is a widely-used measure of alterations in permeability [36-38].
In this study, we applied DCE-MRI to non-invasively assess vascular changes induced by intravascular release of drug from circulating DoxTSLs under local US-hyperthermia. The contributions of vascular permeability and perfusion to the observed change in gadoteridol kinetics were further examined by studying the accumulation of fluorescently-labeled albumin and the kinetics of microbubble reperfusion following microbubble destruction.
2. Materials and Methods
2.1 Materials
1,2-dipalmitoyl-sn-glycero-3-phosphocholine (DPPC), 1-palmitoyl-2-hydroxy-sn-glycero-3-phosphocholine (MPPC), 1,2-dipalmitoyl-sn-glycero-3-phosphate (DPPA), 1,2 distearoyl-sn-glycero-3-phosphoethanolamine-N-Methoxypolyethyleneglycol-2000 (DSPE-PEG2k), and 1,2-dipalmitoyl-sn-glycero-3-phosphoethanolamine-N-Methoxypolyethyleneglycol-5000 (DPPE-PEG5k) were obtained from Avanti Polar Lipids Inc. (Alabaster, AL). Doxorubicin hydrochloride (USP grade), fatty acid- and globulin-free bovine serum albumin, copper (II) gluconate, ammonium sulfate, and triethanolamine (TEA) were purchased from Sigma (St. Louis, MO). Prohance was purchased from Merry X-Ray (Sacramento, CA). IRDye 800CW NHS ester was obtained from LI-COR Biosciences (Lincoln, NE). The neu deletion (NDL) metastatic mammary carcinoma cell line was obtained from the Alexander Borowsky Laboratory (UC Davis) [39, 40]. TCC-SUP tumorigenic human bladder cancer cells were obtained from the American Type Culture Collection (HTB-5, Manassas, VA).
2.2 Animals and in vivo procedures
All animal experiments were performed under a protocol approved by the Institutional Animal Care and Use Committee (IACUC) of the University of California, Davis. For the NDL tumor model, female FVB/n mice (Charles River, Wilmington, MA) were transplanted with fresh donor biopsy fractions of NDL syngeneic mammary carcinoma bilaterally into the #4 and #9 inguinal 1fat pads. Following transplantation, mice were palpated weekly to monitor tumor take, which equaled or exceeded 90%. The study began when tumors reached approximately 5 mm in greatest dimension. Forty-three NDL mice were injected with DoxTSLs and 4 with free doxorubicin (Free Dox), 12 NDL mice served as controls (no treatment), and 12 NDL mice served as US-induced hyperthermia only controls. In total, 29 NDL mice were imaged with DCE-MRI, including 21 treated and 8 control mice. In a small subsequent in vivo study with the TCC-SUP bladder cancer model (n=3), female athymic nude mice were injected subcutaneously into the right and left flank with 5 × 10⁶ TCC-SUP cells in 100 μL in 1:1 PBS: Matrigel (BD Biosciences, San Jose, CA).
2.3 Preparation of DoxTSLs
Lysolipid-based TSLs were assembled from DPPC:DSPE-PEG2k:MPPC (86:4:10, molar ratio). Liposomes were prepared by the hydration and extrusion method as described previously [6]. Lipids were dissolved in chloroform. The bulk of the chloroform was evaporated under a gentle stream of nitrogen gas and the residual chloroform was removed under vacuum overnight. The dried lipid was hydrated in 0.3 mL of either 250 mM ammonium sulfate (As) or 100 mM copper (II) gluconate including 540 mM TEA (pH 8.8) to form multi-lamellar AS or Cu liposomes, respectively. The liposomal solution at a final lipid concentration of 50 mg/mL was extruded above the phase transition temperature of the lipid mixture through a polycarbonate membrane with a pore diameter of 100 nm. The AS-loaded or Cu/TEA-loaded liposomes were separated from non-encapsulated AS or Cu/TEA by passing the extruded liposomal suspension through a spin column of Sephadex G-75 (5 × 1 cm, GE Healthcare, Biosciences, Piscataway, NJ) equilibrated with 20 mM HEPES/150 mM sodium chloride and saline (0.9% sodium chloride), respectively. The size distribution of liposomes was unimodal (Supplementary Figure S1A) with a mean diameter of 119 nm ± 39 nm as measured using a Malvern Zetasizer System (Malvern Instruments LTd. Malvern, UK). Lipid concentration was measured using the Phospholipids C assay kit (Wako Chemicals USA, Richmond, VA) according to manufacturer's instructions.
Doxorubicin was added to CuTSLs or AsTSLs at a drug-to-lipid ratio of 0.2:1 (wt:wt) and incubated at 37°C for 1.5 h. The resulting liposomes (DoxTSLs or AsDoxTSLs) were then separated from non-encapsulated doxorubicin using Sephadex G-75 spin columns. The purified DoxTSLs and AsTSLs were loaded with 0.2 mg doxorubicin per 1 mg lipid. Cryo-electron microscopy revealed a round unilamellar liposome with a diffuse structure of the CuDox complex uniformly distributed within liposomes for DoxTSLs [41]. This morphology was different from the needle-like precipitates found in AsDoxTSLs [42]. Both DoxTSLs and AsDoxTSLs released ∼90% of the encapsulated drug within 2 min at 42°C [1]. Although both liposomal preparations had a shelf stability of more than a month when stored at 6-8°C, they were used within one week from preparation with storage at 6-8°C.
2.4 Preparation of Definity-like microbubbles
DPPC, DPPA, and DPPE-PEG5k (82:10:8, molar ratio) in chloroform were added to a test tube. Chloroform was removed under N2 followed by evaporation under a vacuum for at least 2 h. A buffer diluent consisting of 0.9% NaCl: glycerol: propylene glycol (80:10:10, volume ratio) was added to the dried lipids to create a lipid concentration of 2.2 mM (2.5 mg/mL). The lipid suspension was mixed well above the phase transition temperature of the lipids (60°C) to form a milky solution of multilamellar vesicles. The suspension was sonicated to clarity using a bath sonicator (40 kHz, 130 W, 15 min). The lipid solution was aliquoted in 1.5 mL per 2-mL vials. Decafluorobutane gas (10 cm3) was slowly injected into the vial through the rubber cap and air was exchanged using a needle (20G1, short Bevel, Becton-Dickinson) as a vent. The vial was immediately capped using an aluminum seal on the rubber cap. The sealed vial containing the liposome solution with the decafluorobutane headspace was stored at 4°C until use. Microbubbles were formed via mechanical agitation of the vials of liposome solution using a VialMix shaker. Upon shaking the vial for 45 seconds, the solution became milky, and was then drawn into a 3-mL syringe and diluted to a final volume of 3 mL using 10 mM phosphate-buffered saline (PBS, pH 7.4). Quantification of particle concentration using an Accusizer (770A, Particle Sizing System, Santa Barbara, USA) indicated ∼1-5 × 10¹¹ microbubbles formed per milliliter of solution. The submicron-sized bubbles and the remaining liposomes were removed from the solution by flotation at 300 × g for 3 min. After 4 washes with PBS, the microbubbles had an average diameter of 1.64 ± 1.04 μm with mode and median of 1.44 and 1.44 μm, respectively (Supplementary Figure S1B).
2.5 Treatment Protocol
Bilateral tumors were grown until ∼5 mm (≥ 30 mm3) in longitudinal diameter. Animals were anesthetized with 3% isoflurane (in oxygen, flow rate: 2 L/min) and maintained at 1.5-2.0%. In groups receiving drug as schematically depicted in Figure 1A, each animal with bilateral NDL tumors was IV injected via a tail vein catheter with liposomal doxorubicin (∼6 mg Dox/kg body weight and ∼30 mg lipid/kg body weight) in 120-150 μL of saline or an equal volume of saline only (control) for a mouse body weight of 20-25 g, respectively. Injections were performed over a period of 20 seconds. For animals in the DoxTSLs + ultrasound (DoxTSLs+US), Free Dox + ultrasound (Free Dox+US), and the ultrasound-only (US) groups, one tumor per animal was insonified for 5 min at 42°C prior to administration of drug or saline, respectively; insonation was continued for an additional 20 min at 42°C post injection [3]. For MRI and ultrasound imaging, mice were imaged 30 min after treatment ended and both the insonified and contralateral tumors were imaged. In a subset of studies, DCE-MRI was also performed 24 hours before DoxTSL+US treatment. Gadoteridol (0.3 mmol/kg body weight) was injected in 60-75 μL of saline for mouse body weight of 20-25 g. For fluorescence imaging, mice were sacrificed at 20 minutes after treatment and ex vivo imaging performed.
Figure 1. Treatment scheme and timing of DCE-MRI relative to DoxTSL injection and ultrasound (US).
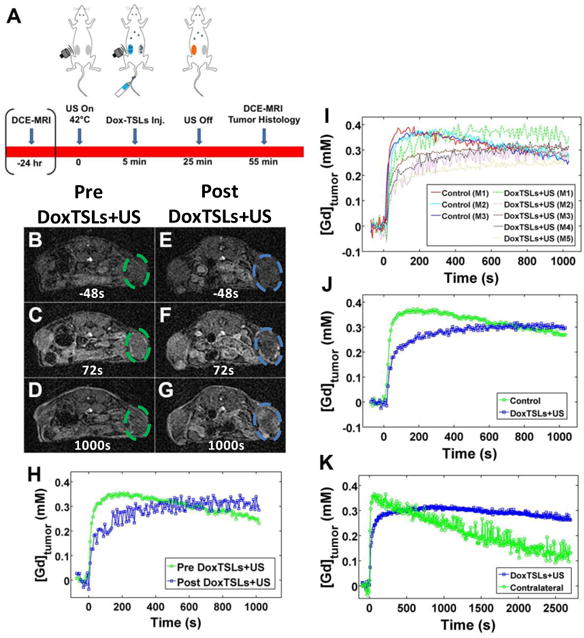
(A) Schematic diagram of NDL tumors treated with DoxTSLs and ultrasound (DoxTSLs+US) to trigger release of doxorubicin in the insonified tumors followed by DCE-MRI and histology. T1w image prior to drug treatment (B) 48 seconds before, (C) 72 seconds after, and (D) 1000 seconds after gadoteridol injection. T1w image of the same animal acquired from 30 to 70 min following treatment with DoxTSLs+US at (E) 48 seconds prior to, (F) 72 seconds after, and (G) 1000 seconds after gadoteridol injection. (H) DCE-MRI curves of the same animal pre (green) and post (blue) DoxTSLs+US treatment. (I) DCE-MRI tracer versus time curves over a period of 1000 seconds following bolus IV injection of gadoteridol. The initial wash-in of tracer is reduced in tumors treated with DoxTSLs+US (dashed lines) compared to control tumors (solid lines). DoxTSLs+US-treated tumors also exhibited a positive tracer versus time slope following initial wash-in. (J) Averaged DCE-MRI curves for control versus treated tumors. (K) DCE-MRI tracer versus time curves over an extended period for a single animal comparing the insonated tumor to the contralateral tumor. DCE-MRI was obtained in n = 29 mice, including 21 treated and 8 control mice.
The ultrasound pulses consisted of 100-cycle bursts at 1.54 MHz center frequency and 1.1 MPa peak negative pressure, with the variable pulse-repetition frequency (PRF) ranging from 100 Hz up to 5 kHz.
The ultrasound system used in this study was reported previously [43]. Briefly, it consisted of a Siemens Antares ultrasound scanner (Sonoline Antares, Siemens Medical Systems, Inc., Issaquah, WA), a custom dual-mode linear array transducer, and a PC equipped with a temperature control system. The dual-mode linear array transducer has three parallel arrays, including two outer arrays operating at 1.54 MHz for therapeutic application and one center array operating at 5.5 MHz for real-time imaging, as described previously [43, 44]. The two outer arrays are tilted at a 10.2° angle toward the centerline and result in a focal region at 35 mm in depth. During insonation, the therapeutic beam was swept in the azimuth dimension to fit the tumor dimensions. The tumor temperature feedback control was accomplished using a 30-gauge needle thermocouple (HYP-1, Omega Engineering, Inc., Stamford, CT), which was placed at the tumor rim and assuming a 1°C difference between the tumor center and tumor rim. The thermocouple was interfaced to a data acquisition system controlled by LabVIEW™ (National Instruments Co., Austin, TX) running on the PC. A proportional-integral-derivative (PID) controller was used to maintain the tumor temperature at 42°C by controlling the duty cycle of the acoustic pulses by varying the PRF. The PRF was communicated to the Antares through the Diagnostic User Interface (DUI), which is an Ethernet-based interface specific to the Siemens Antares that allows access to software and hardware variables in order to control the scanner. The animal's core temperature was monitored using a rectal thermocouple and was maintained at ∼37°C during the experiment.
2.6 MRI
A Bruker Biospec 70/30 (7T) small animal scanner (Bruker BioSpin MRI, Ettlingen, Germany) equipped with a 72 mm internal diameter, linearly polarized coil or a home-built surface coil was using in the DCE-MRI studies. Data were acquired and images were reconstructed using ParaVision 5.1 (Bruker BioSpin MRI). Parametric images were generated with either ParaVision 5.1 or MATLAB® (Mathworks, Natick, MA).
A T1 map (2D RARE sequence: RARE factor = 2, TR 250, 400, 600, 800, 1000, 1500, 3000, 5000 ms, TE = 20 ms, FOV = 4 × 2 cm2; MTX = 256 × 128, ST/SI = 1 mm/1 mm; 9 slices; BW = 81 kHz) was performed prior to the administration of gadoteridol for later use in deriving the gadolinium (Gd) concentration from the MR signal intensity. DCE-MRI acquisition began 1 min before the mouse was injected intravenously with 0.3 mmol/kg body weight gadoteridol on the MR bed via a tail vein catheter.
A series of T1w gradient echo images was acquired (FLASH; TE/TR/FA: 2.7ms/100ms/30°; FOV = 4 × 2 cm, matrix = 160 × 80; 11 slices; 140-300 repetitions) with a temporal resolution of 8 seconds. Gadoteridol was administered approximately 90 seconds after the start of the scan (0.3 μmol/g Prohance, IV bolus) and data were collected for ∼20-30 minutes. A region of interest (ROI) was drawn around the tumor and the mean signal intensity versus time was converted to gadolinium concentration versus time via the gradient echo signal equation (Eq. 1) and the relationship between gadoteridol concentration and observed longitudinal relaxation rate (Eq. 2) and using the previously measured T1 (=1/R1) value for each tumor and the relaxivity of gadoteridol in whole mouse blood.
| Equation 1 |
where S0 is the equilibrium magnetization, S(t) is the signal at time t, α is the flip angle, TR is the repetition time, and R1(t) = 1/T1(t) is the longitudinal relaxation rate at time t. R1(t) can be related to the relaxivity of Gd as:
| Equation 2 |
where R10 is the initial longitudinal relaxation rate (prior to contrast administration), r1 is the relaxivity of the Gd chelate, and [Gd](t) is the Gd concentration at time t. The contrast agent concentration versus time curve was used as an input in a two-compartment pharmacokinetic model according to the following equation:
| Equation 3 |
where Cp(t) and C1(t) is the tracer concentration in the blood plasma and tumor, respectively, at time t. k1 is the rate of tracer movement into the tissue (tumor) and k2 is the rate of tracer clearance from the tumor. A fit was obtained using pmod (PMOD Technologies Ltd, Zurich, Switzerland) software.
2.7 Preparation of near Infrared Fluorescent Albumin
A 2-mL solution of albumin at 2.5 mg (38 nmol) in PBS was added to 0.3 mL of potassium hydrogen phosphate (K2HPO4, pH 9). IRDye 800CW NHS ester (Ex:774 nm, Em:789 nm) dissolved in 0.1 mL double distilled water at the ratio of 1:10 and incubated at room temperature for 2 hours under gentle rotation was added to the albumin solution. The IRDye 800CW-labeled albumin was purified using a Sephadex G-25 column (5 × 1 cm, GE Healthcare, Biosciences, Piscataway, NJ) and lyophilized. The labeled albumin was equilibrated with PBS at a protein concentration of 5 mg/mL. The IRDye 800CW-to-albumin ratio ([A780/εdye]/[(A280-(0.03 × A780))/εAlbumin], εdye = 270,000 M-1cm-1, εAlbumin = 43,824 M-1cm-1) was calculated to be 0.91. The resulting IRDye 800 CW-labeled albumin has a similar circulation profile as that reported previously [38, 45], retaining 8% ID/cc (injected dose per cubic centimeter of blood) at 18-24 h post injection.
2.8 Albumin and Doxorubicin Fluorescence Imaging
Five minutes after the start of tumor insonation at 42°C and IV injection of DoxTSLs or saline, each NDL tumor mouse received an IV dose of 0.2 mg of IRDye 800 CW-labeled albumin in 40 μL PBS, via the tail vein. Tumor insonation was continued for another 20 min after the administration of DoxTSLs and albumin. At 20 minutes after treatment, the mouse was euthanized and both the insonated and contralateral tumors were removed. Ex vivo tumors were imaged and quantified by the Maestro™ hyperspectral imaging system (Cambridge Research & Instrumentation, Inc., Woburn, MA), using the blue Maestro filter set (500:10:720) with an exposure time of 1000 ms for doxorubicin fluorescence and the near infrared filter set (740:10:950) with an exposure time of 3548.61 ms for NIR conjugated albumin. The fluorescence signals were then unmixed from the auto-fluorescence in the image cube. An ROI was manually selected over the signal intensity and the intensity was recorded as average signal (photons/s/cm2). The albumin fluorescence studies involved a total of 11 mice across three groups (DoxTSLs+US, US only, control). Doxorubicin fluorescence was assessed without albumin injection in our previous work and shown to be increased in studies of DoxTSL+US [3] and here in a study of 6 additional mice.
2.9 Microbubble Perfusion Imaging
To evaluate and quantify tumor vascular perfusion after treatment, we employed a real-time parametric ultrasound imaging of vascular volume/density and flow rate implemented in the Acuson Sequoia® 512 system (Siemens Medical Solution USA, Inc., Issaquah, WA). After the region surrounding the tumor was shaved, each NDL tumor mouse was injected with microbubbles (∼1- 3 × 10⁹ microbubble/mL PBS) at 1.8 mL/h via a 27-gauge IV catheter to obtain a blood pool concentration of 106 microbubbles/mL. Each tumor was viewed with a 15L8-S linear array transducer operating at 7 MHz. Parametric maps of replenishment were acquired in real-time using Siemens Cadence Contrast Pulse Sequencing (CPS) system with CPS gain of -15 and mechanical index (MI) of 0.28. The system induced high-MI destructive pulses (center frequency of 7 MHz and MI of 1.9) to fragment microbubbles in the tumor region, then estimated the inflow of microbubbles over a 10-second duration and generated the corresponding parametric image. In the parametric image, yellow represents fast replenishment, pink represents very slow replenishment. The CPS images and the corresponding quantitative image were processed off-line in MATLAB® (Mathworks) to calculate the mean flow replenishment time and its distribution. In the post-processing algorithm, a ROI was manually selected to segment the tumor. Microbubble ultrasound studies involved 17 mice across a total of four groups (DoxTSLs+US, US only, DoxTSLs only, control).
2.10 Histology
Tumor samples were fixed in neutral buffered formalin. A Tissue-Tek VIP autoprocessor (Sakura, Torrance, CA) was used to process tumors which were then embedded in Paraplast paraffin (melting temperature 56-60 °C), sectioned to 4 μm and mounted on glass slides. Tumor sections were then stained using Mayer's hematoxylin and eosin (H&E) to facilitate histology and morphology evaluation.
2.11 Statistical Analysis
Statistical analyses were performed using Excel 11.0 (Microsoft, Seattle, WA). Data were recorded as mean ± standard deviation unless otherwise specified. A two-tailed Student's t-test was used to test for significance with a P value less than 0.05 indicating a statistically significant difference.
3. Results
3.1 Treatment with DoxTSLs and ultrasound augmented drug accumulation
Typical T1w images of an untreated NDL tumor during a DCE-MRI sequence (Figure 1B-D) show rapid enhancement followed by progressive signal drop as gadoteridol washes out of the tumor. Following DoxTSLs+US, the rate of enhancement is reduced; however, the signal steadily increases (Figure 1E-G). The slopes of the resulting DCE-MRI tracer-versus-time curves of the tumors before and after treatment reflect these changes in accumulation (Figure 1H, Supplementary Figure S2). Following the short initial wash-in period, control tumors exhibited a steady decline in tumor tracer concentration, shown by the negative slope (Figure 1I-J). Immediately following the bolus injection of gadoteridol, the tumor concentration was consistently reduced in tumors treated with DoxTSLs+US compared to control (Figure 1I). Further, tumors treated with DoxTSLs+US exhibited an upward slope in tumor tracer concentration after wash-in (Figure 1J). While the concentration of gadoteridol in drug-treated tumors initially increases more slowly compared to the contralateral tumor, it also decreases substantially more slowly. The tumor tracer concentration was elevated for more than 40 minutes (Figure 1K). Gadoteridol accumulation in tumors treated with an ultrasound and saline injection protocol in the absence of drug delivery was identical to the untreated tumors (Supplementary Figure S3). Tumor volume remained unchanged before and after treatment (Supplementary Figure S4).
3.2 Quantification of transport rate constants confirmed a reduced transport of Gd into and out of tumors post treatment with DoxTSLs+US
Using a two-compartment model (Figure 2A) with the DCE-MRI derived tracer versus time curves, we found a statistically significant decrease (Figure 2B) in the effective transport coefficient of Gd into the tumor, k1 for tumors treated with DoxTSLs+US compared to untreated tumors, from 0.116 ± 0.047s-1 to 0.0478 ± 0.011 s-1 (Table 1) indicating the rate of transfer of the tracer from the vasculature to the tumor was reduced. However, we also found a more than 2.5 fold reduction in k2, the effective transport coefficient out of, or clearance from the tumor, for tumors treated with DoxTSLs+US compared to untreated tumors: 0.747 ± 0.24 to 0.291 ± 0.030 (Figure 2C). This results in a statistically significant (p < 0.05) increase in the ratio of k1/k2 for tumors treated with DoxTSLs+US compared to untreated tumors: 0.162 ± 0.021 to 0.137 ± 0.013 suggesting that while the rate at which tracer enters the tumor is reduced following DoxTSLs+US, clearance is reduced to an even greater degree, resulting in a net increase in accumulation following treatment.
Figure 2. Quantification of Gd transport rate constants.
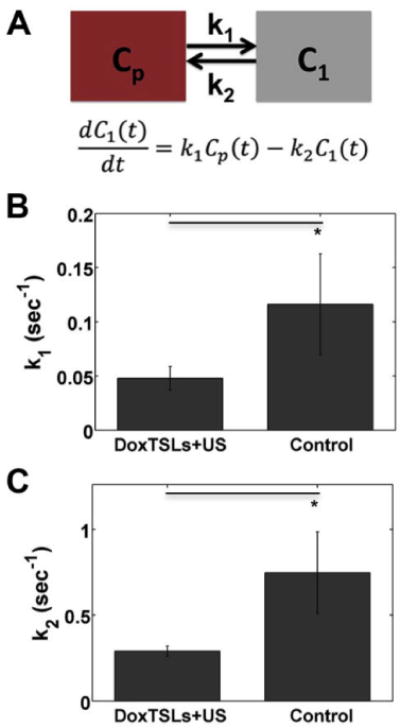
(A) Schematic and equation of the two compartment pharmacokinetic model used to fit the DCE-MRI curves. Cp is the blood plasma compartment, C1 is the tumor compartment, k1 is the rate constant for transport of tracer into the tumor and k2 is the rate constant for tracer clearance from the tumor. Mean (B) k1 and (C) k2 derived from the two compartment pharmacokinetic model of tumors treated with DoxTSLs+US versus no treatment control. DCE-MRI was obtained in n = 25 mice, including 17 treated and 8 control mice. Data are mean ± SD. * p < 0.05
Table 1.
Mean k1 and k2 values derived from DCE-MRI curves for tumors treated with DoxTSLs+US or control.
| DoxTSLs+US | Control | |
|---|---|---|
| k1 (s-1) | 0.0478 ± 0.011 | 0.116 ± 0.047 |
| k2 (s-1) | 0.291 ± 0.030 | 0.747 ± 0.24 |
3.3 Extravasation of red blood cells in tumors treated with DoxTSLs+US
Tumors treated with DoxTSLs+US exhibit hemorrhage throughout the tumor that is not observed in the contralateral tumor (Figure 3). Similarly, animals that received ultrasound hyperthermia only (no drug) did not show evidence of hemorrhage nor a significant change in the DCE-MRI tracer versus time curves (Figure 3, Supplementary Figure S3).
Figure 3. Altered shape of DCE-MRI curve is observed when hemorrhage is present on histological sections.
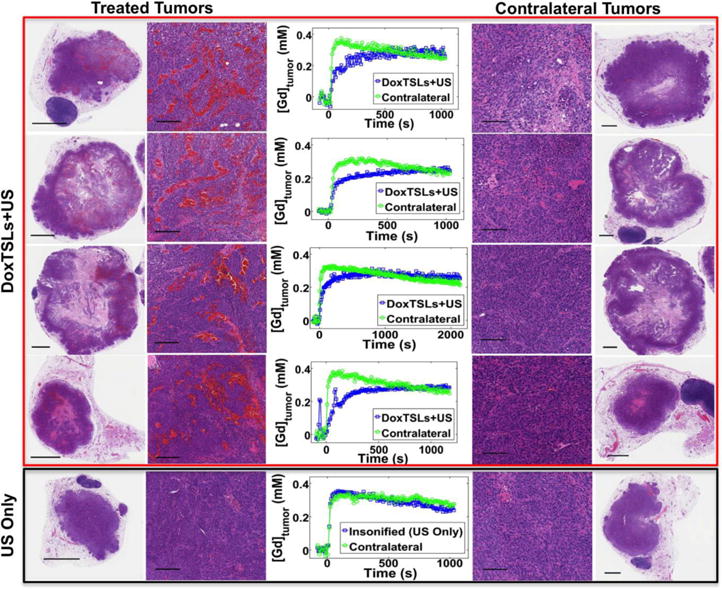
DCE-MRI curves of tumors treated with DoxTSLs+US and corresponding contralateral tumors along with whole tumor and magnified histological sections of those tumors. A representative tumor that received ultrasound hyperthermia only and its non-insonified contralateral tumor show similar DCE-MRI tracer versus time curves. The scale bar represents 1 mm on the whole tumor sections and 100 μm on the magnified sections.
Treated tumors were characterized by central zonal areas of necrosis and varying peritumoral inflammatory reactions. Treatment-related changes at two hours include areas of edema and hemorrhage. Intratumoral foci of hemorrhage were observed extensively in tumors treated with DoxTSLs+US and not in tumors treated with ultrasound hyperthermia in the absence of drug (Figure 4). Intratumoral hemorrhage was most prominent in tumors treated with DoxTSLs+USbut also found, to a lesser extent, in tumors treated with AsDoxTSLs+US. Hyperemia with minimal hemorrhage was observed in tumors treated with Free Dox+US (Figure 4 and Supplementary Figure S5). The histological sections shown in Figure 4 were acquired 2 hours following treatment (approximately 1-1.5 hours following imaging) and similar results were observed in sections acquired 20 minutes after DoxTSLs+US treatment (data not shown).
Figure 4. Magnified H&E sections of tumors receiving treatments compared to contralateral and control tumors at 2 hrs post treatment.
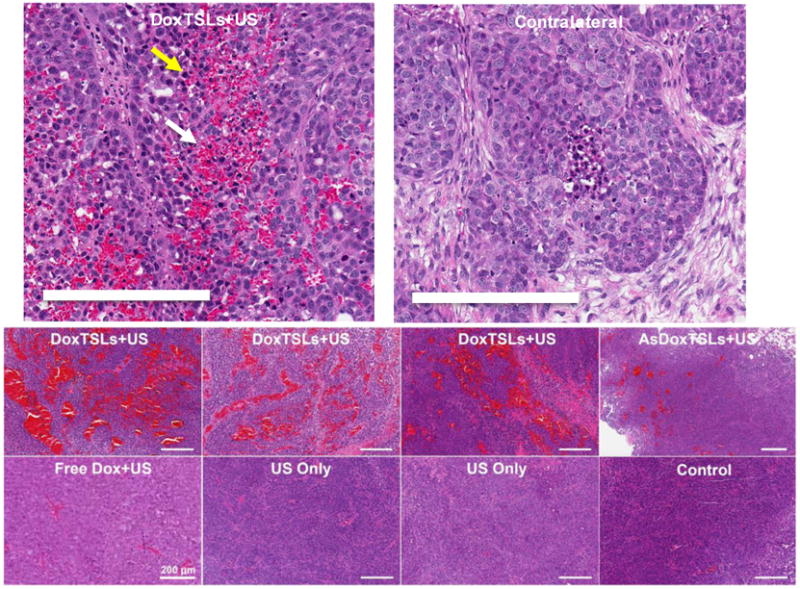
H&E sections of tumors treated with DoxTSLs+US, AsDoxTSLs+US, Free Dox+US, US only, and untreated control tumors. Hemorrhage is present in tumors treated with DoxTSLs+US, and to a lesser extent, in the tumor treated with AsDoxTSLs+US. Apoptotic cells (e.g. yellow arrow) are spatially coincident with hemorrhage (e.g. white arrow) in some tumors. Scale bars represent 200 μm in all images. H&E sectionswere obtained for n = 31 mice.
A small study in a subcutaneous human bladder tumor, implanted in a nude mouse, similarly found that changes in gadoteridol accumulation were detected after treatment with DoxTSLs+US (Supplementary Figure S6A-B). In this model, perfusion varied greatly between the outer tumor shell and inner core; however changes in accumulation were detected in both the entire tumor mass and the inner core. Treatment resulted in enhanced tumor cell necrosis within the inner core (Supplementary Figure S6C-D)
3.4 Vascular flow rate was not significantly altered by DoxTSLs+US treatment
No significant difference in tumor perfusion between DoxTSLs+US, DoxTSLs only, US only, and no treatment controls was detected using microbubble destruction and reperfusion imaging (Figure 5A-H). Ultrasound images acquired using B-mode and CPS were similar across all tumors (Figure 5B-G) regardless of the treatment protocol. Moreover, the time required for contrast agent replenishment after destruction, a measure of local flow rate, was not significantly different between any of the experimental groups (Figure 5H).
Figure 5. Vascular blood flow assessment by ultrasound contrast imaging.
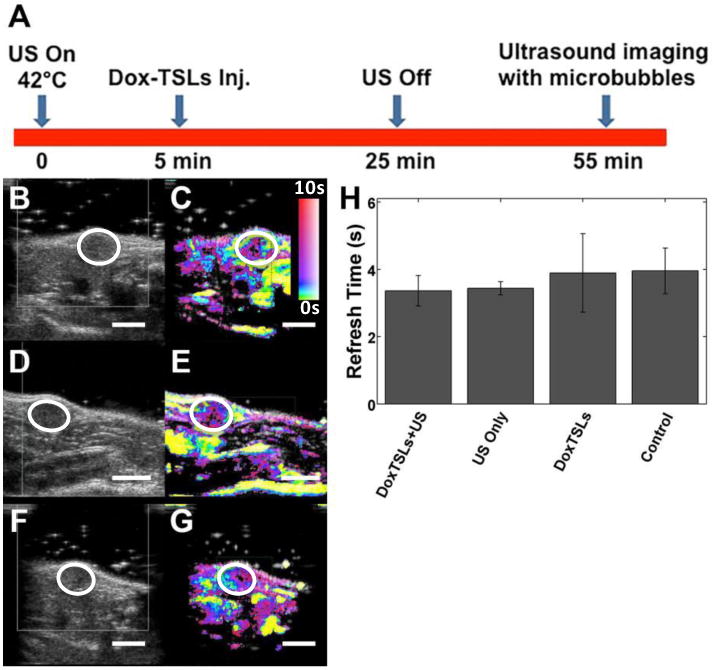
(A) The timeline of the treatment and contrast agent imaging relative to injection of DoxTSLs and insonation. The first column illustrates ultrasound (US) B-mode images of tumors treated with (B) DoxTSLs+US, (D) US only, or receiving (F) no treatment prior to the destruction of the microbubbles with the tumor position indicated by a white circle. The second column shows the corresponding CPS images of the (C) DoxTSLs+US, (E) US only, and (G) no treatment tumors. (H) Time required for replenishment of microbubbles into tumors (refresh time) following a microbubble destruction pulse across different treatments. Ultrasound imaging of perfusion was obtained for n= 17 mice.
3.5 Released doxorubicin accumulated in tumors treated with DoxTSL+US
We validated the accumulation of doxorubicin within the insonified tumors using optical imaging (Figure 6A). Bright regions indicative of doxorubicin fluorescence were localized to the insonated tumors and absent from the contralateral tumors (Figures 6B-G). Moreover, both the ex vivo spatial average and maximum doxorubicin fluorescence intensities were increased in tumors treated with DoxTSLs+US compared to the non-insonified contralateral tumors (Figure 6H-I, p<0.05).
Figure 6. Release and accumulation of doxorubicin in tumors treated with DoxTSLs and ultrasound (US) hyperthermia.
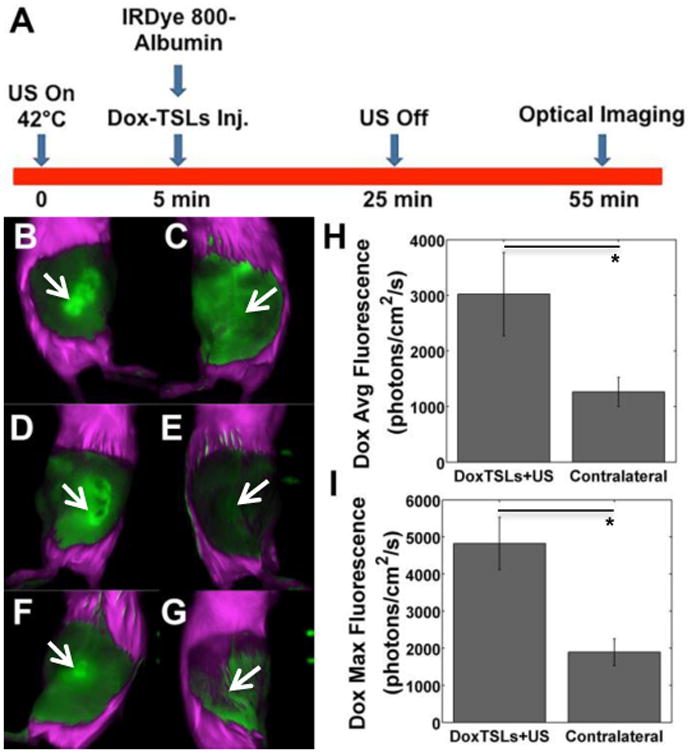
(A) Timing of the injection of IRDye-labeled albumin and DoxTSLs relative to in vivo fluorescence imaging and tumor insonation. In vivo doxorubicin fluorescence images of three tumors treated with (B, D, F) DoxTSLs+US versus (C, E, G) three non-insonified contralateral tumors illustrate the release of doxorubicin from liposomes with US. When quantified through ex vivo imaging, insonated tumors exhibited higher (H) spatial average and (I) spatial maximum doxorubicin fluorescence compared to contralateral tumors indicating significantly enhanced accumulation of free doxorubicin in insonated tumors. Doxorubicin fluorescence imaging was obtained in a total of n = 6 mice in addition to those imaged in Figure 7 with both doxorubicin and albumin. Arrows indicate position of tumor. * p < 0.05.
3.6 Accumulation of serum albumin was enhanced in insonified tumors treated
We then tested whether co-injected albumin would extravasate and accumulate within the treated tumors when DoxTSLs+US treatment was applied. We found co-localization of doxorubicin (Figure 7B) and NIR-conjugated albumin (Figure 7C) fluorescence in vivo and ex vivo (Figure 7D) in animals treated with DoxTSLs+US. The NIR fluorescence of insonified tumors was increased compared to the non-insonified contralateral tumors (Figure 7E, p<0.05); however, accumulation was similar in animals treated with ultrasound only and CuDox+US.
Figure 7. Co-accumulation of doxorubicin and albumin in tumors treated with Dox-TSLs+US.
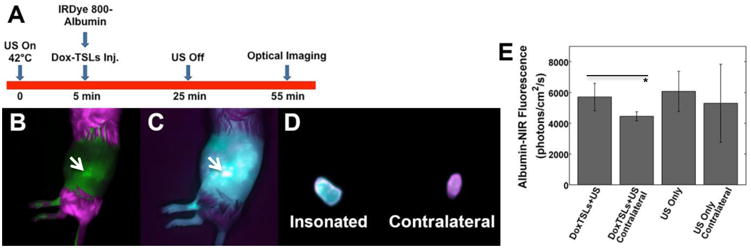
(A) Timing of the study and (B) in vivo doxorubicin fluorescence image of a tumor insonated after systemic administration of DoxTSLs and NIR fluorescent albumin. (C) The NIR signal (albumin fluorescence) in the same tumor in vivo, and (D) ex vivo comparison of the albumin accumulation in the (left) treated versus (right) contralateral tumor. (E) Tumors receiving DoxTSLs+US exhibited a higher albumin fluorescence signal than their non-insonified contralateral controls. Coincident albumin and doxorubicin fluorescence imaging was obtained in a total of n = 11 mice. p<0.05 on t-test. Arrow indicates tumor.
4. Discussion
Our overall goal is to create activatable particles that maximize efficacy and minimize systemic toxicity. Other such activatable constructs have been reported previously, including other temperature sensitive vehicles and bio-activatable constructs [4, 5, 46-48]. In this study, DoxTSLs released doxorubicin directly in the tumor microvasculature as a result of thermal activation by US-induced hyperthermia. We applied this protocol in a mouse model in which we have previously demonstrated that it produces a reliable cure for local cancers [3]. The results indicate that in both the syngeneic epithelial mouse model of breast cancer and the subcutaneous model of bladder cancer, DCE-MRI consistently detected changes in exchange coefficients that were associated with treatment involving hyperthermia and doxorubicin delivery using temperature sensitive liposomes. Other studies have co-loaded an imaging probe (e.g. manganese or gadolinium) with doxorubicin or co-injected particles containing contrast agents (e.g. iron) in order to assess the release and accumulation of the drug [48, 49]. Co-injection of such an imaging probe has the advantage of providing the opportunity to directly assess variations in drug concentration within a tumor. Still, there are disadvantages of such techniques. Co-loading of an imaging agent with a drug can influence the loading or stability of the particle and require development of a secondary formulation. Further, prolonged retention of unreleased Gd in the liver and spleen could present a translational concern [49]. Alternatively, co-injection of particles containing iron has the potential to impact temperature maps used in MRI-based procedures. Therefore, here we sought to detect physiological changes associated with hyperthermia and potentially with drug delivery. DCE-MRI may find use in other preclinical studies of activatable drug delivery or early clinical trials of such techniques.
4.1 Image-guided delivery
The DCE-MRI curves showed a marked reduction in the effective transport coefficient into the tumor manifested as the smaller initial jump in tracer concentration after injection. This is further evidenced by the significant decrease in the value of k1 in tumors treated with DoxTSLs+US compared to untreated tumors. A reduction in the effective transport coefficients, derived from the DCE-MRI data via a two-compartment pharmacokinetic model, may be interpreted as either a reduction in the vascular permeability, a reduction in the effective vascular surface area available for exchange, or a combination of the two. A reduction in the effective rate of transfer from the plasma to the tumor tissue may seem undesirable, as it limits the rate at which the tracer – or drug – can enter the tumor from the vasculature. However, the DCE-MRI curves also demonstrate that the effective transport coefficient out of the tumor is reduced further. Indeed, the rate of clearance from the tumor, k2, is reduced by more than 2.5-fold in DoxTSLs+US treated tumors compared to control tumors. This is seen as the slow increase in tracer concentration followed by a gradual decrease in concentration when examined for an extended period of time. Thus, although the effective transport coefficient into the tumor is reduced, the clearance out of the tumor tissue is reduced to an even greater extent.
The alteration in tracer kinetics following DoxTSLs+US observed with DCE-MRI could be attributable to changes in either perfusion or permeability. To explore which of these factors was responsible, we performed a perfusion study using microbubble destruction and reperfusion. If the effect were due to alterations in perfusion, we would expect to see an increase in the refresh time of the microbubbles following initial destruction. However, we found no significant difference in microbubble refresh time between any of the groups 30 min after treatment, which suggests that tumor perfusion is not primarily responsible for the observed changes on the DCE-MRI curves. Rather, the similarity in perfusion between groups suggests changes in effective vascular permeability and tumor clearance are a factor in the reduction in tracer movement into and out of the tumor. However, the resolution of ultrasound may not be sufficient to fully visualize the heterogeneity of blood flow in the tumor. Given that the alterations in vascular permeability were likely drug-mediated, we hypothesize that the extravasation of red blood cells is short-lived, occurring when the local drug concentration within the vasculature is high and the tumor is exposed to hyperthermia.
4.2 Mechanism
We have previously evaluated the changes in the accumulation of albumin and nanoparticles with hyperthermia [50]. When albumin was injected during hyperthermia, its extravasation and accumulation increased by approximately 50%; however, the accumulation was not enhanced by drug treatment and therefore appears to be determined by the hyperthermia protocol. As expected, doxorubicin accumulation was enhanced due to the release of the drug within the treated tumor. With temperature-sensitive delivery of doxorubicin, drug accumulation within the endothelium and tumor is rapid and substantial [3-5, 48].
Hemorrhage observed on H&E sections of tumors treated with DoxTSLs+US is suggestive of endothelial injury. Hemorrhage was observed only in tumors treated with DoxTSLs+US. Further, we previously demonstrated that this effect was only observed in tumors that were preheated to 42°C prior to administration of DoxTSLs [3]. Apoptotic cells that are spatially coincident with the extravascular red blood cells suggest that the high concentration of doxorubicin or the associated changes in blood chemistry after release from the liposomes could be directly and immediately cytotoxic to cells that are already sensitized by hyperthermia. This gross change in permeability, sufficient to permit extravasation of large numbers of red blood cells, is consistent with the large change we observe on DCE-MRI curves and consistent with the substantial reduction in clearance found using a two-compartment pharmacokinetic model.
The exact mechanism for the change in the effective transport coefficients observed with MRI 30-70 minutes after treatment with DoxTSLs is not fully characterized. Unlike studies of microbubble-mediated vascular bioeffects, quantitative ultrasound contrast imaging did not detect changes in volume flow rate within the tumor [51, 52]; however, given the heterogeneity of flow observed, a small reduction in flow would be difficult to detect. In the absence of drug treatment, hyperthermia, combined with saline injection, did not result in changes in the transport coefficients or in red blood cell extravasation. While the typical mechanism of doxorubicin toxicity involves intercalation with DNA and resulting cell death during rapidly-dividing cell cycle (and thus over several days), biological effects related to therapy were observed here within minutes. We hypothesize that exposing endothelial and cancer cells to hyperthermia prior to administration of drug sensitizes cells to therapy [3]. Alternatively, changes in the vascular osmolarity resulting from the rapid drug release and exposure to hyperthermia could also impact the endothelium and alter vascular volume or flow rate.
Similar changes in the DCE-MRI tracer versus time curves have also been observed following vascular damage caused by microbubble destruction in [53]. In addition to a reduction in both the wash-in and wash-out rates, the authors of that study also found corresponding hemorrhage on histological sections suggesting vascular damage similar to that observed in this study. Our laboratory has also previously assessed the changes in blood flow associated with microbubble-based therapy and demonstrated mechanical damage to endothelial cells and platelet-mediated changes in blood flow [51, 52, 54]. However, in the work presented here microbubbles are absent and the ultrasound pressure is below the threshold to produce mechanical damage. Therefore, the mechanism for such changes in permeability are distinct and this is the first time, to our knowledge, that DCE-MRI was used to quantify changes caused by release of an activatable drug particle. Alternatively, we have also investigated the combination of long-circulating doxorubicin liposomes with ultrasound hyperthermia or ablation and the red blood cell extravasation observed here after treatment was not detected [50, 55].
Doxorubicin was loaded into TSLs using two different loading methods, the ammonium sulfate method and the copper gluconate/TEA method. In the latter formulation, a complex was formed between doxorubicin and copper within the core of TSLs to stabilize drug, which in turn improved drug circulation time and reduced systemic toxicity [6]. Hemorrhage was observed with both methods; however, the frequency of red blood cell extravasation was less for treatments involving the ammonium sulfate method, which may be attributed to the higher in vivo stability obtained with the copper gluconate/TEA method resulting in greater drug availability within the tumor vasculature. It is also feasible that the small mass of copper contained within the liposomes enhances the endothelial damage. We have recently shown that the copper-doxorubicin complex can be internalized intact by endothelial and cancer cells [1]. Further, we demonstrated that the complex is disassociated over time and the copper is excreted. The loading of copper and doxorubicin at a 1:2 ratio, results in a mass ratio of ∼1:17 within liposomes and, therefore, we anticipate that the biological effect of doxorubicin will be dominant. However, additional studies are required to further define the mechanism.
4.3 Biological effects of red blood cell extravasation
Red blood cell extravasation and gradual breakdown and clearance as a result of DoxTSL+US treatment were observed previously [3], with hemosiderin-laden macrophages engulfing and clearing the debris. Red blood cell-macrophage cross talk has been associated with a shift in macrophage phenotype toward M1 and thus can be considered to have a positive and tumoricidal effect in cancer treatment [56, 57]. This immune component may be synergistic with the enhanced delivery observed here.
Conclusion
Localized release of doxorubicin from temperature sensitive liposomes was accomplished within tumors as a result of ultrasound-induced temperature increases. We found the effective transport coefficients between the vasculature and tumor were altered in the region coincident with the drug release and the concentration of an imaging probe increased as a result of treatment. DCE-MRI shows potential to detect and map the local changes in transport and thus validate a successful treatment protocol.
Supplementary Material
Supplementary Fig. S1. Size distribution of liposomes and gas-filled microbubbles. (A) Size distribution of liposomes with an average diameter of 119 ± 39 nm. (B) Microbubble concentration versus diameter with a mean diameter of 1.69 μm.
Supplementary Fig. S2. DCE-MRI before and after DoxTSLs injection and insonation of NDL tumors. (A-D) DCE-MRI tracer versus time curves immediately before and over a period of approximately 1000 seconds after bolus intravenous injection of gadoteridol prior to (green) and following (blue) treatment with DoxTSLs+US obtained for 4 different mice. The initial wash-in of tracer is reduced in tumors post treatment with DoxTSLs+US. Following the initial wash-in, accumulation of tracer was augmented for all tumors treated with DoxTSLs+US.
Supplementary Fig. S3. DCE-MRI following tumor hyperthermia comparing insonated tumors with non-insonified contralateral tumors. No significant difference was observed between the time-course of tumor gadolinium obtained for insonated NDL tumors and non-insonated contralateral tumors.
Supplementary Fig. S4. Tumor volume before and after treatment. The difference was not statistically significant (n.s.).
Supplementary Fig. S5. Treatment with Free Dox+US did not alter the shape of DCE-MRI curve. DCE-MRI curves of the tumor treated with Free Dox+US and the corresponding contralateral tumor along with the H&E-stained histological sections of whole tumors and magnified sections of tumors. DCE-MRI tracer versus time curves were similar for the tumor treated with Free Dox+US and the contralateral tumor that did not receive ultrasound hyperthermia. The scale bar represents 1 mm on the whole tumor sections and 100 μm on the magnified sections.
Supplementary Fig. S6. DCE-MRI of human bladder cancer TCC-SUP tumors and the corresponding histological sections of tumors treated with DoxTSLs+US. A, B) Gd concentration versus time curves obtained for TCC-SUP tumor treated with DoxTSLs+US versus non-insonated contralateral tumor (A); and those obtained for the core of treated tumor versus non-insonified contralateral tumor (B). Gd concentration over time was reduced in the core of tumor treated with DoxTSLs due to treatment-induced necrosis. Tumors were treated with eight repeated administrations of DoxLTSLs+US, twice a week for a period of 4 weeks. C, D) H&E of whole TCC-SUP tumor sections treated with DoxTSLs+US. Scale bars are 2 mm.
Acknowledgments
This study was funded by NIHR01CA103828, NIHR01CA134659, NIHR01CA210553, NIHR01 CA199658 and NIHR01CA112356.
References
- 1.Kheirolomoom A, Ingham ES, Commisso J, Abushaban N, Ferrara KW. Intracellular trafficking of a pH-responsive drug metal complex. Journal of Controlled Release. 2016;243:232–242. doi: 10.1016/j.jconrel.2016.10.012. [DOI] [PMC free article] [PubMed] [Google Scholar]
- 2.Kheirolomoom A, Ingham ES, Mahakian LM, Tam SM, Silvestrini MT, Tumbale SK, Foiret J, Hubbard NE, Borowsky AD, Murphy WJ, Ferrara KW. CpG expedites regression of local and systemic tumors when combined with activatable nanodelivery. J Control Release. 2015;220:253–264. doi: 10.1016/j.jconrel.2015.10.016. [DOI] [PMC free article] [PubMed] [Google Scholar]
- 3.Kheirolomoom A, Lai CY, Tam SM, Mahakian LM, Ingham ES, Watson KD, Ferrara KW. Complete regression of local cancer using temperature-sensitive liposomes combined with ultrasound-mediated hyperthermia. J Control Release. 2013;172:266–273. doi: 10.1016/j.jconrel.2013.08.019. [DOI] [PMC free article] [PubMed] [Google Scholar]
- 4.Kong G, Anyarambhatla G, Petros WP, Braun RD, Colvin OM, Needham D, Dewhirst MW. Efficacy of Liposomes and Hyperthermia in a Human Tumor Xenograft Model: Importance of Triggered Drug Release. Cancer Research. 2000;60:6950–6957. [PubMed] [Google Scholar]
- 5.Manzoor AA, Lindner LH, Landon CD, Park JY, Simnick AJ, Dreher MR, Das S, Hanna G, Park W, Chilkoti A, Koning GA, ten Hagen TL, Needham D, Dewhirst MW. Overcoming limitations in nanoparticle drug delivery: triggered, intravascular release to improve drug penetration into tumors. Cancer Res. 2012;72:5566–5575. doi: 10.1158/0008-5472.CAN-12-1683. [DOI] [PMC free article] [PubMed] [Google Scholar]
- 6.Seo JW, Mahakian LM, Kheirolomoom A, Zhang H, Meares CF, Ferdani R, Anderson CJ, Ferrara KW. Liposomal Cu-64 labeling method using bifunctional chelators: poly(ethylene glycol) spacer and chelator effects. Bioconjug Chem. 2010;21:1206–1215. doi: 10.1021/bc100018n. [DOI] [PMC free article] [PubMed] [Google Scholar]
- 7.Phase 1/2 study of ThermoDox with approved hyperthermia in treatment of breast cancer recurrence at the chest wall (DIGNITY) National Library of Medicine (US); Bethesda (MD): 2000. http://www.clinicaltrials.gov/ct2/show/NCT00826085. [Google Scholar]
- 8.Karino T, Koga S, Maeta M. Experimental studies of the effects of local hyperthermia on blood flow, oxygen pressure and pH in tumors. Jpn J Surg. 1988;18:276–283. doi: 10.1007/BF02471444. [DOI] [PubMed] [Google Scholar]
- 9.Kusumoto T, Maehara Y, Baba H, Takahashi I, Kusumoto H, Ohno S, Sugimachi K. Sequence dependence of the hyperthermic potentiation of carboplatin-induced cytotoxicity and intracellular platinum accumulation in HeLa cells. Br J Cancer. 1993;68:259–263. doi: 10.1038/bjc.1993.324. [DOI] [PMC free article] [PubMed] [Google Scholar]
- 10.Issels RD. Hyperthermia adds to chemotherapy. Eur J Cancer. 2008;44:2546–2554. doi: 10.1016/j.ejca.2008.07.038. [DOI] [PubMed] [Google Scholar]
- 11.Staruch R, Chopra R, Hynynen K. Localised drug release using MRI-controlled focused ultrasound hyperthermia. Int J Hyperthermia. 2011;27:156–171. doi: 10.3109/02656736.2010.518198. [DOI] [PubMed] [Google Scholar]
- 12.Yamaç D, Elmas Ç, Özoğul C, Keskil Z, Dursun A. Ultrastructural Damage in Vascular Endothelium in Rats Treated with Paclitaxel and Doxorubicin. Ultrastructural Pathology. 2006;30:103–110. doi: 10.1080/01913120500406335. [DOI] [PubMed] [Google Scholar]
- 13.Wolf MB, Baynes JW. The anti-cancer drug, doxorubicin, causes oxidant stress-induced endothelial dysfunction. Biochimica et Biophysica Acta (BBA) - General Subjects. 2006;1760:267–271. doi: 10.1016/j.bbagen.2005.10.012. [DOI] [PubMed] [Google Scholar]
- 14.Hara N, Okuizumi M, Koike H, Kawaguchi M, Bilim V. Dynamic contrast-enhanced magnetic resonance imaging (DCE-MRI) is a useful modality for the precise detection and staging of early prostate cancer. Prostate. 2005;62:140–147. doi: 10.1002/pros.20124. [DOI] [PubMed] [Google Scholar]
- 15.Pickles MD, Manton DJ, Lowry M, Turnbull LW. Prognostic value of pre-treatment DCE-MRI parameters in predicting disease free and overall survival for breast cancer patients undergoing neoadjuvant chemotherapy. Eur J Radiol. 2009;71:498–505. doi: 10.1016/j.ejrad.2008.05.007. [DOI] [PubMed] [Google Scholar]
- 16.Yankeelov TE, Lepage M, Chakravarthy A, Broome EE, Niermann KJ, Kelley MC, Meszoely I, Mayer IA, Herman CR, McManus K, Price RR, Gore JC. Integration of quantitative DCE-MRI and ADC mapping to monitor treatment response in human breast cancer: initial results. Magn Reson Imaging. 2007;25:1–13. doi: 10.1016/j.mri.2006.09.006. [DOI] [PMC free article] [PubMed] [Google Scholar]
- 17.Ferrier MC, Sarin H, Fung SH, Schatlo B, Pluta RM, Gupta SN, Choyke PL, Oldfield EH, Thomasson D, Butman JA. Validation of dynamic contrast-enhanced magnetic resonance imaging-derived vascular permeability measurements using quantitative autoradiography in the RG2 rat brain tumor model. Neoplasia. 2007;9:546–555. doi: 10.1593/neo.07289. [DOI] [PMC free article] [PubMed] [Google Scholar]
- 18.Leach MO, Morgan B, Tofts PS, Buckley DL, Huang W, Horsfield MA, Chenevert TL, Collins DJ, Jackson A, Lomas D, Whitcher B, Clarke L, Plummer R, Judson I, Jones R, Alonzi R, Brunner T, Koh DM, Murphy P, Waterton JC, Parker G, Graves MJ, Scheenen TWJ, Redpath TW, Orton M, Karczmar G, Huisman H, Barentsz J, Padhani A. Imaging vascular function for early stage clinical trials using dynamic contrast-enhanced magnetic resonance imaging. European Radiology. 2012;22:1451–1464. doi: 10.1007/s00330-012-2446-x. [DOI] [PubMed] [Google Scholar]
- 19.Hathout G, Jamshidi N. Parameter optimization for quantitative signal-concentration mapping using spoiled gradient echo MRI. Radiol Res Pract. 2012;2012:815729. doi: 10.1155/2012/815729. [DOI] [PMC free article] [PubMed] [Google Scholar]
- 20.Taouli B, Johnson RS, Hajdu CH, Oei MTH, Merad M, Yee H, Rusinek H. Hepatocellular Carcinoma: Perfusion Quantification With Dynamic Contrast-Enhanced MRI. American Journal of Roentgenology. 2013;201:795–800. doi: 10.2214/AJR.12.9798. [DOI] [PMC free article] [PubMed] [Google Scholar]
- 21.Essig M, Shiroishi MS, Nguyen TB, Saake M, Provenzale JM, Enterline D, Anzalone N, Dörfler A, Rovira À, Wintermark M, Law M. Perfusion MRI: The Five Most Frequently Asked Technical Questions. AJR American journal of roentgenology. 2013;200:24–34. doi: 10.2214/AJR.12.9543. [DOI] [PMC free article] [PubMed] [Google Scholar]
- 22.Cao Y. The Promise of Dynamic Contrast Enhance Imaging in Radiation Therapy. Seminars in radiation oncology. 2011;21:147–156. doi: 10.1016/j.semradonc.2010.11.001. [DOI] [PMC free article] [PubMed] [Google Scholar]
- 23.Bernstein JM, Homer JJ, West CM. Dynamic contrast-enhanced magnetic resonance imaging biomarkers in head and neck cancer: Potential to guide treatment? A systematic review, Oral Oncology. 2014;50:963–970. doi: 10.1016/j.oraloncology.2014.07.011. [DOI] [PubMed] [Google Scholar]
- 24.Wedam SB, Low JA, Yang SX, Chow CK, Choyke P, Danforth D, Hewitt SM, Berman A, Steinberg SM, Liewehr DJ, Plehn J, Doshi A, Thomasson D, McCarthy N, Koeppen H, Sherman M, Zujewski J, Camphausen K, Chen H, Swain SM. Antiangiogenic and Antitumor Effects of Bevacizumab in Patients With Inflammatory and Locally Advanced Breast Cancer. Journal of Clinical Oncology. 2006;24:769–777. doi: 10.1200/JCO.2005.03.4645. [DOI] [PubMed] [Google Scholar]
- 25.Alic L, Vliet Mv, Dijke CFv, Eggermont AMM, Veenland JF, Niessen WJ. Heterogeneity in DCE-MRI parametric maps: a biomarker for treatment response? Physics in Medicine and Biology. 2011;56:1601. doi: 10.1088/0031-9155/56/6/006. [DOI] [PubMed] [Google Scholar]
- 26.Martincich L, Montemurro F, De Rosa G, Marra V, Ponzone R, Cirillo S, Gatti M, Biglia N, Sarotto I, Sismondi P, Regge D, Aglietta M. Monitoring Response to Primary Chemotherapy in Breast Cancer using Dynamic Contrast-enhanced Magnetic Resonance Imaging. Breast Cancer Research and Treatment. 2004;83:67–76. doi: 10.1023/B:BREA.0000010700.11092.f4. [DOI] [PubMed] [Google Scholar]
- 27.Liang PC, Ch'ang HJ, Hsu C, Tseng SS, Shih TTF, Wu Liu T. Dynamic MRI signals in the second week of radiotherapy relate to treatment outcomes of hepatocellular carcinoma: a preliminary result. Liver International. 2007;27:516–528. doi: 10.1111/j.1478-3231.2007.01456.x. [DOI] [PubMed] [Google Scholar]
- 28.Yuh WTC, Mayr NA, Jarjoura D, Wu D, Grecula JC, Lo SS, Edwards SM, Magnotta VA, Sammet S, Zhang H, Montebello JF, Fowler J, Knopp MV, Wang JZ. Predicting Control of Primary Tumor and Survival by DCE MRI During Early Therapy in Cervical Cancer. Investigative radiology. 2009;44:343–350. doi: 10.1097/RLI.0b013e3181a64ce9. [DOI] [PMC free article] [PubMed] [Google Scholar]
- 29.Park JJ, Kim CK, Park SY, Simonetti AW, Kim E, Park BK, Huh SJ. Assessment of early response to concurrent chemoradiotherapy in cervical cancer: value of diffusion-weighted and dynamic contrast-enhanced MR imaging. Magn Reson Imaging. 2014;32:993–1000. doi: 10.1016/j.mri.2014.05.009. [DOI] [PubMed] [Google Scholar]
- 30.Chomas JE, Dayton P, May D, Ferrara K. Threshold of fragmentation for ultrasonic contrast agents. Journal of Biomedical Optics. 2001;6:141–150. doi: 10.1117/1.1352752. [DOI] [PubMed] [Google Scholar]
- 31.Chomas JE, Pollard RE, Sadlowski AR, Griffey SM, Wisner ER, Ferrara KW. Contrast-enhanced US of Microcirculation of Superficially Implanted Tumors in Rats. Radiology. 2003;229:439–446. doi: 10.1148/radiol.2292020536. [DOI] [PubMed] [Google Scholar]
- 32.Dayton PA, Ferrara KW. Targeted imaging using ultrasound. Journal of Magnetic Resonance Imaging. 2002;16:362–377. doi: 10.1002/jmri.10173. [DOI] [PubMed] [Google Scholar]
- 33.Pollard RE, Dayton PA, Watson KD, Hu XW, Guracar IM, Ferrara KW. Motion Corrected Cadence CPS Ultrasound for Quantifying Response to Vasoactive Drugs in a Rat Kidney Model. Urology. 2009;74:675–681. doi: 10.1016/j.urology.2009.01.086. [DOI] [PMC free article] [PubMed] [Google Scholar]
- 34.Pollard RE, Sadlowski AR, Bloch SH, Murray L, Wisner ER, Griffey S, Ferrara KW. Contrast-assisted Destruction-replenishment Ultrasound for the Assessment of Tumor Microvasculature in a Rat Model. Technology in Cancer Research & Treatment. 2002;1:459–470. doi: 10.1177/153303460200100606. [DOI] [PubMed] [Google Scholar]
- 35.Ogawara Ki, Un K, Minato K, Tanaka Ki, Higaki K, Kimura T. Determinants for in vivo anti-tumor effects of PEG liposomal doxorubicin: Importance of vascular permeability within tumors. International Journal of Pharmaceutics. 2008;359:234–240. doi: 10.1016/j.ijpharm.2008.03.025. [DOI] [PubMed] [Google Scholar]
- 36.Qin SP, Fite BZ, Gagnon MKJ, Seo JW, Curry FR, Thorsen F, Ferrara KW. A Physiological Perspective on the Use of Imaging to Assess the In Vivo Delivery of Therapeutics. Annals of Biomedical Engineering. 2014;42:280–298. doi: 10.1007/s10439-013-0895-2. [DOI] [PMC free article] [PubMed] [Google Scholar]
- 37.Curry FRE, Rygh CB, Karlsen T, Wiig H, Adamson RH, Clark JF, Lin YC, Gassner B, Thorsen F, Moen I, Tenstad O, Kuhn M, Reed RK. Atrial natriuretic peptide modulation of albumin clearance and contrast agent permeability in mouse skeletal muscle and skin: role in regulation of plasma volume. Journal of Physiology-London. 2010;588:325–339. doi: 10.1113/jphysiol.2009.180463. [DOI] [PMC free article] [PubMed] [Google Scholar]
- 38.Rygh CB, Qin S, Seo JW, Mahakian LM, Zhang H, Adamson R, Chen JQ, Borowsky AD, Cardiff RD, Reed RK, Curry FR, Ferrara KW. Longitudinal investigation of permeability and distribution of macromolecules in mouse malignant transformation using PET. Clin Cancer Res. 2011;17:550–559. doi: 10.1158/1078-0432.CCR-10-2049. [DOI] [PMC free article] [PubMed] [Google Scholar]
- 39.Miller JK, Shattuck DL, Ingalla EQ, Yen L, Borowsky AD, Young LJ, Cardiff RD, Carraway KL, 3rd, Sweeney C. Suppression of the negative regulator LRIG1 contributes to ErbB2 overexpression in breast cancer. Cancer Research. 2008;68:8286–8294. doi: 10.1158/0008-5472.CAN-07-6316. [DOI] [PMC free article] [PubMed] [Google Scholar]
- 40.Siegel PM, Ryan ED, Cardiff RD, Muller WJ. Elevated expression of activated forms of Neu/ErbB-2 and ErbB-3 are involved in the induction of mammary tumors in transgenic mice: implications for human breast cancer. The EMBO journal. 1999;18:2149–2164. doi: 10.1093/emboj/18.8.2149. [DOI] [PMC free article] [PubMed] [Google Scholar]
- 41.Kheirolomoom A, Mahakian LM, Lai CY, Lindfors HA, Seo JW, Paoli EE, Watson KD, Haynam EM, Ingham ES, Xing L, Cheng RH, Borowsky AD, Cardiff RD, Ferrara KW. Copper-doxorubicin as a nanoparticle cargo retains efficacy with minimal toxicity. Mol Pharm. 2010;7:1948–1958. doi: 10.1021/mp100245u. [DOI] [PMC free article] [PubMed] [Google Scholar]
- 42.Lasic DD, Ceh B, Stuart MC, Guo L, Frederik PM, Barenholz Y. Transmembrane gradient driven phase transitions within vesicles: lessons for drug delivery. Biochim Biophys Acta. 1995;1239:145–156. doi: 10.1016/0005-2736(95)00159-z. [DOI] [PubMed] [Google Scholar]
- 43.Kruse DE, Lai CY, Stephens DN, Sutcliffe P, Paoli EE, Barnes SH, Ferrara KW. Spatial and temporal-controlled tissue heating on a modified clinical ultrasound scanner for generating mild hyperthermia in tumors. IEEE Trans Biomed Eng. 2010;57:155–166. doi: 10.1109/TBME.2009.2029703. [DOI] [PMC free article] [PubMed] [Google Scholar]
- 44.Stephens DN, Kruse DE, Ergun AS, Barnes S, Lu XM, Ferrara KW. Efficient array design for sonotherapy. Phys Med Biol. 2008;53:3943–3969. doi: 10.1088/0031-9155/53/14/014. [DOI] [PMC free article] [PubMed] [Google Scholar]
- 45.Vasquez KO, Casavant C, Peterson JD. Quantitative whole body biodistribution of fluorescent-labeled agents by non-invasive tomographic imaging. PLoS One. 2011;6:e20594. doi: 10.1371/journal.pone.0020594. [DOI] [PMC free article] [PubMed] [Google Scholar]
- 46.Chen J, Zhao M, Feng F, Sizovs A, Wang J. Tunable thioesters as “reduction” responsive functionality for traceless reversible protein PEGylation. J Am Chem Soc. 2013;135:10938–10941. doi: 10.1021/ja405261u. [DOI] [PubMed] [Google Scholar]
- 47.Song X, Chen J, Zhao M, Zhang C, Yu Y, Lonard DM, Chow DC, Palzkill T, Xu J, O'Malley BW, Wang J. Development of potent small-molecule inhibitors to drug the undruggable steroid receptor coactivator-3. Proc Natl Acad Sci U S A. 2016;113:4970–4975. doi: 10.1073/pnas.1604274113. [DOI] [PMC free article] [PubMed] [Google Scholar]
- 48.Ponce AM, Viglianti BL, Yu D, Yarmolenko PS, Michelich CR, Woo J, Bally MB, Dewhirst MW. Magnetic resonance imaging of temperature-sensitive liposome release: drug dose painting and antitumor effects. J Natl Cancer Inst. 2007;99:53–63. doi: 10.1093/jnci/djk005. [DOI] [PubMed] [Google Scholar]
- 49.Kneepkens E, Fernandes A, Nicolay K, Grull H. Iron(III)-Based Magnetic Resonance-Imageable Liposomal T1 Contrast Agent for Monitoring Temperature-Induced Image-Guided Drug Delivery. Invest Radiol. 2016;51:735–745. doi: 10.1097/RLI.0000000000000297. [DOI] [PubMed] [Google Scholar]
- 50.Watson KD, Lai CY, Qin S, Kruse DE, Lin YC, Seo JW, Cardiff RD, Mahakian LM, Beegle J, Inghanm ES, Curry FR, Reed RK, Ferrara KW. Ultrasound Increases Nanoparticle Delivery by Reducing Intratumoral Pressure and Increasing Transport in Epithelial and Epithelial-Mesenchymal Transition Tumors. Cancer Research. 2012;72:1485–1493. doi: 10.1158/0008-5472.CAN-11-3232. [DOI] [PMC free article] [PubMed] [Google Scholar]
- 51.Hu X, Kheirolomoom A, Mahakian LM, Beegle JR, Ingham ES, Caskey CF, Kruse DE, Ferrara KW. Reduced blood flow in murine tumors after the destruction of bound, targeted microbubbles. 2011 IEEE International Ultrasonics Symposium. 2012:955–958. [Google Scholar]
- 52.Hu X, Kheirolomoom A, Mahakian LM, Beegle JR, Kruse DE, Lam KS, Ferrara KW. Insonation of Targeted Microbubbles Produces Regions of Reduced Blood Flow Within Tumor Vasculature. Investigative radiology. 2012;47:398–405. doi: 10.1097/RLI.0b013e31824bd237. [DOI] [PMC free article] [PubMed] [Google Scholar]
- 53.Hunt SJ, Gade T, Soulen MC, Pickup S, Sehgal CM. Antivascular Ultrasound Therapy: Magnetic Resonance Imaging Validation and Activation of the Immune Response in Murine Melanoma. Journal of Ultrasound in Medicine. 2015;34:275–287. doi: 10.7863/ultra.34.2.275. [DOI] [PubMed] [Google Scholar]
- 54.Stieger SM, Caskey CF, Adamson RH, Qin S, Curry FRE, Wisner ER, Ferrara KW. Enhancement of vascular permeability with low-frequency contrast-enhanced ultrasound in the chorioallantoic membrane model. Radiology. 2007;243:112–121. doi: 10.1148/radiol.2431060167. [DOI] [PubMed] [Google Scholar]
- 55.Wong AW, Fite BZ, Liu Y, Kheirolomoom A, Seo JW, Watson KD, Mahakian LM, Tam SM, Zhang H, Foiret J, Borowsky AD, Ferrara KW. Ultrasound ablation enhances drug accumulation and survival in mammary carcinoma models. Journal of Clinical Investigation. 2016;126:99–111. doi: 10.1172/JCI83312. [DOI] [PMC free article] [PubMed] [Google Scholar]
- 56.Buttari B, Profumo E, Rigano R. Crosstalk between Red Blood Cells and the Immune System and Its Impact on Atherosclerosis. Biomed Research International. 2015:8. doi: 10.1155/2015/616834. [DOI] [PMC free article] [PubMed] [Google Scholar]
- 57.Sindrilaru A, Peters T, Wieschalka S, Baican C, Baican A, Peter H, Hainzl A, Schatz S, Qi Y, Schlecht A, Weiss JM, Wlaschek M, Sunderkotter C, Scharffetter-Kochanek K. An unrestrained proinflammatory M1 macrophage population induced by iron impairs wound healing in humans and mice. The Journal of Clinical Investigation. 121:985–997. doi: 10.1172/JCI44490. [DOI] [PMC free article] [PubMed] [Google Scholar]
Associated Data
This section collects any data citations, data availability statements, or supplementary materials included in this article.
Supplementary Materials
Supplementary Fig. S1. Size distribution of liposomes and gas-filled microbubbles. (A) Size distribution of liposomes with an average diameter of 119 ± 39 nm. (B) Microbubble concentration versus diameter with a mean diameter of 1.69 μm.
Supplementary Fig. S2. DCE-MRI before and after DoxTSLs injection and insonation of NDL tumors. (A-D) DCE-MRI tracer versus time curves immediately before and over a period of approximately 1000 seconds after bolus intravenous injection of gadoteridol prior to (green) and following (blue) treatment with DoxTSLs+US obtained for 4 different mice. The initial wash-in of tracer is reduced in tumors post treatment with DoxTSLs+US. Following the initial wash-in, accumulation of tracer was augmented for all tumors treated with DoxTSLs+US.
Supplementary Fig. S3. DCE-MRI following tumor hyperthermia comparing insonated tumors with non-insonified contralateral tumors. No significant difference was observed between the time-course of tumor gadolinium obtained for insonated NDL tumors and non-insonated contralateral tumors.
Supplementary Fig. S4. Tumor volume before and after treatment. The difference was not statistically significant (n.s.).
Supplementary Fig. S5. Treatment with Free Dox+US did not alter the shape of DCE-MRI curve. DCE-MRI curves of the tumor treated with Free Dox+US and the corresponding contralateral tumor along with the H&E-stained histological sections of whole tumors and magnified sections of tumors. DCE-MRI tracer versus time curves were similar for the tumor treated with Free Dox+US and the contralateral tumor that did not receive ultrasound hyperthermia. The scale bar represents 1 mm on the whole tumor sections and 100 μm on the magnified sections.
Supplementary Fig. S6. DCE-MRI of human bladder cancer TCC-SUP tumors and the corresponding histological sections of tumors treated with DoxTSLs+US. A, B) Gd concentration versus time curves obtained for TCC-SUP tumor treated with DoxTSLs+US versus non-insonated contralateral tumor (A); and those obtained for the core of treated tumor versus non-insonified contralateral tumor (B). Gd concentration over time was reduced in the core of tumor treated with DoxTSLs due to treatment-induced necrosis. Tumors were treated with eight repeated administrations of DoxLTSLs+US, twice a week for a period of 4 weeks. C, D) H&E of whole TCC-SUP tumor sections treated with DoxTSLs+US. Scale bars are 2 mm.