


Abstract
Achieving high fidelity chemical synthesis on glass plates has become increasingly important, since glass plates are substrates widely used for miniaturized chemical and biochemical reactions and analyses. DNA chips can be directly prepared by synthesizing oligonucleotides on glass plates, but the characterization of these micro-syntheses has been limited by the sub-picomolar amount of material available. Most DNA chip syntheses have been assayed using in situ coupling of fluorescent molecules to the 5′-OH of the synthesized oligonucleotides. We herein report a systematic investigation of oligonucleotide synthesis on glass plates with the reactions carried out in an automated DNA synthesizer using standard phosphoramidite chemistry. The analyses were performed using 32P gel electrophoresis of the oligonucleotides cleaved from glass plates to provide product distribution profiles according to chain length of oligonucleotides. 5′-Methoxythymidine was used as the chain terminator, which permits assay of coupling reaction yields as a function of chain length growth. The results of this work reveal that a major cause of lower fidelity synthesis on glass plates is particularly inefficient reactions of the various reagents with functional groups close to glass plate surfaces. These problems cannot be detected by previous in situ fluorescence assays. The identification of this origin of low fidelity synthesis on glass plates should help to achieve improved synthesis for high quality oligonucleotide microarrays.
INTRODUCTION
Parallel synthesis, miniaturized analysis and interrogation of libraries of molecules are being perceived as one the most promising approaches available to modern chemistry and biology (1–4). Examples include applications in combinatorial synthesis and screening of pharmaceutical compounds (5–7), biomolecular assays (8–11) and gene analysis using oligonucleotide microarrays or DNA chips (12–14). A common platform for these micro-chemical and biological experiments is planar surfaces, such as those made from silicon-based materials or synthetic polymers. Among these, glass plates (e.g. microscope slides, which are borosilicate glass) are readily available, easy to handle and commonly used (15–33). These glass plate surfaces contain Si-OH groups for functionalization, but these surface groups do not have as ordered structures as those derivatized on Si/SiO2 crystalline silicon surfaces processed in the clean room environments of the semiconductor and microelectronics industries. In the last few years chemical reactions on glass plate surfaces have been extensively investigated in an effort to understand and optimize synthesis and binding assays on these surfaces (15–33).
In addition to the factors that affect conventional reactions, such as concentrations and stoichiometric ratios of reagents, specific concerns relate to microscale reactions on solid surfaces. These include, for example, the reactivity of surface functional groups, accessibility of the reactants bound to a surface, effective concentration or density of surface molecules and surface microstructures. Monolayer formation of linker molecules in reactions of silylation agents with surface Si-OH groups has been well characterized (15–18). For oligonucleotide syntheses, earlier studies addressed questions related to bulk solid support materials, such as controlled porous glass (CPG). The effects of surface functional groups, pore size, chemical properties of linker molecules and linker chain length on synthesis were examined using HPLC and other conventional analytical chemical methods (19–22). These studies led to the development of highly homogeneous porous glass and synthetic solid support materials containing linkers with desirable chain lengths (e.g. oligoethylene glycol) or acid/base stable chemical bonds (e.g. ether and amide linkages). In comparison with these bulk syntheses, oligonucleotide syntheses on glass plate surfaces are on the picomolar scale (∼0.1–1 pmol/mm2). Each spot of an array of oligonucleotides would contain a femtomole or less of material. These microquantities of material prevent reactions from being monitored using conventional methods, such as HPLC or UV. In the literature, monitoring of coupling reactions between a nucleotide phosphoramidite (monomer) and the terminal OH group of the immobilized linkers or oligonucleotides were accomplished using fluorescence (FR) measurements (23–25,27–33). Usually fluorescein phosphoramidites are reacted with the surface terminal OH groups to form fluorescein-terminated oligonucleotides. The intensities of fluorescence emission (FRE) measured following each coupling step are considered proportional to the yields of the coupling reactions. The stepwise yields and the purity of the oligonucleotides synthesized are thus calculated from these FRE measurements. Using this approach the efficiency of parallel oligonucleotide synthesis using photolithography and photolabile protection groups was reported to be in the range 82–97% (27,29–31). The FR assay has also been applied to the analyses of oligonucleotide array synthesis on glass plates using conventional chemistry (23–25,28). These FR assays can be carried out without interruption of synthesis and thus they are convenient and most suitable for monitoring of reactions that are sensitive to moisture, such as the coupling reaction in oligonucleotide synthesis. Typical methods for characterization of surface monolayers, such as X-ray photoelectron spectroscopy, atomic force microscopy, ellipsometry and contact angle measurements, have been applied in studies of linker molecules and combinatorial oligonucleotide synthesis (25). However, these methods are only sensitive to the existence of certain types of functional groups, average chain lengths (layer thickness) and surface morphology, with a limited spatial resolution of ∼1 mm2, and thus they are not suitable for directly assaying the synthesis products.
The research described here addresses the issues of being able to directly assay sub-picomole oligonucleotide synthesis on glass plates and to detect synthesis defects specifically associated with the features of glass plate substrates. These represent important steps for characterization, understanding and optimization of the related chemical reactions. The existing FR assays have potential problems, since the assumptions are that each step has the same number of terminal OH groups available for the coupling reaction and that each deprotection or capping reaction goes to completion. The research discussed here also relates to improvements in synthesis of oligonucleotide microarrays. Several oligonucleotide microarray parallel syntheses have been reported (12,13,34–37) and the light-directed synthesis method using photolabile group-protected monomers has become prevalent in gene chip fabrication (13). We recently reported a novel solution photochemistry that is suitable for parallel synthesis of oligonucleotides, peptides and other types of molecular microarrays (34–36). Central to our method is the use of acid-labile group-protected monomers in synthesis and solution photogenerated acids (PGAs) instead of regular acids (such as TCA and TFA) to remove the acid-labile groups (such as 5′-O-DMT for oligonucleotides and N-t-Boc for peptides). PGA deprotection releases OH or NH2 groups, which can couple with incoming monomers, such as DMT-nucleotide phosphoramidites or t-Boc-amino acids, in subsequent chain growth reactions (34–36). These syntheses can be performed in a regular synthesizer with a programmable projector for control of light illumination according to predetermined selection patterns. This method has the potential for combinatorial synthesis of a variety of molecules as addressable arrays on glass plates. In this work the synthesis of oligonucleotides on glass plates was investigated.
MATERIALS AND METHODS
DNA synthesis reagents were purchased from Glen Research (Sterling, VA). T4 polynucleotide kinase was purchased from Gibco. Silane reagents were purchased from Lancaster (Windham, NH) and Gelest (Tullytown, PA). Photogenerated acid precursor (PGA-P) compounds were purchased from Secant Chemicals and Midori Kagaku Ltd. CH2Cl2 and CH3CN were refluxed over CaH2 and distilled before use. Fluorescein phosphoramidite was synthesized from 9-amino-4,5-dicarboxyfluorescein according to a modified literature procedure (38,39). CPG for oligonucleotide synthesis was purchased from CPG Inc., glass plates were microscope coverslips (Baxter) and microarray glass plates were photolithographically fabricated as described previously (35).
All oligonucleotide syntheses on various substrates were carried out on a DNA synthesizer (Expedite 8909; PE Biosystems). Syntheses used TCA or PGA as the deprotecting agent. The light-directed microarray reactions used a microarray reactor mounted on the DNA synthesizer (in lieu of a reaction column) and an optical unit synchronized to the synthesizer (for further details see 35). The optical unit consisted of a light source (Hg or Xe lamp, 200 W; Oriel Instruments), a microchip containing 480 × 640 mirrors of 16 × 16 µm2 (Texas Instruments) and reflection and focus lenses. The microflow patterns of the microarray reactor were monitored using a video camera (Sony).
HPLC analyses were performed on a M510 SDS dual pump system equipped with a 996 photodiode array detector (Waters). HPLC column used was reverse phase (10 × 100 mm, 10 µm, C18 µ-bondapak). Eluents were CH3CN and triethylammonium acetate (0.05 M) in H2O, pH ∼6.5. Electrophoresis experiments were performed using an S2 sequencing gel apparatus (Gibco), 39 × 31 cm plates and a 0.8 mm spacer (Life Technology).
Solid support derivatization
Microscope coverslips or slides and microarray plates containing patterns of 24 × 24 reaction sites were treated with hot piranha solution (concentrated H2SO4:H2O2, 50:50 v/v) for 15 min. These cleaned glass plates were thoroughly rinsed with H2O and then EtOH, dried and immersed in a solution containing N-(3-triethoxysilylpropyl)-4-hydroxybutyramide (1% v/v in 95% EtOH). The reaction was left at room temperature for a minimum of 1 h with gentle shaking. Upon completion of the reaction, glass plates were rinsed thoroughly with 95% EtOH and cured at 100°C under N2 for 1 h. The derivatized plates were stored in a clean, dry container. CPG support (2000 Å pore size) containing the same stable linker [N-(3-triethoxysilylpropyl)-4-hydroxybutyramide] was derivatized in a similar way but the prior strong acid wash was not necessary. The loading of CPG was ∼10 µmol/g.
Oligonucleotide synthesis on CPG supports
These syntheses were carried out on a 0.2 µmol scale on the DNA synthesizer and DMT deprotection was monitored using an on-line detector. Upon completion of the synthesis the oligonucleotides on CPG were treated with concentrated NH4OH (2 ml) for 10 h at 55°C. The aqueous solution was removed using a centrifuge.
Oligonucleotide synthesis on glass plates
The linker-derivatized glass plates were divided into strips of ∼30 mm2 and synthesis was performed in a conventional 1 µmol column. DNA synthesizer protocols were modified to satisfy the volume requirements of the glass plate reaction devices. The DMT monitor on the synthesizer was turned off because the amount of DMT+ was too little to be measured. The sequences synthesized were cleaved from glass surfaces by treatment with concentrated NH4OH (0.5 ml) for 10 h at 55°C. The aqueous solution was removed using a centrifuge.
Reactions of 5′-MeOT
5′-MeOT was synthesized according to the literature (40) but with minor modifications. Its phosphoramidite was prepared in a similar manner as for T phosphoramidite preparation. The coupling reactions of the terminator 5′-MeOT used the same protocols as those for coupling of the T phosphoramidite.
Tn oligonucleotide microarray synthesis
The reactions used biaryliodium pentafluorophenyl salt (1% in CH2Cl2) and photosensitizing thioxanthenone (1:1) as the PGA-P system described previously (35). The derivatized microarray plate was contained in a holder, which was connected to the DNA synthesizer to allow flow-through of reaction reagents and solvents. DNA synthesizer protocols were modified to satisfy the volume requirements of the microarray reactor. The synthesis of Tn sequences (n = number of residues) was carried out automatically. In the 5′-O-DMT deprotection step the light source was turned on and the array plate was illuminated according to a computer-generated chessboard pattern. The sites first irradiated were those of T18 sequences. These light-directed acid deprotection steps lasted 1–2 min and were followed by a CH3CN wash. The rest of the synthesis steps (coupling, capping and oxidation) were the same as those in a conventional synthesis. In the second cycle the T18 and T17 sites were irradiated and at these sites coupling occurred. The synthesis cycles continued and in the nth cycle the T18, T17, … Ti (n sequences) sites were irradiated. Fluorescein phosphoramidite was added in the final step to all sites where Tn (n = 1–18) sequences were synthesized. The fluorescein group was activated by treatment with ethylenediamine (EDA)/EtOH (1:1) for ∼10 min. The plate was washed with EtOH before recording the FR images.
Imaging oligonucleotide microarray plate
The Tn sequence microarray plates were placed under a cooled CCD camera system. Fluorophore excitation and detection were at 494 and 525 nm, respectively, using the same light source as for the photodeprotection reactions. An FRE image of the plate was taken, processed and analyzed using the Image Pro, ScanAlyze (http://rana.Stanford.EDU/software/) and Excel (Microsoft) programs. FRE intensities were obtained from integrated values and averaged over several experimental points.
Sample preparation and 32P-labeling
Glass plates of ∼1 mm2 or 5–10 beads of CPG containing oligonucleotides were treated with concentrated aqueous NH4OH at 55°C overnight. The solution was vacuum dried and redissolved in H2O (10 µl for each 1 mm2 plate). A portion of the sample (3 µl) was labeled with [γ-32P]ATP (5 µCi, 3000 Ci/mmol) using T4 polynucleotide kinase (1 U) and the conditions recommended by the manufacturer (Gibco).
Denaturing gel electrophoresis
32P-labeled oligonucleotides (4 µl) were mixed with formamide (6 µl) before loading onto a gel containing 20% acrylamide/bisacrylamide (29:1) in 7 M urea. Gels in 1× TBE (90 mM Tris–borate, pH 8.3, 2 mM EDTA) were subjected to electrophoresis at 55 V/cm for ∼1.5 h at room temperature. 32P exposure on an X-ray film (Kodak) produced gel films. The intensities of the gel bands were derived using the Image Pro program (Media Imagenics) after scanning digitization of the gel film (Fig. 6).
Figure 6.
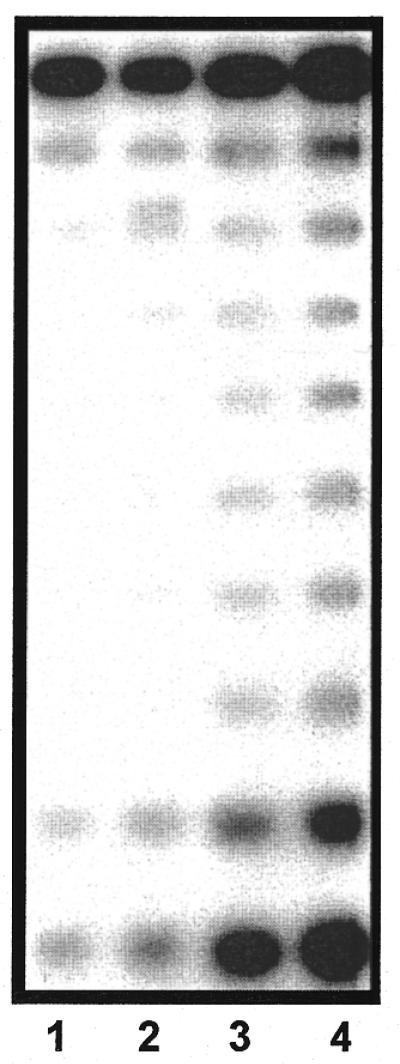
Oligonucleotide cleavage from glass plates as a function of reaction time. Electrophoresis gel profiles of T10 cleaved from glass plates at various times upon treatment with concentrated aqueous NH4OH. Lanes 1–4, sequences cleaved from glass plates after 0.25, 0.5, 1.0 and 2.0 h NH4OH treatment. There is an increased presence of shorter Tn fragments as a function of reaction time.
RESULTS AND DISCUSSION
The basic systems used in our investigation included regular glass plates, which were derivatized to contain OH groups on their surface, and the conventional chemical reactions of oligonucleotide synthesis (41). Syntheses were performed in a flow-through glass plate holder connected to an automated DNA synthesizer (Perceptive 8909). Standard synthesis protocols were used except that a modification was made to account for the volume difference between the reactor and a 1 µmol column normally used for oligonucleotides synthesis. Reagents for monomer coupling, oxidation and capping were the same as those used for oligonucleotide synthesis on CPG. After synthesis and deprotection of the protecting groups from oligonucleotides the cleaved oligonucleotides were 5′-labeled with [32P]phosphate and examined using denaturing PAGE (Fig. 1). In some cases FR assays of array syntheses were performed in parallel for comparison. The differences in the synthesis results between glass plates (microscope slides) and CPG (500, 1000 and 2000 Å porous sizes) using the most robust chemistry (i.e. nucleotide phosphoramidite chemistry; 41) were first examined. To closely examine oligonucleotide synthesis on glass plates the various reactions (mainly deprotection, capping and coupling) used in the synthesis cycles were systematically investigated and the results were analyzed with a focus on the causes of formation of failure sequences. Additionally, the oligonucleotide deprotection reaction and the product profiles upon ammonolysis cleavage of the immobilized oligonucleotides from glass plates were also examined. The experiments described below were performed at least in duplicate.
Figure 1.
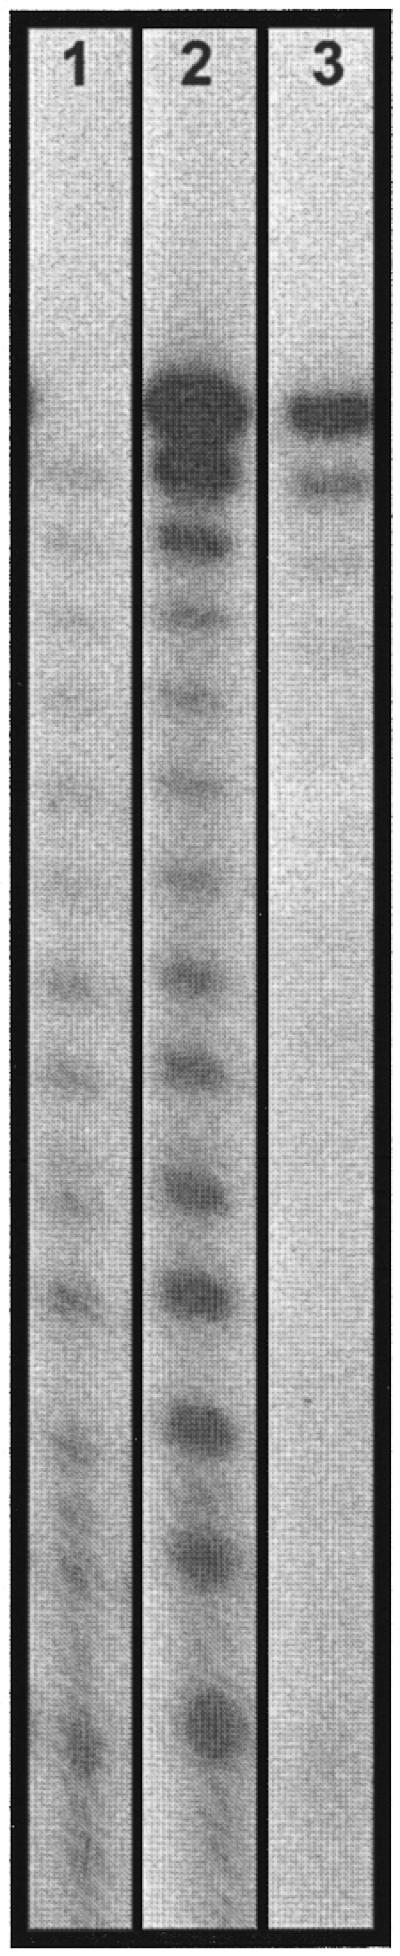
Denaturing electrophoresis gel profile of 5′-32P-labeled T14 sequences synthesized on glass plates. Lane 1, a sample without removing the 5′-DMT protecting group. The sequences shown are synthetic failure and capped sequences. Lane 2, a sample treated with acid to remove the 5′-DMT protecting group. Subtraction of the bands of lane 1 from those of lane 2 gives the sequences which coupled with a DMT monomer in the last coupling step. Lane 3, sequences synthesized on CPG (500 Å pore size).
FR assay of oligonucleotide microarray synthesis
Synthesis experiments were performed using procedures similar to those described in the literature (28,30,35). The microarray substrates were glass plates, which were coated with a hydrophobic film to form discrete reaction sites. Within the reaction sites the surface was not coated with the film but derivatized using OH-terminated silylation agents (linker molecules, Scheme 1). The surface linker OH groups were then coupled with DMT-T. In a typical FR assay a microarray of Tn (n = residue numbers) sequences with n ranging from 1 to 18 was synthesized in a chessboard pattern (Fig. 2A). In each cycle of the synthesis, selected sites designated for Tn sequences were illuminated in the presence of a PGA precursor solution. PGA was generated at these illuminated sites and removed the 5′-DMT group (a detailed description of these photoreactions can be found in 34,35). The first coupling reaction of the deprotected OH group with monomer T resulted in T1 formation at all illuminated sites. In the second cycle of the synthesis all sites designated for T18 and T17 sequences were illuminated in the presence of a PGA precursor solution and the DMT group was removed at these selected reaction sites. The second coupling reaction of the deprotected OH with monomer T resulted in T2 formation at all illuminated sites. The synthesis cycles were repeated until the synthesis of all Tn sequences at designated sites was completed. Once again, all sites designated for Tn sequences were illuminated in the presence of a PGA precursor solution. This resulted in deprotection of the 5′-O-DMT group on all Tn sequences. Fluorescein phosphoramidite (1:10 in T phosphoramidite) was then added to the microarray plate, resulting in coupling of the fluorophore to the Tn sequences. The FRE image of the Tn microarray shown in Figure 2 demonstrated excellent synthesis yield (>99.5% stepwise yield). However, do these results actually reflect perfect synthesis?
Figure 2.

Parallel synthesis of Tn (n = 1–18) sequences and stepwise yield assay using FRE images. (A) The first digital mask used for synthesis of the Tn sequences on the chip. Locations of sequences are indicated. (B) FRE intensity profile of the arrays shown in (C) and (D). FRE readings of each sequence were averaged and are plotted along the x-axis. The constant intensity readings indicate that stepwise coupling is >99%. In the insert a representative trace of the Tn array panel as indicated by the diagonal line in (C) is displayed. The integrations are for T1, T4, T8, T11, T15 and T18 sequences. (C and D) Microarrays of T1–T18 oligonucleotides synthesized using a maskless digital light-directed process and solution photogenerated acid deprotection (34–36). The last residue coupled was fluorescein phosphoramidite.
Electrophoresis assay of oligonucleotides synthesized on glass plates
32P or fluorescent dye labeling at the 5′-end of DNA sequences is a sensitive detection method that is widely used in biochemical and biological experiments. Even though the quantity of oligonucleotides obtained on cleavage from glass plates is limited (<1 pmol/mm2), using 32P labeling it is possible to directly monitor the profiles of oligonucleotides synthesized. In these analyses quantitative comparisons can be made from the relative intensities of the gel bands of the same lane, while the intensities of the gel bands of different lanes are used on a qualitative basis. In our typical experiments, oligonucleotides Tn (n = 5–20) were synthesized on microscope coverslips of several mm2 sizes using standard nucleotide phosphoramidite chemistry and a DNA synthesizer (41). These plates were functionalized with linkers carrying a terminal OH group (Scheme 1), which were the same linkers as used for oligonucleotide microarray synthesis (29–31,35). After synthesis the glass plates containing oligonucleotides were divided into pieces of ∼1 mm2 and separately treated with concentrated aqueous NH4OH. Tn sequences were released from the glass plate surfaces. In the control experiments Tn sequences were synthesized on CPG using a DNA synthesizer and the same synthesis and cleavage protocol as were used for glass plates. Ammonolysis cleavage of oligonucleotides synthesized on glass plates produced sequences containing linkers. The normal cleavable succinyl linker was not used in this work since this is not used for oligonucleotide microarray synthesis. Gel electrophoresis showed that the linker does not affect relative migration of the Tn sequences compared to those without linkers. Both sets of Tn sequences were then treated with [32P]ATP and T4 polynucleotide kinase. The sequences terminated with a 5′-OH group were 32P phosphorylated and examined using denaturing gel electrophoresis. Since ammonolysis can effectively cleave oligonucleotides from glass surfaces and 32P labeling is efficient, these gel profiles accurately represent the product distribution of these oligonucleotide syntheses. Representative results of electrophoretic analyses are shown in Figure 1.
Figure 1 displays an electrophoresis gel of T14 oligonucleotides synthesized on a glass plate, with lane 1 showing the sample without treatment for removal of the terminal 5′-O-DMT group and lane 2 showing the sample treated with acid to remove the terminal 5′-O-DMT group. Since the DMT group was derived from the last coupling step of the DMT-protected nucleotide monomer and the corresponding sequences cannot be 32P labeled, lane 1 detects only DMT-off sequences in the sample without treatment with acid. The T13 sequence band is very weak in lane 1; its presence would reflect synthesis failure in the last coupling step. There is another source of sequences shown in lane 1 as short fragments. These are sequences which failed to react in previous coupling steps and were capped with an acetyl group in subsequent synthesis. The capping group was removed by ammonolysis and thus these sequences have a terminal OH group, which was 32P phosphorylated by the enzyme. The amount of these failure sequences is much less than that in lane 2 (Fig. 1). Lane 2 reveals the distribution profile of sequences ranking from T1 to T14. An increasing presence of n – 1 (n = residue number in the full-length sequence) and other shorter sequences is evident in lane 2 compared to lane 1. Lane 3 displays the results of T14 synthesis on a CPG support. In this lane the n – 1 and other shorter sequences are only a minor portion of the total product. These gel analysis results raise a number of concerns. First, even though glass plates and CPG are the same type of substrate (Si-OH), synthesis fidelity on glass plates is lower, as reflected in the comparison of the amounts of failure sequences in lanes 2 and 3. Synthesis carried out on glass plates also contains an enhanced ratio of n – 1:n sequences (lane 2, 18%; lane 3, 8%) and a higher extent of overall failure sequences. Secondly, most failure sequences contained a 5′-DMT group, as reflected in the differences between lanes 1 and 2 (Fig. 1). Lane 1 displays only faint bands of sequences shorter than n, in contrast to the corresponding bands in lane 2. On the other hand, comparison of lanes 1 and 2 also indicates that coupling in the last step was quantitative, since there were only small amounts of n – 1 length sequence in lane 1 (Fig. 1).
An interesting comparison can be made between the gel assays using oligonucleotides cleaved from the glass plate surface and the FR assays performed without cleavage of the oligonucleotides from glass plates (Figs 1 and 2). Both types of sequences were synthesized on the same synthesizer using comparable chemical procedures. These assays are consistent in the sense that both show high coupling yields of nucleotide phosphoramidites. However, in the FR assay a fluorescent phosphoramidite is added to the 5′-terminal OH group in the last step of synthesis in a similar way to coupling of a DMT phosphoramidite monomer. Therefore, based on the gel analysis in Figure 1, one can easily envision that the FR assay (Fig. 2) shows overall coupling to all species containing a terminal OH group and that a 100% coupling yield in the FR assay does not necessarily correlate with 100% formation of the full-length sequence.
A step-by-step investigation of oligonucleotide synthesis on glass plates
The experiments presented in this section were performed using typical phosphoramidite chemistry and glass plates on a DNA synthesizer. These experiments were performed to identify the factors associated with individual reaction steps in the synthesis cycle (i.e. deprotection, coupling and capping) that can potentially adversely affect glass plate synthesis. Additionally, reactions at different initiation points (e.g. reactions with the OH groups of linkers or longer chain oligonucleotides on the surface) were examined. It was also suspected that different types of glass materials may produce different results. However, syntheses on the surfaces of sodalime, borosilicate and quartz microscope coverslips produced comparable electrophoretic gel profiles (data not shown).
Capping and detritylation. Figure 3 shows an investigation of the capping and detritylation steps. Figure 3A shows the reaction steps after T1 synthesis. Synthesis began with addition of DMT-T phosphoramidite to the linker OH. In the reference set (Fig. 3A, lane 1) T2 was synthesized as normal (via capping, detritylation and coupling steps) and the presence of a significant amount of T1 in the T2 synthesis was noted (Fig. 3A and B, lanes 1). In the experiment shown in lane 2 (Fig. 3A) the DMT group of T1 was removed and capping reagents were applied so that the free OH group of T1 could be capped with an acetyl group; the subsequent coupling reaction would not yield T2. This was close to what was observed (only small amounts of T2 were detected) and thus capping of T1 is nearly quantitative (note that in this case coupling with the surface OH group would yield T1, which overlaps with T1 formed in the first step). In the experiment shown in lane 3 (Fig. 3A) the DMT group was removed, capping reagents were applied and the detritylation reaction was again performed, followed by monomer coupling. This process tested whether the first detritylation reaction was complete. Incomplete detritylation would result in T2 formation. This experiment indicates that removal of the DMT group of T1 was complete.
Figure 3.

Stepwise analysis of oligonucleotide synthesis on glass plates using 32P gel electrophoresis. (A) Assaying whether the capping reaction (after first step coupling) was complete and deprotection efficiency. Lane 1, regular T2 synthesis; lane 2, after T1 coupling and deprotection, capping was performed before coupling of the second T (note that capping blocked most monomer T residues coupling to T1, but a significant portion of the surface OH are still available for the coupling reaction to yield T1); lane 3, after T1 coupling and deprotection, capping and detritylation were performed before coupling of the second T (note that the second detritylation generated little new reaction sites since little T2 was observed). (B) Assaying initial reactions with surface OH groups. Lane 1, regular T2 synthesis; lane 2, capping reagents were quickly applied to the reaction surface before T2 synthesis (note the presence of T1 and a faint T2 band); lane 3, capping reagents were applied to the reaction surface for 5 min before T2 synthesis (note the presence of T1 and a faint T2 band).
The experiments shown in Figure 3A show that detritylation and capping are virtually quantitative at the T1 level (i.e. reaction with the coupled monomer on the surface). However, if there were some open sites at the linker OH level, they would lead to formation of T1 during synthesis of T2. These new T1 would migrate together with the capped T1 in gel analysis and thus could not be unambiguously detected. The open linker OH sites could potentially be acetylated in the capping reaction. The experiments shown in Figure 3B examined capping of the linker OH, in which the reaction surface was treated with capping reagents. In the reference set (Fig. 3B, lane 1) T2 was synthesized as normal. In lanes 2 and 3 (Fig. 3B), rather than coupling with a nucleotide monomer, the linker OH groups were capped by brief contact of the acetylation reagents with the surface or by a 5 min treatment. If all OH groups were acetylated by these treatments there would be no further coupling reactions. Synthesis of T2 was then performed on the capped linker surface. Gel analyses showed that quick capping of the linker OH (Fig. 3B, lane 2) left some open OH sites, since there were noticeable amounts of T1 and T2 present, and the increased capping time did not vary the relative ratio of the T1 and T2 products (Fig. 3B, lane 3). These results demonstrate that although capping was almost quantitative for the T1 OH (Fig. 3A), it was much less quantitative for the linker OH. Another interesting observation was that the amount of T1 was much greater than that of T2 (Fig. 3B, lanes 2 and 3), suggesting formation of T1 in both the T1 and T2 synthesis cycles. A plausible explanation is that formation of T1 in the second coupling step was due to coupling of monomers to unreacted linker OH.
Coupling reactions. The above experiments show that coupling generates quantitative yields at longer chain lengths (Fig. 1) but poor yields in the initial coupling steps (Fig. 3). Experiments were performed to investigate the origin of generation of a large population of T1 species as observed in Figure 3. Non-specific reactions with the Si-OH groups on glass surfaces were ruled out, since non-derivatized surfaces produced no oligonucleotide sequences in gel studies (data not shown). Reaction time is another marker; longer coupling reaction times would allow more linker OH to react with monomers. T5 and T6 oligomer syntheses using 1.5, 10 and 60 min coupling and equally long capping reaction times were performed and these results are shown in Figure 4. The reference was a normal T5 synthesis (Fig. 4, lane 1) using 1.5 min for the coupling and capping reaction steps. Lanes 2 and 3 (Fig. 4) display significantly increased amounts of failure sequences in relation to the full-length sequences with increased reaction times (lanes 3 and 3) and the longest reaction time produced the worst results (lane 3). The electrophoretic gel patterns shown in Figures 1, 3 and 4 may be understood if the presence of ‘hindered’ surface OH groups is considered. It seems that the closer to the surface of the substrate the reacting functional groups are, the more hindrance the reaction experiences. This creates opportunities for continuous formation of coupling products in consecutive synthesis cycles, because in each reaction cycle some of the previously unreacted surface OH groups would react with monomers. These untimely reactions contribute to an increased level of failure sequences of various chain lengths, especially of shorter chain lengths.
Figure 4.
Assay of oligonucleotide synthesis as a function of reaction time using 32P gel electrophoresis. Lane 1, regular T5 synthesis; lane 2, the reaction times for the coupling and capping steps were 10 min each; lane 3, reaction times were 60 min.
Probing stepwise coupling yield using a chain terminator. Termination coupling experiments using the 5′-MeO-T phosphoramidite, which is a chain terminator, were designed to further examine coupling yield deficiency in the initial steps of synthesis (Fig. 5). The electrophoretic gel profiles shown in Figures 1, 3 and 4 are consistent with the explanation that in the initial few steps monomer coupling yields are much lower than expected (normally the coupling yield for T is expected to be >99%). Accordingly, assuming there are m total linker OH groups on a surface and only an estimated 70% OH groups react with monomers in the T1 coupling then T1 = 0.7m; in the second coupling step (T2 coupling), if the yield is 80% then T2 ≈ 0.56m and T1 ≈ 0.35m [T1 = (0.70 – 0.56) + (1 – 0.7) × 0.7)]. This gives a ratio of OH:T1:T2 ≈ 0.09:0.35:0.56, which is consistent with the gel profiles shown in Figure 3. At the third step of synthesis (T3 coupling), if the coupling yield is 90% then T3 ≈ 0.504m, T2 ≈ 0.336m, T1 ≈ 0.151m and OH ≈ 0.009m, and so forth. This synthesis profile would generate a staggered sequence pattern in gel electrophoretic analysis, similar to that shown in Figure 1, lane 2.
Figure 5.

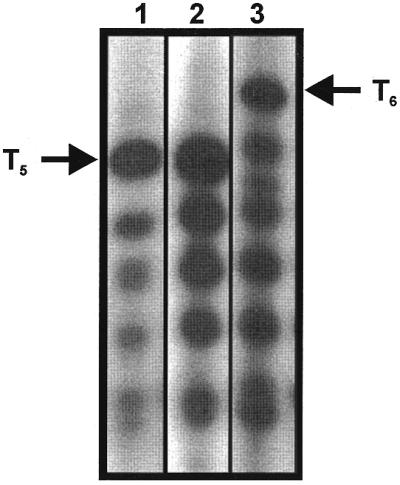
Assay of oligonucleotide synthesis using a termination nucleophosphoramidite, 5′-MeO-T, to probe the presence of available sites for coupling with a phosphoramidite at different reaction stages. Note that sequences terminated with 5′-MeO-T are not observed, since they cannot be 32P-labeled at the 5′-OH using T4 polynucleotide kinase. (A) Illustration of regular T3 synthesis. (B) Illustration of the use of the termination monomer. T on a glass plate is coupled with MeO-T, resulting in formation of a terminated dimer T-T(OMe), which cannot undergo further chain growth. (C) Illustration of the hypothesis for reaction with more hindered surface sites in several continued reaction cycles. If these sites exist oligonucleotides can be synthesized even after applying MeO-T in the coupling step. (D) 32P gel electrophoresis analysis of the experiments using the terminator 5′-MeO-T at different stages of oligonucleotide synthesis. Lane 1, sequences from a synthesis which used MeO-T in the first step of coupling, followed by coupling with DMT-T. The sites that failed to couple with MeO-T would produce regular sequences, such as T3. This sequence is clearly present in a significant ratio along with T2 and T1 fragments. Lane 2, sequences from a synthesis which used MeO-T at the second step of coupling, followed by coupling with DMT-T. The monomer T sites that failed to couple with MeO-T would produce regular sequences, such as T1–T3 or T4. Little T4 was observed in this experiment. The surface OH sites that failed to couple with DMT-T in the first step would also be responsible for the observed T1–3 sequences. Lane 3, sequences from a synthesis which used MeO-T at the third step, followed by coupling with DMT-T. T5 and T4 were not observed. There are reduced amounts of overall sequences and short Tn fragments. Lane 4, sequences from a synthesis which used MeO-T at the fourth step, followed by coupling with DMT-T. Only little T1–3 was observed. Lane 6, regular synthesis of T6 as a control.
In the experiments to examine stepwise coupling reactions the phosphoramidite of 5′-MeO-T (32) (MeOT), which is a close analog of DMT-T, was used as the chain terminator when it was added as the coupling monomer at step i (Fig. 5B). No capping was performed after MeOT coupling. If the coupling efficiency of the MeOT phosphoramidite is high, there will be few OH sites available for further chain growth in the subsequent synthesis cycles (Fig. 5B). The chain length of the oligonucleotide should be i. Failed coupling of MeOT can be detected if a sequence longer than i is found (Fig. 5C). Figure 5D displays the results of 32P labeling of one set of such experiments. Lane 5 is a regular synthesis performed as a reference. Lane 1 displays the T1–3 sequences formed in syntheses using MeOT termination in the first coupling cycle (coupling with the linker OH) followed by three steps of T coupling. The significant presence of T3 sequence is due to poor coupling of MeOT. Lane 2 is an experiment using MeOT termination in the second coupling cycle (coupling with the first T). If termination was incomplete, subsequent synthesis cycles would produce T4. Direct coupling to surface OH would result in T3 and other shorter sequences. Lane 2 shows much reduced T3 compared to that in lane 1 (Fig. 5) and nearly no T4. These results are consistent with that shown in Figure 3, indicating that most failure sites are at the linker surface, while the first few steps of synthesis also make minor contributions to overall synthesis failures. Similar synthesis strategies were applied to termination in the third or fourth steps (Fig. 5D, lanes 3 and 4). The formation of oligo(T) sequences was much reduced when termination with MeOT was performed in a later cycle. These patterns of Tn sequences coupled after MeOT termination are in agreement with gel electrophoresis analyses in that coupling yield is a function of chain length and higher coupling yields are achieved after at least the first cycle of oligonucleotide synthesis.
Cleavage of oligonucleotides immobilized on glass plates
In the examples discussed here and many of those reported in the literature (23–25,27–36) oligonucleotides are covalently attached to glass surfaces through silyl linkers containing amide, ether and/or other types of chemical bonds (Scheme 1), which are stable under mild acidic and neutral conditions. However, the surface Si-O bonds between the immobilized linkers and the glass surface are base-labile, while oligonucleotide deprotection requires basic conditions. Furthermore, the ammonolysis cleavage reaction has been applied to control sequence density on glass surfaces, since a suitable sequence density is required for binding of immobilized oligonucleotides to their complementary sequences or target molecules (12–14). Under these conditions the base-labile protection groups are removed from oligonucleotide sequences and, at the same time, the glass plate surface Si-O bonds are cleaved to release the oligonucleotides into solution. Therefore, it is important to characterize the cleavage of oligonucleotides under normal final deprotection conditions. It is desirable to be able to control sequence cleavage/retention on surfaces under various deprotection conditions.

Scheme 1.
Tn sequences (n = 8–18) were synthesized on CPG or glass plates containing silyl linkers, such as Si(CH2)3NHC(O)(CH2)3- (the amide linker, Scheme 1), which are stable under deprotection conditions (NMR found amide protons). Oligonucleotides were treated under various deprotection conditions. The solution samples containing oligonucleotides were collected at various times during the treatment and analyzed using either HPLC (CPG samples) or 32P gel analysis (glass plate samples). In addition to ammonolysis in aqueous ammonia, two sets of deprotection/cleavage conditions were examined. These included alkyl amines, such as ethylenediamine (EDA) and methylamine/aqueous ammonia (12–14,23–25,42). HPLC analysis quickly detected significant side products from treatment of oligonucleotides using methylamine (concentrated aqueous NH4OH for 5 min at 55°C, followed by addition of an equal volume of 40% aqueous methylamine) (data not shown). This reaction condition was not used further. Aqueous NH4OH is most commonly used for deprotection and cleavage of oligonucleotides on solid supports in regular synthesis using base-labile ester linkers. While this reaction condition would deprotect oligonucleotides on glass plate surfaces with non-cleavable linkers, cleavage would also occur at the Si-O bond. Multiple glass plates were treated with concentrated aqueous NH4OH at 55°C. Solution samples were taken at the indicated time intervals (0.25, 0.5, 1.0, 2.0, 4.0, 8.0 and 16 h) and analyzed using 32P gel electrophoresis. These results (Fig. 6 and Table 1) reveal that even within the first 30 min a significant number of the oligonucleotide sequences were cleaved (∼60% based on Table 1, using an intensity ratio of 51.0/81.2). Cleavage of oligonucleotides on glass surfaces leveled off in >2 h. Therefore, the half-life of cleavage of non-cleavable linker-attached oligonucleotides can be as short as an hour. In these experiments a time dependence on length distribution of the cleaved sequences was observed. Figure 6, lane 4 showing the longest cleavage reaction time exhibits many more failure sequences than those in lanes 1–3 at shorter cleavage reaction times (Fig. 6 and Table 1). A trend for increasing presence of short fragments with longer ammonia treatment is evident: 4.7% T2 at 15 min and 19.7% at 120 min; the sum of T2–9 nearly doubled over a period of 120 min (56.5/26.9) (Table 1). In contrast, the percentage of full-length sequence was higher with shorter ammonolysis (73.1% T10 at 15 min versus 43.5% at 120 min, Table 1). These results of sequence cleavage may be correlated with the synthesis profiles; the more accessible sites in the synthesis are also more quickly cleaved from the surface. It is likely that more exposed linker sites readily react with incoming reagents and that more hindered linker sites are slow to react with chemical reagents. These heterogeneous time-dependent cleavage patterns were also observed when CPG was used. EDA/EtOH (50/50 v/v) is an alternative deprotection condition (42) and has been used in deprotection of oligonucleotides synthesized on glass surfaces (29,30). Our HPLC and 32P gel analyses confirm that EDA/EtOH is a suitable choice for deprotection without cleavage of sequences from their bound surfaces.
Table 1. Time dependence of oligonucleotide cleavage from glass plates using ammonolysis (relative intensity comparison).
| Sequence | Time of aqueous ammonia treatment (min) | |||||||
| 15.0 | 30.0 | 60.0 | 120.0 | |||||
| |
Lane 1 |
Ratio |
Lane 2 |
Ratio |
Lane 3 |
Ratio |
Lane 4 |
Ratio |
| T10 | 57.8 | 73.1% | 51.0 | 65.0% | 63.8 | 54.4% | 81.2 | 43.5% |
| T2 | 3.7 | 4.7% | 5.8 | 7.4% | 17.6 | 15.0% | 36.8 | 19.7% |
| Sum (T9–T2) | 21.3 | 26.9% | 27.5 | 35.0% | 53.5 | 45.6% | 105.5 | 56.5% |
| T10/T2 | 15.6 | 8.8 | 3.6 | 2.2 | ||||
| T10/T9–2 | 2.7 | 1.9 | 1.2 | 0.8 |
Numbers in the first column of each time point are intensity readings of specific sequences (those cleaved from glass plates); the numbers in the second column are overall ratios for specific sequences [value = column 1 reading/sum (reading of all sequences)]. The decreased ratios of T10 over longer reactions times are not due to hydrolysis of the full-length sequence but due to the release of more shorter sequences with extended ammonolysis.
To summarize, the recent surge of interest in glass plate chemistry is driven by miniaturization for high throughput chemical and biochemical analyses and potentially for molecular computing. Glass plates as supporting surfaces have many advantages, such as their suitability for a wide range of chemical reactions, low background FR signals, ease of handling and low cost, over other types of solid materials. The importance of chemical fidelity, which is the basis for accurate and reproducible results, cannot be overemphasized. Although there is an extensive literature on glass surface derivatization and monolayer molecular immobilization (15–18,43), multi-step synthesis on planar glass surfaces has not been well characterized. The analysis of monolayer molecules synthesized on glass surfaces is also limited by the amount of material available. Although solid surface characterization and modern mass spectrometry may be the methods of choice, they do not provide definitive information about product purity and product distribution profiles. Hence, the results reported here represent initial steps towards detailed characterization of oligonucleotide synthesis on glass plates.
Most importantly, a proper reaction assay should be used. For oligonucleotide synthesis on glass plates 32P and FR labeling methods are sufficiently sensitive for sub-picomolar reactions, but in situ FR assays are predominantly used (27,33). However, our analyses using both methods revealed that in situ FR analyses in fact reflect the overall yield of the monomer coupling to all uncapped sequences present on the surface rather than purity of the final product. Furthermore, overall synthesis should be assayed after cleavage of oligonucleotides from glass plates to provide an overall account of synthesis quality. An earlier report discussed analysis of cleaved oligonucleotides labeled with fluorescent functional groups in the absence of experimental data (28). These cleavable linkers, which are different from those used in oligonucleotide array synthesis, were proposed in these discussions.
Extensive investigations of each reaction in an oligonucleotide synthesis cycle and individual reaction cycles in building oligonucleotides using DMT-protected nucleotide phosphoramidites described in this work reveal: (i) reactions, such as capping and coupling, at the linker OH surface are not as efficient as those with longer sequences; (ii) reaction efficiency improves in later reaction steps; (iii) reaction sites which are slow to react in the synthesis cycles are also cleaved from the surface more slowly. These characteristics may be attributed to ‘hindered’ sites on the glass surfaces, possibly in part due to the glass plate surface not being microscopically flat. In some areas molecules could be more hindered and suffer from steric hindrance when reacting with solution molecules, while in other areas molecules could be more accessible. This glass surface roughness is a well-studied subject (44). Another factor that may be responsible for the described observations is related to microfluidics. Reaction on a glass surface is under the influence of laminar flow and thus mass transfer is slow; while the porous microstructures of CPG can help create turbulent flow and thus mass transfer is relatively faster. CPG synthesis is thus less problematical, because its flow pattern enhances the accessibility of hindered reaction sites. Reaction kinetics strongly disfavor static reaction conditions that result in not only slow reactions but also poor synthesis fidelity. Our indication of poor reactions with linker molecules attached to glass surfaces may explain previously reported results (25) which used 14C monomer in a two-step coupling reaction (first coupling without capping, followed by 14C monomer coupling). The authors observed a strong radioisotope signal, indicating very poor coupling yield (<50%), in the first step of synthesis. This was attributed to ‘something other than alkylamine groups’ (the linker used) ‘on the support which can act as functional groups for phosphoramidite coupling’. Efforts by us, using a combination of measures, such as improved linker packing and density controlled synthesis, are underway to achieve uniform, high fidelity oligonucleotide arrays.
Acknowledgments
ACKNOWLEDGEMENTS
The authors thank Professor Erdogan Gulari and Mr Onnop Srivannavit (University of Michigan) for providing microarray glass plates. This research was supported by the Merck Genome Research Institute (X.G.), the R.A.Welch Foundation (X.G.), National Institutes of Health (X.Z. and X.G.) and National Foundation for Cancer Research (X.G.).
References
- 1.Gallop M.A., Barrett,R.W., Dower,W.J., Fodor,S.P.A. and Gordon,E.M. (1994) Applications of combinatorial technologies to drug discovery. 1. Background and peptide combinatorial libraries. J. Med. Chem., 37, 1233–1251. [DOI] [PubMed] [Google Scholar]
- 2.Gordon E.M., Barrett,R.W., Dower,W.J., Fodor,S.P.A. and Gallop,M.A. (1994) Applications of combinatorial technologies to drug discovery. 2. Combinatorial organic synthesis, library screening strategies and future directions. J. Med. Chem., 37, 1385–1401. [DOI] [PubMed] [Google Scholar]
- 3.Ellman J., Stoddard,B. and Wells,J. (1997) Combinatorial thinking in chemistry and biology. Proc. Natl Acad. Sci. USA, 94, 2779–2282. [DOI] [PMC free article] [PubMed] [Google Scholar]
- 4.Lebl M. (1999) Parallel personal comments on ‘classical’ papers in combinatorial chemistry. J. Comb. Chem., 1, 3–24. [DOI] [PubMed] [Google Scholar]
- 5.Jung G. (ed.) (1996) Combinatorial Peptide and Nonpeptide Libraries. VCH, New York, NY.
- 6.Lam K.S., Salmon,S.E., Hersh,E.M., Hruby,V.J., Kazmierski,W.M. and Knapp,R.J. (1991) A new type of synthetic peptide library for identifying ligand-binding activity. Nature, 354, 82–84. [DOI] [PubMed] [Google Scholar]
- 7.Houghten R.A., Pinilla,C., Blondelle,S.E., Appel,J.R., Dooley,C.T. and Cuervo,J.H. (1981) Generation and use of synthetic peptide combinatorial libraries for basic research and drug discovery. Nature, 354, 84–86. [DOI] [PubMed] [Google Scholar]
- 8.Delamarche E., Bernard,A., Schmid,H., Michael,B. and Biebuyck,H. (1997) Patterned delivery of immunoglobulins to surfaces using microfluidic networks. Science, 276, 779–781. [DOI] [PubMed] [Google Scholar]
- 9.Schullek J.R., Butler,J.H., Ni,Z.-J., Chen,D. and Yuan,Z. (1997) A high-density screening format for encoded combinatorial libraries: assay miniaturization and its application to enzymatic reactions. Anal. Biochem., 246, 20–29. [DOI] [PubMed] [Google Scholar]
- 10.Rowe C.A., Tender,L.M., Feldstein,M.J., Golden,J.P., Scruggs,S.B., MacCraith,B.D., Cras,J.J. and Ligler,F.S. (1999) Array biosensor for simultaneous identification of bacterial, viral and protein analytes. Anal. Chem., 71, 3846–3852. [DOI] [PubMed] [Google Scholar]
- 11.MacBeath G., Koehler,A.N. and Schreiber,S.L. (1999) Printing small molecules as microarrays and detecting protein–ligand interactions en masse. J. Am. Chem. Soc., 121, 7967–7968. [Google Scholar]
- 12.Maskos U. and Southern,E.M. (1992) Parallel analysis of oligodeoxyribonucleotide (oligonucleotide) interactions. I. Analysis of factors influencing oligonucleotide duplex formation. Nucleic Acids Res., 20, 1675–1678. [DOI] [PMC free article] [PubMed] [Google Scholar]
- 13.Fodor S.P.A., Read,J.L., Pirrung,M.C., Stryer,L., Lu,A.T. and Solas,D. (1991) Light-directed, spatially addressable parallel chemical synthesis. Science, 251, 767–773. [DOI] [PubMed] [Google Scholar]
- 14. The Chipping forecast. (1999) Nat. Genet., 21 (suppl.). [Google Scholar]
- 15.Wasserman S.R., Tao,Y.-T. and Whitesides,G.M. (1989) Stucture and reactivity of alkylsiloxane monolayers formed by reaction of alkytrichlorosilanes on silicon substrates. Langmuir, 5, 1074–1087. [Google Scholar]
- 16.Balachander N. and Sukenik,C.N. (1990) Monolayer transformation by nucleophilic substitution: applications to the creation of new monolayer assemblies. Langmuir, 6, 1621–1627. [Google Scholar]
- 17.Petri D.F.S., Wenz,G., Schunk,P. and Schimmel,T. (1999) An improved method for the assembly of amino-terminated monolayers on SiO2 and the vapor deposition of gold layers. Langmuir, 15, 4520–4523. [Google Scholar]
- 18.Ingall M.D.K., Homeyman,C.H., Mercure,J.V., Bianconi,P.A. and Kunz,R.R. (1999) Surface functionalization and imaging using monolyers and surface-grafted polymer layers. J. Am. Chem. Soc., 121, 3607–3613. [Google Scholar]
- 19.Katzhendler J., Cohen,S., Rahamim,E., Weisz, Ringel,I. and Deutsch,J. (1989) The effect of spacer, linkage and solid support on the synthesis of oligonucleotides. Tetrahedron, 45, 2777–2792. [Google Scholar]
- 20.Temsamani J., Kubert,M. and Agrawal,S. (1995) Sequence identity of the n – 1 product of a synthetic oligonucleotide. Nucleic Acids Res., 23, 1841–1844. [DOI] [PMC free article] [PubMed] [Google Scholar]
- 21.Fearon K.L., Stults,J.T., Bergot,B.J., Christensen,L.M. and Raible,A.M. (1995) Investigation of the ‘n – 1’ impurity in phosphorothioate oligodeoxynucleotides synthesized by the solid-phase β-cyanoethyl phosphoramidite method using stepwise sulfurization. Nucleic Acids Res., 23, 2754–2761. [DOI] [PMC free article] [PubMed] [Google Scholar]
- 22.Iyer R.P., Yu,D., Jiang,Z. and Agrawal,S. (1995) Improved procedure for the reduction of N-1 content in synthetic oligonucleotides. Nucl. Nucl., 14, 1349–1357. [Google Scholar]
- 23.Maskos U. and Southern,E.M. (1992) Oligonucleotide hybridization on glass supports: a novel linker for oligonucleotide synthesis and hybridization properties of oligonucleotides synthesized in situ. Nucleic Acids Res., 20, 1679–1684. [DOI] [PMC free article] [PubMed] [Google Scholar]
- 24.Gray D.E., Case-Green,S.C., Fell,T.S., Dobson,T.S. and Southern,E.M. (1997) Ellipsometric and interferometric characterization of DNA probes immobilized on a combinatorial array. Langmuir, 13, 2833–2842. [Google Scholar]
- 25.Shchepinov M.S., Case-Green,S.C. and Southern,E.M. (1997) Steric factors influencing hybridization of nucleic acids to oligonucleotide arrays. Nucleic Acids Res., 25, 1155–1161. [DOI] [PMC free article] [PubMed] [Google Scholar]
- 26.Guo Z., Guifoyle,R.A., Thiel,A.J., Wang,R. and Smith,L.M. (1994) Direct fluorescence analysis of genetic polymorphisms by hybridization with oligonucleotide arrays on glass supports. Nucleic Acids Res., 22, 5456–5465. [DOI] [PMC free article] [PubMed] [Google Scholar]
- 27.Pirrung M.C. and Bradley,J.-C. (1995) Comparison of methods for photochemical phosphoramidite-based DNA synthesis. J. Org. Chem., 60, 6270–6276. [Google Scholar]
- 28.McGall G.H. (1998) Methods for testing oligonucleotide arrays, US patent no. 5,843,655.
- 29.Pirrung M.C. and Fallon,L. (1998) Proofing of photolithographic DNA synthesis with 3′,5′-dimethoxybenzoinyloxycarbonyl-protected deoxynucleoside phosphoramidites. J. Org. Chem., 63, 241–246. [Google Scholar]
- 30.Pease A.C., Solas,D., Sullivan,E.J., Cronin,M.T., Holmes,C.P. and Fodor,S.P.A. (1994) Light-generated oligonucleotide arrays for rapid DNA sequence analysis. Proc. Natl Acad. Sci. USA, 91, 5022–5026. [DOI] [PMC free article] [PubMed] [Google Scholar]
- 31.McGall G.H., Labadie,J., Brock,P., Wallraff,G., Nguyen,T. and Hinsberg,W. (1996) Light-directed synthesis of high-denstiy oligonucleotide arrrays using semiconductor photoresists. Proc. Natl Acad. Sci. USA, 93, 13555–13560. [DOI] [PMC free article] [PubMed] [Google Scholar]
- 32.McGall G.H., Barone,A.D., Diggelmann,M., Fodor,S.P.A., Gentalen,E. and Ngo,N. (1997) The efficiency of light-directed synthesis of DNA arrays on glass substrates. J. Am. Chem. Soc., 119, 5081–5090. [Google Scholar]
- 33.Beier M. and Hoheisel,J.D. (1999) Versatile derivatization of solid support media for covalent bonding on DNA-microchips. Nucleic Acids Res., 27, 1970–1977. [DOI] [PMC free article] [PubMed] [Google Scholar]
- 34.Gao X., Yu,P., Leproust,E., Sonigo,L., Pellois,J.P. and Zhang,H. (1998) Oligonucleotide synthesis using solution photogenerated acids. J. Am. Chem. Soc., 120, 12698–12699. [Google Scholar]
- 35.LeProust E., Pellois,J.P., Yu,P., Zhang,H., Srivannavit,O., Gulari,E., Zhou,X. and Gao,X. (2000) Combinatorial screening method for synthesis optimization on a digital light-controlled microarray platform. J. Comb. Chem., 2, 349–354. [DOI] [PubMed] [Google Scholar]
- 36.Pellois J.P., Wang,W. and Gao,X. (2000) Peptide synthesis based on t-Boc chemistry and solution photogenerated acids. J. Comb. Chem., 2, 355–360. [DOI] [PubMed] [Google Scholar]
- 37.Singh-Gasson S., Green,R.D., Yue,Y., Nelson,C., Blattner,F., Sussman,M.R. and Cerrina,F. (1999) Maskless fabrication of light-directed oligonucleotide microarrays using a digital micromirror array. Nat. Biotechnol., 17, 974–978. [DOI] [PubMed] [Google Scholar]
- 38.Brush C.K. (1996) Fluorescein labelled phosphoramidites, US patent no. 5,583,236.
- 39.Andrus A. (1992) Fluorescent dye phosphoramidite labelling of oligonucleotides. Tetrehedron Lett., 33, 5033–5036. [DOI] [PubMed] [Google Scholar]
- 40.Kowollik G., Gaertner,K. and Langen,P. (1966) 5′-O-methylthymidine. Angew. Chem. Int. Ed., 5, 735–736. [Google Scholar]
- 41.McBride L.J. and Caruthers,M.H. (1983) An investigation of several deoxynucleotide phosphoramidites. Tetrahedron Lett., 24, 245–248. [Google Scholar]
- 42.Barnett R.W. and Letsinger,R.L. (1981) Debenzoylation of N-benzoylnucleoside derivatives with ethylenediamine-phenol. Tetrahedron Lett., 22, 991–994. [Google Scholar]
- 43.Pesek J.J., Matyska,M.T. and Abuelafiya,R.R. (eds) (1995) Chemically Modified Surfaces: Recent Developments. Royal Society of Chemistry, Cambridge, UK.
- 44.Tang S.K., Vassiliev,V.Y., Mridha,S. and Chan,L.H. (1999) Investigation of borophosphosilicate glass roughness and planarization with the atomic force microscope technique. Thin Solid Films, 352, 77–84 [Google Scholar]