

Abstract
Objective: This study aimed to investigate the effects of intensive pitavastatin therapy on glucose control in patients with non-ST elevation acute coronary syndrome (ACS). Methods: Patients who had ACS with significant stenosis on initial coronary angiography and received successful percutaneous coronary intervention (PCI) in the Second Hospital of Hebei Medical University, Shijiazhuang, China from August 2015 to January 2016 were enrolled in this study. The patients were randomized to receive pitavastatin (4 mg daily) or atorvastatin (20 mg daily). PCI was performed within 72 hours after admission according to the current clinical practice at the physician’s discretion. The examinations of blood lipid levels and blood markers of glucose metabolism were performed at baseline and after 6-month follow-up using standard techniques. The inflammatory markers, including white blood cell, high-sensitivity C-reactive protein (hs-CRP) and fibrinogen, were also assessed before PCI and 24 hours after PCI. An independent adverse event assessment committee evaluated major adverse cardiovascular events (MACE) and any other adverse events. Results: A total of 132 patients were enrolled and randomly divided into the pitavastatin group (n = 65) or the atorvastatin group (n = 67), which had similar baseline characteristics and PCI procedural characteristics. For the inflammatory biomarkers at 24 hours after PCI, the fibrinogen level was significantly increased in the atorvastatin group; the hs-CRP levels were significantly increased in both groups, however, the hs-CRP level in the pitavastatin group was lower than that in the atorvastatin group. In addition, the blood lipid parameters (e.g., TC, LDL-C, TG, non-HDL-C and Apo B) were significantly decreased in both groups after 6-month follow-up (P < 0.01), but these parameters between the two groups had no significant difference. After 6-month follow-up, the FPG, IRI, HOMA-IR and HbA1c levels were significantly decreased in the pitavastatin group (P < 0.05) but slightly increased in the atorvastatin group, indicating that the glucose homeostasis was improved in patients in the pitavastatin group but not in the atorvastatin group. Furthermore, the incidence of MACE was not significantly different between the two groups (P > 0.05). After 6-month antiplatelet treatment, the PAR value was significantly decreased in both groups (P < 0.01), but the PAR value in the pitavastatin group was lower than that in the atorvastatin group. Conclusion: Pitavastatin therapy may improve the glucose homeostasis for patients with ACS undergoing PCI and has more favorable outcomes than atorvastatin therapy.
Keywords: Intensive pitavastatin therapy, glucose metabolism, non-ST elevation acute coronary syndrome, percutaneous coronary intervention
Introduction
Acute coronary syndrome (ACS) is a clinical manifestation of coronary artery disease (CAD), and patients with ACS are at a very high risk of life-threatening cardiovascular events [1]. Now the percutaneous coronary intervention (PCI) is a recommended approach for the treatment of ACS and optimized medical therapies are imminently required for ACS patients [2]. The 3-hydroxy-3-methylglutaryl coenzyme A reductase inhibitors (statins) decrease the level of low-density lipoprotein cholesterol (LDL-C), and have anti-inflammatory and immunomodulatory effects on atherosclerotic plaque [3,4]. Previous studies found that intensive statin therapy had been proven to be superior in improving cardiovascular outcomes as compared to mild statin therapy [5]. Current guidelines, therefore, recommend a more aggressive LDL-C target of 70 mg/dL (< 1.8 mmol/L) for ACS patients or a > 50% reduction in LDL-C level from baseline [6-8]. Up to now, it has been proved that atorvastatin, pitavastatin and rosuvastatin have intensive LDL-C lowering effects in clinical practice. However, several statins have been shown to increase insulin resistance, glucose level and glycosylated hemoglobin (HbA1c), which may lead to an increased risk of new-onset diabetes [9-11]. The exact effect of pitavastatin on glycemic control remains controversial [12] and has not been evaluated as the primary endpoint in previous clinical studies. Thus, the objective of the present study was to investigate the effects of intensive pitavastatin therapy on glucose control in patients with non-ST elevation acute coronary syndrome.
Subjects and methods
Study population
All the patients who suffered from ACS with significant stenosis on initial coronary angiography and received successful PCI in the Second Hospital of Hebei Medical University from August 2015 to January 2016 were eligible for inclusion in the present study. The diagnosis of ACS was made based on the fulfillment of at least two of the following three criteria: (1) the evidence of coronary ischemia on ECG, (2) the increase (≥ 2 fold) of serum creatinine kinase (CK) or CK-MB levels and/or troponin-I positivity, and (3) the presence of symptoms suggestive of ACS. Diabetes mellitus (DM) and other complications were diagnosed by attending physicians. Exclusion criteria included failed PCI, diseased bypass graft, recommended CABG, cardiogenic shock, hepatic insufficiency, renal insufficiency, and administration of lipid-lowering drugs (statin, clofibrate, probucol or analog, nicotinic acid, or other prohibited drugs) before enrollment.
When being admitted to the Department of Cardiology, all eligible patients were randomly divided into the pitavastatin (4 mg daily) group or the atorvastatin (20 mg daily) group.
Patient enrollment was carried out according to the principles of the Declaration of Helsinki. The study protocol was approved by the Ethical Committee of the Second Hospital of Hebei Medical University. The written informed consent was obtained from each patient before his/her participation. The registration number is ChiCTR-IPR-15007035.
Percutaneous coronary intervention and medical therapies
PCI was performed within 48 hours after admission according to the current clinical practice at the physician’s discretion. For all patients, aspirin (300 mg/day) and clopidogrel (300 mg/day) were loaded before the procedure, and aspirin (100 mg/day) and clopidogrel (75 mg/day) were prescribed as maintenance dosages for at least 1 year. An intravenous bolus of 5,000 U of unfractionated heparin was administered, and then additional heparin was administered to maintain an activated clotting time greater than 300 s during the procedure. Platelet glycoprotein IIb/IIIa inhibitor (GPI) tirofiban was administered according to the operator’s preference. Other drugs were administered according to the current guidelines.
Blood sample tests
The examinations of blood lipid levels and blood markers of glucose metabolism (including HbA1c) were performed at baseline and after 6-month follow-up using standard techniques. Blood samples were obtained between 08:00 am and 10:00 am after overnight fast. The inflammatory markers, including white blood cell (WBC), high-sensitivity C-reactive protein (hs-CRP) and fibrinogen, were also assessed before PCI and 24 hours after PCI. Safety was evaluated at 6 months after enrollment. An independent event assessment committee evaluated major adverse cardiovascular events (MACE) and any other adverse events. MACE included recurrent angina, target vessel revascularization, sudden death, and/or heart failure.
Statistical analysis
SPSS 19.0 statistical software was used for all calculations. The continuous variables were reported as means ± SD and were compared using the unpaired t-test for normally distributed values and the Mann-Whitney U test for non-normally distributed variables. The categorical variables were expressed as absolute or relative frequencies and were compared using chi-square test or the Fisher’s exact test, as appropriate to the cell frequencies. To compare the changes in the levels of lipid, glucose and inflammatory biomarkers before and after PCI, a paired t-test was used. P < 0.05 was considered statistically significant.
Results
In this study, a total of 148 patients met the inclusion criteria and 16 patients were excluded after CAG (8 patients underwent CAG only, 5 patients were recommended to receive CABG, and 3 patients lost to follow-up). Therefore, a total of 132 patients were enrolled finally and randomly divided into the pitavastatin group (n = 65) or the atorvastatin group (n = 67) (see Figure 1).
Figure 1.
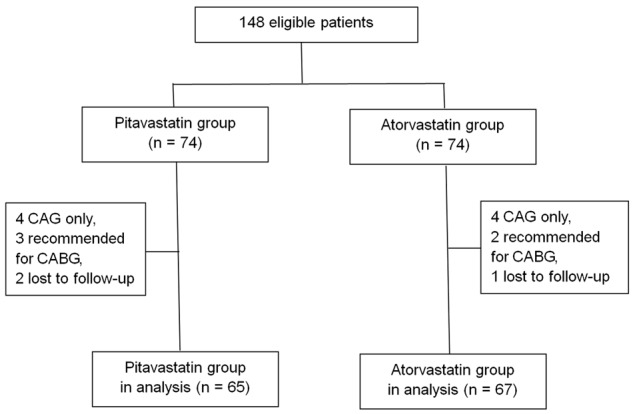
Patients enrolled in the present study.
Baseline characteristics between the two groups
Baseline clinical characteristics were shown in Table 1. There were no significant differences in baseline clinical characteristics between the two groups, including age, gender, body mass index (BMI), risk factors of CAD, cardiac functions, as well as initial medications (P > 0.05).
Table 1.
Baseline characteristics of the two groups
| Pitavastatin group (n = 65) | Atorvastatin group (n = 67) | P value | |
|---|---|---|---|
| Age (yr.) | 65.8±10.5 | 65.3±9.3 | 0.7724 |
| Male-n (%) | 40 (61.5) | 43 (64.2) | 0.8936 |
| BMI (kg/m2) | 24.2±3.4 | 24.5±3.7 | 0.6287 |
| Waist circumference (cm) | 87.1±8.8 | 86.4±9.5 | 0.6615 |
| History | |||
| Hypertension-n (%) | 43 (66.2) | 40 (59.7) | 0.5572 |
| Family history of CAD-n (%) | 14 (21.5) | 15 (22.4) | 0.9264 |
| Smoking-n (%) | 32 (50.8) | 34 (50.7) | 1.0000 |
| Alcohol drinker-n (%) | 33 (50.8) | 29 (43.3) | 0.4920 |
| Diabetes-n (%) | 29 (44.6) | 28 (41.8) | 0.8794 |
| Types of ACS | 0.8756 | ||
| Unstable angina-n (%) | 35 (53.8) | 38 (56.7) | |
| NSTEMI-n (%) | 30 (46.2) | 29 (43.3) | |
| GRACE score | 167±37 | 170±40 | 0.6556 |
| CRUSADE score | 34.7±10.2 | 33.8±8.1 | 0.4548 |
| SBP (mmHg) | 127±5.8 | 129±7.6 | 0.0923 |
| Heart rate (bpm) | 74±3.5 | 73±3.2 | 0.0841 |
| Hemoglobin (g/L) | 140.6±12.2 | 141.8±13.4 | 0.5918 |
| Hs-CRP (mg/L) | 10.3±5.5 | 10.5±6.1 | 0.8436 |
| eGFR- (mL/min/1.73 m2) | 74.5±16.1 | 72.6±15.2 | 0.4868 |
| LVEF (%) | 54.2±7.1 | 54.9±8.3 | 0.6040 |
| Drug administration | |||
| Aspirin-n (%) | 65 (100) | 66 (98.5) | 1.000 |
| Clopidogrel-n (%) | 61 (93.8) | 60 (89.6) | 0.5313 |
| β-blocker-n (%) | 59 (90.8) | 59 (88.1) | 0.8399 |
| Calcium blocker-n (%) | 30 (46.2) | 28 (41.8) | 0.7418 |
| Diuretics-n (%) | 11 (16.9) | 12 (17.9) | 0.9363 |
| ACEI/ARB-n (%) | 54 (83.1) | 58 (86.6) | 0.7517 |
| Insulin-n (%) | 3 (4.6) | 4 (6.0) | 1.000 |
| Nitrate-n (%) | 23 (35.4) | 26 (38.8) | 0.8207 |
| Sulfonylurea-n (%) | 8 (12.3) | 7 (10.4) | 0.9503 |
| α-glucosidase inhibitor-n (%) | 9 (13.8) | 8 (11.9) | 0.9466 |
Note: BMI: body mass index; CAD: coronary artery disease; ACS: acute coronary syndrome; NSTEMI: non-ST segment elevated myocardial infarction; SBP: systolic blood pressure; hs-CRP: high-sensitivity C-reactive protein; eGFR: estimated glomerular filtration rate; LVEF: left ventricle ejection fraction; ACEI/ARB: angiotensin converting enzyme inhibitor/angiotensin receptor blocker.
Procedural characteristics between the two groups
The coronary angiography (CAG) and PCI procedures were performed via the radial artery in all patients. There were no significant differences in the distributions of target vessels, PCI procedurals and drug medications between the two groups (P > 0.05). The procedural characteristics were shown in Table 2.
Table 2.
Procedural characteristics between the two groups
| Pitavastatin group (n = 65) | Atorvastatin group (n = 67) | P value | |
|---|---|---|---|
| Multivessel disease-n (%) | 34 (52.3) | 33 (49.3) | 0.8599 |
| Target vessel | 0.9163 | ||
| LM-n (%) | 1 (1.5) | 2 (3.0) | |
| LAD-n (%) | 34 (52.3) | 32 (47.8) | |
| LCX-n (%) | 13 (20.0) | 14 (20.9) | |
| RCA-n (%) | 17 (26.2) | 19 (23.4) | |
| Stent per person | 1.4±0.8 | 1.5±0.8 | 0.4741 |
| Length of stent (mm) | 40±24 | 41±23 | 0.8073 |
| Diameter of stent (mm) | 3.2±0.3 | 3.2±0.4 | 1.0000 |
| Time from symptom onset (h) | 45 (23, 65) | 47 (21, 68) | 0.7582 |
| GP IIb/IIIa inhibitor-n (%) | 14 (21.5) | 17 (25.4) | 0.7533 |
Note: LM: left main; LAD: left anterior descending coronary artery; LCX: left circumflex branch; RCA: right coronary artery.
Changes of inflammatory biomarkers after PCI
Levels of WBC, fibrinogen and hs-CRP were measured before PCI and 24 hours after PCI. The baseline levels of WBC, fibrinogen and hs-CRP were similar between the two groups. No significant difference was observed in the level of WBC after PCI. The level of fibrinogen was significantly increased in the atorvastatin group, but no significant change was observed in the pitavastatin group. The hs-CRP levels were significantly increased 24 hours after PCI in both groups (P < 0.01); however, the level of hs-CRP in the pitavastatin group was lower than that in the atorvastatin group (P < 0.05) (see Table 3).
Table 3.
Changes of inflammatory biomarkers 24 hours after PCI
| Pitavastatin group (n = 65) | Atorvastatin group (n = 67) | |||
|---|---|---|---|---|
|
| ||||
| Before PCI | 24 h after PCI | Before PCI | 24 h after PCI | |
| WBC (×109/L) | 8.4±2.5 | 8.5±2.7 | 8.2±2.0 | 8.4±2.6 |
| Fibrinogen (g/L) | 2.98±0.76 | 3.15±0.89 | 3.03±0.80 | 3.39±0.94* |
| hs-CRP (mg/L) | 10.3±5.5 | 13.6±8.4*,# | 10.5±6.1 | 16.8±9.7* |
Note: WBC: white blood cell; hs-CRP: high-sensitivity C-reactive protein;
compared with baseline, P < 0.01;
compared with atorvastatin group, P < 0.05.
Changes of lipids parameters 6 months after PCI
The lipid parameters before PCI and 6 months after PCI were shown in Table 4. Both the lipid parameters at baseline and after 6-month follow-up had no significant difference between the two groups. However, after 6-month follow-up, the TC, LDL-C, TG, non-HDL-C and Apo B levels were significantly decreased and the HDL-C and Apo A1 levels were significantly increased (P < 0.01) from baseline in both groups. The ratios of LDL-C/HDL-C and Apo A1/Apo B were also decreased 6 months after PCI (P < 0.01).
Table 4.
Changes of lipid parameters 6 months after PCI
| Pitavastatin group (n = 65) | Atorvastatin group (n = 67) | |||
|---|---|---|---|---|
|
| ||||
| Before PCI | 6 months | Before PCI | 6 months | |
| TC (mmol/L) | 5.52±0.91 | 4.10±0.67* | 5.55±0.96 | 4.09±0.71* |
| LDL-C (mmol/L) | 3.46±0.76 | 1.96±0.62* | 3.49±0.80 | 1.98±0.69* |
| HDL-C (mmol/L) | 1.17±0.29 | 1.45±0.33* | 1.16±0.25 | 1.43±0.31* |
| TG (mmol/L) | 1.95±0.73 | 1.53±0.58* | 1.98±0.84 | 1.51±0.62* |
| LDL-C/HDL-C | 2.95±0.55 | 1.35±0.47* | 3.01±0.52 | 1.38±0.46* |
| Non-HDL-C (mmol/L) | 4.35±0.88 | 2.65±0.74* | 4.39±0.83 | 2.66±0.79* |
| Apo A1 (mmol/L) | 3.02±0.45 | 3.61±0.66* | 3.05±0.41 | 3.49±0.52* |
| Apo B (mmol/L) | 2.74±0.56 | 2.25±0.44* | 2.73±0.50 | 2.31±0.49* |
| Apo A1/Apo B | 0.91±0.24 | 0.62±0.18* | 0.90±0.22 | 0.66±0.20* |
Note: TC: total cholesterol; LDL-C: low-density lipoprotein cholesterol; HDL-C: high-density lipoprotein cholesterol; TG: triglyceride; Apo A1: apolipoprotein A1; Apo B: apolipoprotein B;
compared with baseline, P < 0.01.
Changes of blood markers of glucose metabolism 6 months after PCI
The baseline levels of fasting plasma glucose (FPG), insulin resistant index (IRI), HOMA-insulin resistance (HOMA-IR) and HbA1c were comparable between the two groups. After 6-month follow-up, the levels of FPG, IRI, HOMA-IR and HbA1c were decreased significantly in the pitavastatin group (P < 0.05) but increased slightly in the atorvastatin group. The level of HbA1c in the pitavastatin group was significantly lower than that in the atorvastatin group (P < 0.05) (see Table 5).
Table 5.
Changes of blood markers of glucose metabolism 6 months after PCI
| Pitavastatin group (n = 65) | Atorvastatin group (n = 67) | |||
|---|---|---|---|---|
|
| ||||
| Before PCI | 6 months | Before PCI | 6 months | |
| FPG (mmol/L) | 6.02±0.84 | 5.78±0.72# | 5.99±0.78 | 6.23±0.92 |
| IRI (μU/mL) | 8.70±5.32 | 7.56±4.86# | 8.68±5.41 | 9.67±6.15 |
| HOMA-IR | 2.3±1.4 | 1.9±0.8&,# | 2.2±1.2 | 2.5±1.6 |
| HbA1c (%) | 5.8±0.7 | 5.8±0.5#,& | 5.8±0.6 | 6.1±0.9 |
Note: FPG: fasting plasma glucose; IRI: insulin resistant index; HOMA-IR: HOMA-insulin resistance;
compared with baseline, P < 0.05;
compared with atorvastatin group, P < 0.05.
Incidence of MACE during 6-month follow-up
No significant difference was observed between the two groups in the incidence of MACE, which included recurrent angina, target vessel revascularization, sudden death, and heart failure (P > 0.05) (see Table 6).
Table 6.
Incidence of MACE during 6 months of follow-up
| Pitavastatin group (n = 65) | Atorvastatin group (n = 67) | P value | |
|---|---|---|---|
| Total incidence of MACE-n (%) | 6 (9.2) | 8 (11.9) | 0.8237 |
| Recurrent angina-n (%) | 3 (4.6) | 4 (6.0) | 1.000 |
| Target vessel revascularization-n (%) | 2 (3.1) | 2 (3.0) | 1.000 |
| Sudden death-n (%) | 0 (0) | 0 (0) | - |
| Heart failure-n (%) | 1 (1.5) | 2 (3.0) | 1.000 |
Note: MACE: major adverse cardiovascular event.
Comparisons of liver function, renal function and platelet aggregation rate
The changes of liver function, renal function and platelet aggregation rate (PAR) were shown in Table 7. The baseline levels were similar between the two groups. After 6-month follow-up, the changes of liver and renal functions in the two groups had no significant difference. However, the PAR value was significantly decreased in both groups after 6 months of antiplatelet treatments (P < 0.01), and the PAR value in the pitavastatin group was lower than that in the atorvastatin group (P < 0.05).
Table 7.
Comparison of liver function, renal function and platelet aggregation rate before PCI and 6 months after PCI
| Pitavastatin group (n = 65) | Atorvastatin group (n = 67) | |||
|---|---|---|---|---|
|
| ||||
| Before PCI | 6 months | Before PCI | 6 months | |
| ALT (U/L) | 35±7 | 37±8 | 36±6 | 38±11 |
| AST (U/L) | 34±7 | 36±8 | 36±7 | 38±10 |
| SCr (μmol/L) | 79.3±13.5 | 82.6±18.1 | 76.8±10.4 | 80.5±16.7 |
| eGFR (mL/min/1.73 m2) | 74.5±16.1 | 72.4±14.9 | 72.6±15.2 | 70.6±14.2 |
| PAR (%) | 73.8±20.3 | 51.4±12.7*,# | 72.4±21.2 | 57.5±14.8* |
Note: ALT: alanine aminotransferase; AST: aspartate aminotransferase; SCr: serum creatinine; eGFR: estimated glomerular filtration rate; PAR: platelet aggregation rate;
compared with baseline, P < 0.01;
compared with atorvastatin group, P < 0.05.
Discussion
In this study, the intensive pitavastatin therapy in ACS patients showed more favorable effects in serum glucose levels and PAR value than the atorvastatin treatment.
Coronary artery disease, including ACS, is the leading cause of death globally. The association between elevated LDL-C and increased risk of CAD has been well established. Therefore, intensive statin therapy is recommended in current guidelines in order to decrease the level of LDL-C. As atorvastatin, pitavastatin and rosuvastatin, which are known as strong statins, have intensive LDL-C lowering effects in clinical practice, they are suitable for the treatments of ACS. In Asian patients, atorvastatin 10 mg/day, pitavastatin 2 mg/day and rosuvastatin 2.5 mg/day showed similar effects in LDL-C reduction [13]. Our study showed that the lipid lowering effects of pitavastatin and atorvastatin were similar, which was consistent with the results of previous studies. Despite the beneficial effects of statins on cardiovascular disease, a recent meta-analysis of 13 randomized studies showed that statin therapies significantly increased the incidence of new-onset diabetes by 9% [14]. In particular, some reports indicated that atorvastatin could adversely affect glycemic control, as what was observed in our study in Table 5. Pitavastatin is a new statin marginally metabolized by cytochrome P450 isoenzymes with potent LDL cholesterol-lowering effect similar to atorvastatin and particularly low potential for drug-drug interactions [15]. However, data on the potential impact of statin treatment on glucose homeostasis in patients with ACS are controversial. With regard to blood glucose control, a recent study reported that pitavastatin was neutral, whereas atorvastatin caused deterioration of glycemic control in patients with type 2 diabetes [16]. In contrast, some studies did not show such favorable effects of pitavastatin compared with atorvastatin [17].
In this study, we found that the levels of FPG, IRI, HOMA-IR and HbA1c were significantly decreased in the pitavastatin group and slightly increased in the atorvastatin group after 6-month follow-up. The level of HbA1c in the pitavastatin group was significantly lower than that in the atorvastatin group (see Table 5). The results indicated that intensive pitavastatin therapy could improve the glucose homeostasis in patients with ACS, but atorvastatin treatment had no such effect. The mechanisms by which some statins may exert diabetogenic effects currently remain unclear. It was reported that atorvastatin could attenuate expression of the glucose transporter GLUT-4 in adipocytes, thus impairing glucose tolerance [18], while elevated level of ceramide transported in LDL appeared to be correlated with increased insulin resistance [19]. Moreover, changes in the expression of insulin-sensitive glucose transporters, or the dysregulation of cellular cholesterol pathways leading to accumulation of triglycerides in pancreatic beta cells, might be involved in lipotoxicity and apoptosis of insulin-secreting beta cells [20]. On the other hand, the neutral effect of high-dose pitavastatin on the parameters of glucose homeostasis seen in the PREVAIL-US validation subset was similar to the effect seen in the PREVAIL-US comparison subset treated with pravastatin. This finding is important given that pravastatin has been consistently associated with the lowest diabetogenic risk of all members of the statin class. Intensive pitavastatin therapy may be a safer option for glucose control in ACS patients.
Another finding of this study was that the PAR value in the pitavastatin group was lower than that in the atorvastatin group, which indicated that there might be less interaction between pitavastatin and clopidogrel. This effect may be beneficial to ACS patients who accepted clopidogrel therapy after PCI. The reason for this may be that pitavastatin is minimally metabolized by cytochrome P450 (CYP) isoenzymes and the possibility of interaction with drugs metabolized by inhibiting or inducing CYP enzymes is low [21].
This is a small scale study. Therefore, further adequately-powered studies will be needed to determine whether these physiological observations can be translated to patient outcome improvement and to assess the safety of this treatment strategy.
In conclusion, pitavastatin therapy may improve the glucose homeostasis for patients with ACS undergoing PCI and has more favorable outcomes than atorvastatin therapy.
Disclosure of conflict of interest
None.
References
- 1.Global Burden of Disease Study 2013 Collaborators. Global, regional, and national incidence, prevalence, and years lived with disability for 301 acute and chronic diseases and injuries in 188 countries, 1990-2013: a systematic analysis for the Global Burden of Disease Study 2013. Lancet. 2015;386:743–800. doi: 10.1016/S0140-6736(15)60692-4. [DOI] [PMC free article] [PubMed] [Google Scholar]
- 2.Du L, Dong P, Jia J, Li Z, Lai L, Yang X, Wang S, Yang X, Li Z, Shang X, Fan X. Impacts of intensive follow-up on the long-term prognosis of percutaneous coronary intervention in acute coronary syndrome patients-a single center prospective randomized controlled study in a Chinese population. Eur J Prev Cardiol. 2016;23:1077–1085. doi: 10.1177/2047487315607041. [DOI] [PubMed] [Google Scholar]
- 3.Ridker PM, Danielson E, Fonseca FA, Genest J, Gotto AM Jr, Kastelein JJ, Koenig W, Libby P, Lorenzatti AJ, Macfadyen JG, Nordestgaard BG, Shepherd J, Willerson JT, Glynn RJ JUPITER Trial Study Group. Reduction in C-reactive protein and LDL cholesterol and cardiovascular event rates after initiation of rosuvastatin: a prospective study of the JUPITER trial. Lancet. 2009;373:1175–1182. doi: 10.1016/S0140-6736(09)60447-5. [DOI] [PubMed] [Google Scholar]
- 4.Tian J, Gu X, Sun Y, Ban X, Xiao Y, Hu S, Yu B. Effect of statin therapy on the progression of coronary atherosclerosis. BMC Cardiovasc Disord. 2012;12:70. doi: 10.1186/1471-2261-12-70. [DOI] [PMC free article] [PubMed] [Google Scholar]
- 5.Cannon CP, Steinberg BA, Murphy SA, Mega JL, Braunwald E. Meta-analysis of cardiovascular outcomes trials comparing intensive versus moderate statin therapy. J Am Coll Cardiol. 2006;48:438–445. doi: 10.1016/j.jacc.2006.04.070. [DOI] [PubMed] [Google Scholar]
- 6.Zhang X, Hu D. Comments for 2013 ACC/AHA guideline on the treatment of blood cholesterol to reduce atherosclerotic cardiovascular risk in adults. Chinese J Intern Med. 2015;54:9–12. [PubMed] [Google Scholar]
- 7.Stone NJ, Robinson JG, Lichtenstein AH, Bairey Merz CN, Blum CB, Eckel RH, Goldberg AC, Gordon D, Levy D, Lloyd-Jones DM, McBride P, Schwartz JS, Shero ST, Smith SC Jr, Watson K, Wilson PW American College of Cardiology/American Heart Association Task Force on Practice Guidelines. 2013 ACC/AHA guideline on the treatment of blood cholesterol to reduce atherosclerotic cardiovascular risk in adults: a report of the American College of Cardiology/American Heart Association Task Force on Practice Guidelines. J Am Coll Cardiol. 2014;63:2889–2934. doi: 10.1016/j.jacc.2013.11.002. [DOI] [PubMed] [Google Scholar]
- 8.Catapano AL, Graham I, De Backer G, Wiklund O, Chapman MJ, Drexel H, Hoes AW, Jennings CS, Landmesser U, Pedersen TR, Reiner Ž, Riccardi G, Taskinen MR, Tokgozoglu L, Verschuren WM, Vlachopoulos C, Wood DA, Zamorano JL. ESC/EAS guidelines for the management of dyslipidaemias: the task force for the management of dyslipidaemias of the European society of cardiology (ESC) and the European atherosclerosis society (EAS) Eur Heart J. 2011;32:1769–1818. doi: 10.1093/eurheartj/ehr158. [DOI] [PubMed] [Google Scholar]
- 9.Maki KC, Ridker PM, Brown WV, Grundy SM, Sattar N The Diabetes Subpanel of the National Lipid Association Expert Panel. An assessment by the Statin Diabetes Safety Task Force: 2014 update. J Clin Lipidol. 2014;8(Suppl):S17–S29. doi: 10.1016/j.jacl.2014.02.012. [DOI] [PubMed] [Google Scholar]
- 10.Ma T, Tien L, Fang CL, Liou YS, Jong GP. Statins and new-onset diabetes: a retrospective longitudinal cohort study. Clin Ther. 2012;34:1977–1983. doi: 10.1016/j.clinthera.2012.08.004. [DOI] [PubMed] [Google Scholar]
- 11.Ma T, Chang MH, Tien L, Liou YS, Jong GP. The long-term effect of statins on the risk of new-onset diabetes mellitus in elderly Taiwanese patients with hypertension and dyslipidaemia: a retrospective longitudinal cohort study. Drugs Aging. 2012;29:45–51. doi: 10.2165/11597250-000000000-00000. [DOI] [PubMed] [Google Scholar]
- 12.Masana L. Pitavastatin in cardiometabolic disease: therapeutic profile. Cardiovasc Diabetol. 2013;12(Suppl 1):S2. doi: 10.1186/1475-2840-12-S1-S2. [DOI] [PMC free article] [PubMed] [Google Scholar]
- 13.Kakuda H, Matoba M, Nakatoh H, Nagao S, Takekoshi N. Comparison of atorvastatin, pitavastatin and rosuvastatin for residual cardiovascular risk using non-fasting blood sampling. Scand J Clin Lab Invest. 2014;74:285–295. doi: 10.3109/00365513.2014.882015. [DOI] [PubMed] [Google Scholar]
- 14.Sattar N, Preiss D, Murray HM, Welsh P, Buckley BM, de Craen AJ, Seshasai SR, McMurray JJ, Freeman DJ, Jukema JW, Macfarlane PW, Packard CJ, Stott DJ, Westendorp RG, Shepherd J, Davis BR, Pressel SL, Marchioli R, Marfisi RM, Maggioni AP, Tavazzi L, Tognoni G, Kjekshus J, Pedersen TR, Cook TJ, Gotto AM, Clearfield MB, Downs JR, Nakamura H, Ohashi Y, Mizuno K, Ray KK, Ford I. Statins and risk of incident diabetes: a collaborative metaanalysis of randomised statin trials. Lancet. 2010;375:735–742. doi: 10.1016/S0140-6736(09)61965-6. [DOI] [PubMed] [Google Scholar]
- 15.Hiro T, Kimura T, Morimoto T, Miyauchi K, Nakagawa Y, Yamagishi M, Ozaki Y, Kimura K, Saito S, Yamaguchi T, Daida H, Matsuzaki M JAPAN-ACS Investigators. Effect of intensive statin therapy on regression of coronary atherosclerosis in patients with acute coronary syndrome: a multicenter randomized trial evaluated by volumetric intravascular ultrasound using pitavastatin versus atorvastatin (JAPAN-ACS [Japan assessment of pitavastatin and atorvastatin in acute coronary syndrome] study) J Am Coll Cardiol. 2009;54:293–302. doi: 10.1016/j.jacc.2009.04.033. [DOI] [PubMed] [Google Scholar]
- 16.Yokote K, Saito Y. Influence of statins on glucose tolerance in patients with type 2 diabetes mellitus: subanalysis of the collaborative study on hypercholesterolemia drug intervention and their benefits for atherosclerosis prevention (CHIBA study) J Atheroscler Thromb. 2009;16:297–298. doi: 10.5551/jat.e1008. [DOI] [PubMed] [Google Scholar]
- 17.Adams SP, Tsang M, Wright JM. Lipid-lowering efficacy of atorvastatin. Cochrane Database Syst Rev. 2015:CD008226. doi: 10.1002/14651858.CD008226.pub3. [DOI] [PMC free article] [PubMed] [Google Scholar]
- 18.Nakata M, Nagasaka S, Kusaka I, Matsuoka H, Ishibashi S, Yada T. Effects of statins on the adipocyte maturation and expression of glucose transporter 4 (SLC2A4): implications in glycaemic control. Diabetologia. 2006;49:1881–1892. doi: 10.1007/s00125-006-0269-5. [DOI] [PubMed] [Google Scholar]
- 19.Boon J, Hoy AJ, Stark R, Brown RD, Meex RC, Henstridge DC, Schenk S, Meikle PJ, Horowitz JF, Kingwell BA, Bruce CR, Watt MJ. Ceramides contained in LDL are elevated in type 2 diabetes and promote inflammation and skeletal muscle insulin resistance. Diabetes. 2013;62:401–410. doi: 10.2337/db12-0686. [DOI] [PMC free article] [PubMed] [Google Scholar]
- 20.Park ZH, Juska A, Dyakov D, Patel RV. Statin-associated incident diabetes: a literature review. Consult Pharm. 2014;29:317–334. doi: 10.4140/TCP.n.2014.317. [DOI] [PubMed] [Google Scholar]
- 21.Yamasaki T, Iwashima Y, Jesmin S, Ohta Y, Kusunoki H, Hayashi S, Horio T, Kawano Y. Comparison of efficacy of intensive versus mild pitavastatin therapy on lipid and inflammation biomarkers in hypertensive patients with dyslipidemia. PLoS One. 2014;9:e89057. doi: 10.1371/journal.pone.0089057. [DOI] [PMC free article] [PubMed] [Google Scholar]