Abstract
Context:
Histopathological characterization of colorectal polyps is critical for determining the risk of colorectal cancer and future rates of surveillance for patients. However, this characterization is a challenging task and suffers from significant inter- and intra-observer variability.
Aims:
We built an automatic image analysis method that can accurately classify different types of colorectal polyps on whole-slide images to help pathologists with this characterization and diagnosis.
Setting and Design:
Our method is based on deep-learning techniques, which rely on numerous levels of abstraction for data representation and have shown state-of-the-art results for various image analysis tasks.
Subjects and Methods:
Our method covers five common types of polyps (i.e., hyperplastic, sessile serrated, traditional serrated, tubular, and tubulovillous/villous) that are included in the US Multisociety Task Force guidelines for colorectal cancer risk assessment and surveillance. We developed multiple deep-learning approaches by leveraging a dataset of 2074 crop images, which were annotated by multiple domain expert pathologists as reference standards.
Statistical Analysis:
We evaluated our method on an independent test set of 239 whole-slide images and measured standard machine-learning evaluation metrics of accuracy, precision, recall, and F1 score and their 95% confidence intervals.
Results:
Our evaluation shows that our method with residual network architecture achieves the best performance for classification of colorectal polyps on whole-slide images (overall accuracy: 93.0%, 95% confidence interval: 89.0%–95.9%).
Conclusions:
Our method can reduce the cognitive burden on pathologists and improve their efficacy in histopathological characterization of colorectal polyps and in subsequent risk assessment and follow-up recommendations.
Keywords: Colorectal polyps, deep learning, digital pathology, histopathological characterization
INTRODUCTION
Although colorectal polyps are precursors to colorectal cancer, it takes several years for these polyps to potentially transform into cancer.[1] If colorectal polyps are detected early, they can be removed before this transformation occurs. Currently, the most common screening test for colorectal polyps is colonoscopy.[2] In 2012, the US Multisociety Task Force on Colorectal Cancer issued updated guidelines on colorectal cancer surveillance after colonoscopy screening – a key principle of which is risk assessment and follow-up recommendations based on histopathological characterization of the polyps detected in the baseline colonoscopy. Therefore, detection and histopathological characterization of colorectal polyps are an important part of colorectal cancer screening, through which high-risk colorectal polyps are distinguished from low-risk polyps. The risk of developing subsequent polyps and colorectal cancer and the timing of follow-up colonoscopies depend on this characterization;[2] however, accurate characterization of certain polyp types can be challenging, and there is a large degree of variability for how pathologists characterize and diagnose these polyps. As an example, sessile serrated polyps can potentially develop more aggressively into colorectal cancer as compared to other colorectal polyps, because of the serrated pathway in tumorigenesis.[3] The serrated pathway is associated with mutations in the BRAF or KRAS oncogenes, and CpG island methylation, which can lead to the silencing of mismatch repair genes (e.g., MLH1) and a more rapid progression to malignancy.[4] Therefore, differentiating sessile serrated polyps from other types of polyps is critical for an appropriate surveillance.[5] Histopathological characterization is the only reliable existing method for diagnosing sessile serrated polyps because other screening methods designed to detect premalignant lesions (such as fecal blood, fecal DNA, or virtual colonoscopy) are not well suited for differentiating sessile serrated polyps from other polyps.[6] However, differentiation between sessile serrated polyps and innocuous hyperplastic polyps is a challenging task for pathologists.[4,7,8,9] This is because sessile serrated polyps, such as hyperplastic polyps, often lack the dysplastic nuclear changes that characterize conventional adenomatous polyps, and their histopathological diagnosis is entirely based on morphological features, such as serration, dilatation, and branching. Accurate diagnosis of sessile serrated polyps and their differentiation from hyperplastic polyps is needed to ensure that patients receive appropriate and frequent follow-up surveillance and to prevent patients from being over-screened. However, in a recent colorectal cancer study, more than 7000 patients underwent colonoscopy in 32 centers – ultimately, a sessile serrated polyp was not diagnosed in multiple centers despite the statistical unlikeliness of this outcome.[10] This indicates that there are still considerable gaps in the performance and education of pathologists regarding the identification of histologic features of colorectal polyps and their diagnostic accuracy.[11]
In the past years, computational methods have been developed to assist pathologists in the analysis of microscopic images.[12,13,14] These image analysis methods primarily focus on basic structural segmentation (e.g., nuclear segmentation)[15,16,17] and feature extraction (e.g., orientation, shape, and texture).[18,19,20,21] In some methods, these extracted or hand-constructed features are used as an input to a standard machine-learning classification framework, such as a support vector machine[22,23] or a random forest,[24] for automated tissue classification and disease grading.
In the field of artificial intelligence, deep-learning computational models, which are composed of multiple processing layers, can learn numerous levels of abstraction for data representation.[25] These data abstractions have dramatically improved the state-of-the-art computer vision and visual object recognition applications, and in some cases, even exceed human performance.[26] Currently, deep-learning models are successfully utilized in autonomous mobile robots and self-driving cars.[27,28] The construction of deep-learning models only recently became practical due to large amounts of training data becoming available through the World Wide Web, public data repositories, and new high-performance computational capabilities that are mostly due to the new generation of graphics processing units (GPUs) needed to optimize these models.[25]
Recent work has proven the deep-learning approach to be superior for tasks of classification and segmentation on histology whole-slide images, as compared to the previous image processing techniques.[29,30,31] As examples, deep-learning models have been developed to detect metastatic breast cancer,[32] to find mitotically active cells,[33] to identify basal cell carcinoma,[34] and to grade brain gliomas[35] using hematoxylin and eosin (H&E)-stained images. Particularly, Sirinukunwattana et al.[36] presented a deep-learning approach for nucleus detection and classification on H&E-stained images of colorectal cancer. This model was based on a standard 8-layer convolutional network[37] to identify the centers of nuclei and classify them into four categories of epithelial, inflammatory, fibroblastic, and miscellaneous. Janowczyk and Madabhushi released a survey of the applications of deep learning in pathology, exploring domains such as lymphocyte detection, mitosis detection, invasive ductal carcinoma detection, and lymphoma classification.[31] All models in the survey used the convolutional neural network proposed by Krizhevsky et al.[38]
With the recent expansion in the use of whole-slide digital scanners, high-throughput tissue banks, and archiving of digitized histological studies, the field of digital pathology is ripe for the development and application of computational models to assist pathologists in the histopathological analysis of microscopic images, disease diagnosis, and management of patients. Considering these recent advancements in computerized image analysis, and the critical need for computational tools to help pathologists with histopathological characterization and diagnosis of colorectal polyps for more efficient and accurate colorectal cancer screening, we propose a novel deep-learning-based approach for this task.
SUBJECTS AND METHODS
The whole-slide images required to develop and evaluate our method were collected from patients who underwent colorectal cancer screening at our academic quaternary care center. Our domain expert pathologist collaborators annotated different types of colorectal polyps in these images. We used these annotations as reference standards for training and testing our deep-learning methods for colorectal polyp classification on whole-slide images.
Dataset
The data required for developing and evaluating the proposed approach in this project were collected from patients who underwent colorectal cancer screening since January 2010 at our academic medical center. The Department of Pathology and Laboratory Medicine at our medical center has instituted routine whole-slide scanning for slide archiving, employing three high-throughput Leica Aperio whole-slide scanners. These slides are digitized at ×200 magnification. There are 697 H&E-stained whole-slide images in our dataset. In this study, 458 whole-slide images are used as the training set (about 2/3 of the dataset), and 239 whole-slide images were used as the test set (about 1/3 of the dataset). There are no overlaps between whole-slide images and each of these slides belongs to a different patient/colonoscopy procedure. Our histology imaging dataset includes H&E-stained, whole-slide images for five types of colorectal polyps: hyperplastic polyp, sessile serrated polyp, traditional serrated adenoma, tubular adenoma, and tubulovillous/villous adenoma. These five classes cover the most common occurrences of colorectal polyps and encompass all polyp types that are included in the US Multisociety Task Force guidelines for colorectal cancer risk assessment and surveillance.[2] In addition, the dataset that was used to train and evaluate our deep-learning model does include normal samples, which do not contain colorectal polyps. Figure 1 shows sample H&E-stained images from all colorectal polyp types that were collected in this project.
Figure 1.
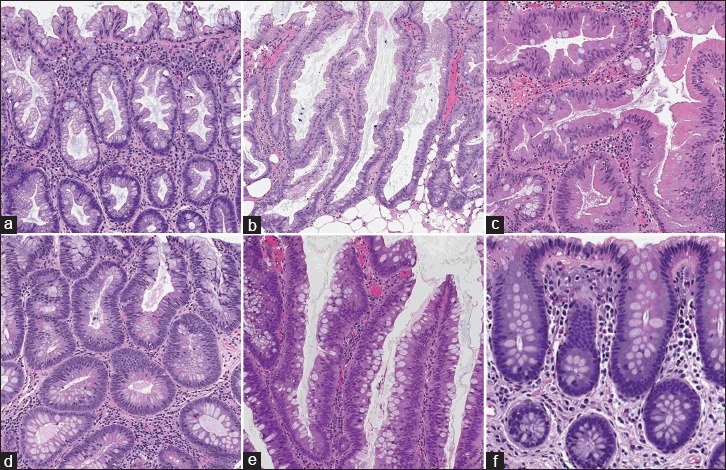
Samples with different colorectal polyps: (a) hyperplastic, (b) sessile serrated, (c) traditional serrated, (d) tubular, (e) tubulovillous/villous, and (f) normal, (H&E)
For this project, 2074 crop images were collected through this collaboration with the Department of Pathology and Laboratory Medicine at our medical center. Size of the crops varies due to the fact that they were generated as the regions of interest around the polyps (mean: 811 × 984 pixels, standard deviation: 118.86 × 148.89 pixels, median 972 × 1094 pixels). The number of crop images collected from each colorectal polyp type is presented in Table 1. We used 90% of the collected images in this dataset for model training and evaluated the performance of our method on the remaining 10% of samples that were used as the validation set. We made sure that if multiple crops were generated from the same whole-slide image, they were all placed in a same set (either all in the training or in validation sets). In addition to the training and validation sets, additional 239 independent whole-slide images were collected after the training for final evaluation. The use of these data for this project is approved by our Institutional Review Board.
Table 1.
Our dataset: The distribution of colorectal polyp types in crop images used in this work
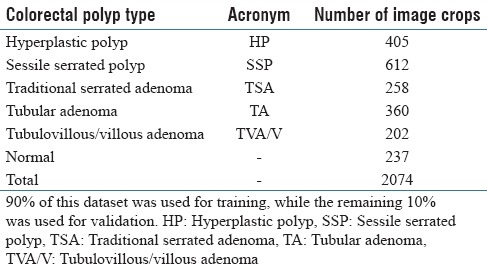
Image annotation
High-resolution histology images for colorectal polyp samples are large. Most of the slides encompass normal tissue, and only a small part of a whole-slide image is actually related to the colorectal polyp. In this study, two collaborators, resident pathologists from the Department of Pathology and Laboratory Medicine at our medical center, independently reviewed the whole-slide images in our training and test data sets to identify the type of colorectal polyps in images, as reference standards. In addition, to train a classification model on colorectal polyp features in these slides, and as a preprocessing step, one of the pathologists outlined the regions in which the colorectal polyp was present and generated smaller crops focused on colorectal polyps. Extracting smaller crops at the same magnification level for training deep-learning classifiers has shown superior performance in previous histopathology analysis applications.[39] A second, highly experienced pathologist also reviewed the whole-slide images and their associated, extracted crops. The disagreements in classifying and cropping the images were resolved through further discussions between the annotator pathologists and through consultation with a third, senior gastrointestinal pathologist collaborator. To ensure the accuracy of these manual annotations and resulting image crops, when an agreement could not be reached on a polyp type or cropping for an image, that image was discarded and replaced by a new image.
Training architecture and framework
Deep learning is strongly rooted in previously existing artificial neural networks[25] although the construction of deep-learning models only recently became practical due to the availability of large amounts of training data and new high-performance GPU computational capabilities designed to optimize these models.[25] In 2012, Krizhevsky et al. developed a deep-learning model[38] based on convolutional neural networks (ConvNets)[37] that significantly improved the image classification results and reduced the error rate about 10%, as compared to the performance of the best nondeep-learning methods in computer vision at the time. Since then, various deep-learning methods have been developed and have improved the performance of Krizhevsky's model even further.
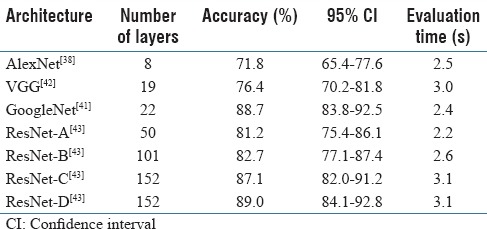
While it has been shown that an increase in depth would yield superior results,[40] the state-of-the-art deep-learning models were unable to take advantage of this increase beyond 50 layers.[40,41] This was because of a fundamental problem with propagating gradients to optimize networks with a large number of layers, which is commonly known as the vanishing gradient problem.[42,43] Therein, beyond a moderate number of layers, the models experience performance degradation according to the degree of increase in the number of layers in the previous architectures. In 2015, Microsoft introduced residual network architecture (ResNet), which addressed the vanishing gradient problem. On its introduction, ResNet outperformed previous architectures by significant margins in all main tracks of the ImageNet computer vision competition, including object detection, classification, and localization,[43] and allowed for up to 152 layers before experiencing performance degradation. To empirically support our choice of architecture, we conducted an ablation study on top performing deep-learning network architectures,[44] such as AlexNet,[38] VGG,[40] GoogleNet,[41] and different variations of ResNet.[43] Results of this comparison can be found in Table 2 and the results section.
Table 2.
Architecture ablation test: Results of ablation test on raw image crops (without data augmentation) over 50 epochs for selecting the best network architecture
For our approach, we have adopted a modified version of a residual network architecture as this approach yielded state-of-the-art performance in both image recognition benchmarks, ImageNet,[44] and COCO,[45] as well as in image segmentation benchmarks, COCO-segmentation.[45] We implemented ResNet, following the original implementation,[43] as a standard neural network consisting of 3 × 3 and 1 × 1 convolution filters and mappings or shortcuts that bypass several convolutional layers. Inputs from these additional mappings were then added with the output of the previous layer to form a residual input to the next layer, such as in Figure 2. Introduction of these shortcuts almost eliminated the vanishing gradient problem; this, in turn, allowed for greater depth of the neural networks, while keeping the computational complexity at a manageable level (due to the relatively small convolutional filters). In addition to the identity mappings, we experimented with projection shortcuts (done by 1 × 1 convolution) when dimensions of the shortcuts did not match the dimensions of the preceding layer to achieve the best performance in our study.[43]
Figure 2.
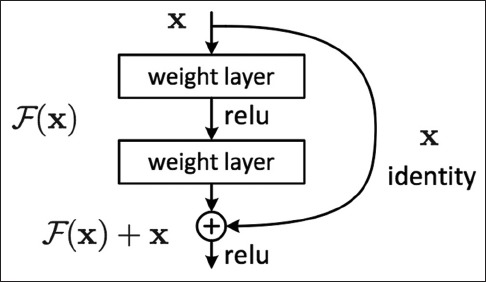
Residual block: The mechanism of a sample residual block in the ResNet architecture[43]
Training
To verify our choice of network architecture in this work, we further separated 10% of the training data as the hold-out validation set to run an ablation study on various deep-learning network architectures. After finding the optimal architecture on this validation set, training was repeated on the entire augmented training set. Finally, we evaluated the trained model on our test set.
Our deep-learning classification model is trained for detecting colorectal polyps in small patches of H&E-stained, whole-slide images. Each crop is processed as follows.
Due to the different sizes of the annotated crops, we zero-padded/rescaled the input images to conform to the median of the dimensions along X and Y axes, computed on a random subset of crop images (median crop size = 972 × 1094 pixels). This random subset was confined to 10% of our training set for computational efficiency. This median (i.e., midpoint) size maintains a consistent level of magnification and quality for training corps. This step is critical due to the design of the deep-learning framework, where each layer's input size is fixed. As a result, the whole network relies on fixed-size input images at the data layer. Therefore, if the input image dimensions were larger than the median, we performed zero-padding, and if the dimensions were smaller than the median, through rescaling, we confirmed the input image to this fixed size. While this rescaling could slightly affect a crop magnification (on average, about 15% of the original size, based on the distribution of crop sizes); however, as our results show, we found this has minimal effect on the performance of our model.
We also normalized each image by subtracting image mean and dividing by standard deviation, to neutralize color differences caused by inconsistent staining of the slides. We also performed color jittering data augmentation on these images. Finally, we rotated each image by 90° to enforce rotational invariance and flipped a randomly-selected 50% of the images along the horizontal axis.
We trained the optimal model for 200 epochs on the augmented training set, with an initial learning rate of 0.1, decreasing it 0.1 times each 50 epochs, and 0.9 momentum. Overall training time for different network architectures took 36 h on a single NVIDIA K40c GPU. Figure 3 shows the value of the cross entropy loss function on the training and validation sets for training a ResNet model with 152 layers and the corresponding generalization error. As can be seen in this figure, the model converges early in the training process near the 50th epoch.
Figure 3.
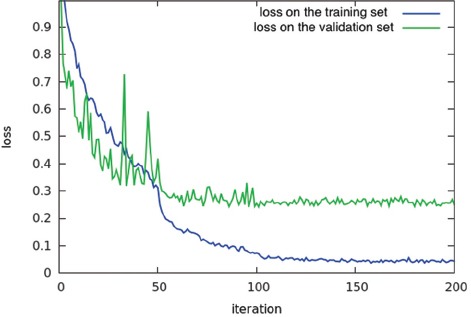
Model training: Training loss per iteration for 152 layer ResNet model on training and validation sets
Inferencing classes for whole-slide images
As mentioned in the training section, our deep-learning classification model is trained for detecting colorectal polyps in small patches of H&E-stained, whole-slide images. To identify the colorectal polyps and their types on whole-slide images using our deep-learning model, we break the whole-slide images into smaller, overlapping patches and apply the model on these patches. Figure 4 shows the overview of our approach for whole-slide image classification. In this work, we use overlapping patches to enforce one-third (i.e., 33%) overlap and cover the full image. To extract coherent patches with image crops used for training, the size of these patches is fixed at the median size of a random 10% subset of the image crops from our training set. Our system infers the type of colorectal polyp on the whole-slide image based on the most common colorectal polyp class among the associated patches for a whole-slide image. In addition, to reduce the noise and increase the confidence of our results, we only associated a class to a whole-slide image if at least a minimum of 5 patches were identified as that class, with 70% average confidence. If there is no support for any of the colorectal polyp types among the patches, the whole-slide image is classified as normal.
Figure 4.
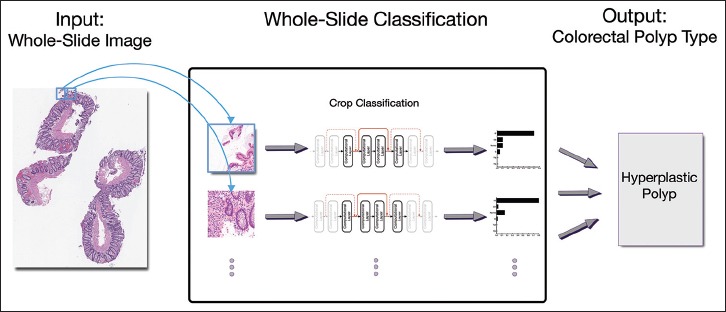
Whole-slide image classification: Overview of our approach for classification of colorectal polyps on whole-slide, (H&E)
Evaluation
At training time, we evaluated our models using a validation set of images cropped as described above. Based on these results, we could evaluate the per-crop accuracy to understand and address potential pitfalls and interclass confusion. For the evaluation of the final model, we applied our proposed inference mechanism on whole-slide images in the test set. In this evaluation, we measure the standard machine-learning evaluation metrics of accuracy, sensitivity (recall), specificity, positive predictive value (precision), negative predictive value, and F1 score for our method.[46] In addition, we calculate 95% confidence intervals for all of the performance metrics in this evaluation through the Clopper and Pearson method.[47]
RESULTS
The results of our experimentation and evaluation are summarized in Tables 2–5. Table 2 shows the comparison between the performance of different deep-neural-network architectures for classification of colorectal polyps on image crops without any data augmentation. As it can be seen in this table, in addition to using standard network architectures such as AlexNet,[38] VGG,[42] and GoogleNet,[41] we experimented with different variations of ResNet[43] architecture with 50–152 computational layers. Among these variations, ResNet-C and-D both have 152 layers. However, ResNet-C uses identity mappings, while ResNet-D relies on projection mappings in its architecture.
Table 5.
Confusion matrix: Confusion matrix of our final model for classification of colorectal polyps on 239 whole-slide images in our test set
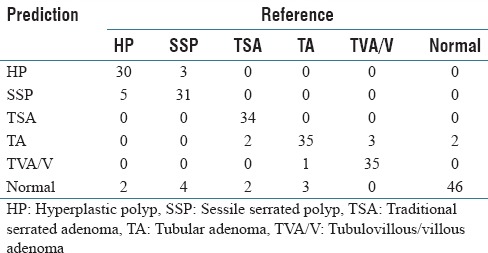
Table 3 shows the results of the best performing deep-neural-network architecture among the tested architectures, ResNet-D, for classification of colorectal polyps on crop images with data augmentation. Table 3 includes the accuracy for each polyp type, in addition to overall accuracy.
Table 3.
Crop classification results: Results of our best model (ResNet-D) for classification of colorectal polyps on cropped images
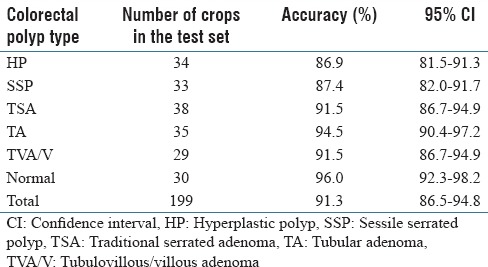
Table 4 shows the performance of our deep-learning-based method, using ResNet-D architecture, for classification of colorectal polyps on whole-slide, H&E-stained images. Table 4 includes the accuracy, precision, recall, and F1 score of our method and their 95% confidence intervals for each type of colorectal polyp. Table 5 shows the confusion matrix for this evaluation on our test set of 239 whole-slide images.
Table 4.
Whole-slide classification results: Results of our final model for classification of colorectal polyps on 239 whole-slide images in our test set

DISCUSSION
In this work, we presented an automated system to facilitate the histopathological characterization of colorectal polyps on H&E-stained, whole-slide images with high sensitivity and specificity. Our evaluation shows that our system can accurately differentiate high-risk polyps from both low-risk colorectal polyps and normal cases by identifying the corresponding colorectal polyp types, such as hyperplastic, sessile serrated, traditional serrated, tubular, and tubulovillous/villous, on H&E-stained, whole-slide images. These polyp types are the focus of major criteria in the US Multisociety Task Force guidelines for colorectal cancer surveillance and cover most colorectal polyp occurrences.[2] This project is inspired in part by the use of image analysis software in Papanicolaou (Pap) smear screening[5] for cervical cancer. In the past years, the automation of Pap smear screening has dramatically improved diagnostic accuracy and screening productivity and helped reduce the incidence of cervical cancer and mortality among American women.[5] Our proposed system can potentially achieve a similar impact on colorectal cancer screening as colorectal cancer is the second leading cause of cancer death among both men and women in the United States,[48] and colorectal polyps are the most common findings during colorectal cancer screening.[2] Of note, we are not aware of any other existing system for automated whole-slide image classification for colorectal polyps.
Our proposed automatic image analysis system can potentially reduce the time needed for colorectal cancer screening analysis, diagnosis, and prognosis; reduce the manual burden on clinicians and pathologists; and significantly reduce the potential errors that could arise from the histopathological characterization of colorectal polyps during subsequent risk assessment and follow-up recommendations. By combining the outcomes of our proposed system with pathologists’ interpretations, this technology will be able to significantly improve the accuracy of diagnoses and prognoses, and therefore advance precision medicine. Along these lines, this project will improve clinical training by providing a platform for improved quality assurance of colorectal cancer screening and deeper understanding of common error patterns in the histopathological characterization of colorectal polyps. In the clinical setting, the implementation of our approach will enhance the accuracy of colorectal cancer screening, reduce the cognitive burden on pathologists, positively impact patient health outcomes, and reduce colorectal cancer mortality by fostering early preventive measures. Improvement in the efficiency of colorectal cancer screening will result in a reduction in screening costs, an increase in the coverage of screening programs, and an overall improvement in public health.
This project leverages ResNet architecture,[43] a new deep-learning paradigm, to address the vanishing gradient problem that arises in training deep-learning models. This network architecture enables the development of ultra-deep models with superior accuracy for characterization of histology images in comparison to existing approaches. Our ablation test results confirm [Table 2] the superiority of the ResNet deep-neural-network architecture with 152 layers and projection mappings for our classification task in comparison to other common network architectures such as AlexNet,[38] VGG,[42] and GoogleNet.[41] Although this best-performing ResNet model has significantly more layers than other network architectures in this comparison, its evaluation time (3.1 s) is close to the other models in a practical range. This small evaluation time difference is due to relatively simple computational layers in the ResNet architecture. Our ablation test was performed on image crops without any data augmentation. Table 3 shows the performance of the best-performing ResNet model on a dataset with augmentation. As can be seen in this table, data augmentation had a positive impact on the results and increased the overall accuracy of our classification to 91.3%, which is higher than the original 89.0% presented in Table 2.
We evaluated our ResNet-based, whole-slide inference model for colorectal polyp classification on 239 independent whole-slide, H&E-stained images. These results are presented in Tables 4 and 5. As we can see in these tables, our whole-slide inferencing approach demonstrates a strong performance across different classes, with an overall accuracy of 93.0%, an overall precision of 89.7%, an overall recall of 88.3%, and an overall F1 score of 88.8%. As can be seen in the presented confusion matrix [Table 5], in this evaluation, we observed a tendency to classify low-confidence examples as normal. This may be due to the diversity of whole-slide images that are considered to be normal in our training set. Furthermore, we can see that differentiation between hyperplastic polyps and sessile serrated polyps is another major source of errors for our model, which is aligned with the experience of gastrointestinal pathologists in this task.[4,8,9]
Although our proposed histopathology characterization system is based on strong deep-learning methodology and achieved a strong performance in our evaluation on the test set collected at our organization, we still plan to take additional steps to improve our evaluation and results. One possible improvement could be a further increase in the number of layers in our network architecture, which requires collecting a larger training set. To this end, through a collaboration with our state's colonoscopy registry, we are planning to apply and evaluate the proposed method on an additional dataset from patients across our state for the external validation of our approach.
One shortcoming of our system for histopathological characterization, and deep-learning models in general, is the black box approach to the outcomes. These image analysis methods are mostly focused on the efficacy of the final results and rarely provide sufficient evidence and details on factors that contribute to their outcomes. As future work, we aim to leverage visualization methods for deep-learning models to tackle this problem. These visualization methods will provide insight about influential regions and features of a whole-slide image that contribute to the histopathological characterization results. This work will help pathologists verify the characterization results of our method and understand the underlying reasoning for a specific classification.
Our proposed method to characterize colorectal polyps on whole-slide images can be extended to other histopathology analyses and prognosis assessment problems outside of colorectal cancer screening. The proposed method for whole-slide, H&E-stained histopathology analysis builds an illustrative showcase for colorectal cancer screening. As future work, we plan to build training sets for other challenging histopathology characterization problems and extend the developed deep-learning image analysis framework to histopathology image analysis and assessment in other types of cancer, such as melanoma, glioma/glioblastoma, and breast carcinoma. Finally, we plan to conduct a clinical trial to validate the efficacy of our system in clinical practice, to pave the road for the integration of the proposed method into the current colorectal cancer screening workflow.
CONCLUSIONS
In this paper, we presented an image analysis system to assist pathologists in the characterization of colorectal polyps on H&E-stained, whole-slide images. This system was based on state-of-the-art, deep-neural-network architecture to identify the types of colorectal polyps on whole-slide, H&E-stained images. We evaluated our developed system on 239 H&E-stained, whole-slide images for detection of five colorectal polyp classes outlined by the US Multisociety Task Force guidelines for colorectal cancer risk assessment and surveillance. Our results (accuracy: 93.0%; precision: 89.7%; recall: 88.3%; F1 score: 88.8%) show the efficacy of our approach for this task. The technology that was developed and tested in this work has a great potential to be highly impactful by serving as a low-burden, efficient, and accurate diagnosis and assessment tool for colorectal polyps. Therefore, the outcomes of this project can potentially increase the coverage and accuracy of colorectal cancer screening programs and overall reduce colorectal cancer mortality.
Financial support and sponsorship
The study was supported by Dartmouth College Neukom Institute for Computational Science.
Conflicts of interest
There are no conflicts of interest.
Acknowledgment
This research was supported in part by a research grant from Dartmouth College Neukom Institute for Computational Science. We wish to thank Haris Baig and Du Tran from the Visual Learning Group at Dartmouth College for helpful discussions. We would also like to thank Lamar Moss for his helpful feedback on the manuscript.
Footnotes
Available FREE in open access from: http://www.jpathinformatics.org/text.asp?2017/8/1/30/211597
REFERENCES
- 1.Wong NA, Hunt LP, Novelli MR, Shepherd NA, Warren BF. Observer agreement in the diagnosis of serrated polyps of the large bowel. Histopathology. 2009;55:63–6. doi: 10.1111/j.1365-2559.2009.03329.x. [DOI] [PubMed] [Google Scholar]
- 2.Lieberman DA, Rex DK, Winawer SJ, Giardiello FM, Johnson DA, Levin TR. United States Multi-Society Task Force on Colorectal Cancer. Guidelines for colonoscopy surveillance after screening and polypectomy: A consensus update by the US Multi. Society Task Force on Colorectal Cancer. Gastroenterology. 2012;143:844–57. doi: 10.1053/j.gastro.2012.06.001. [DOI] [PubMed] [Google Scholar]
- 3.Leggett B, Whitehall V. Role of the serrated pathway in colorectal cancer pathogenesis. Gastroenterology. 2010;138:2088–100. doi: 10.1053/j.gastro.2009.12.066. [DOI] [PubMed] [Google Scholar]
- 4.Vu HT, Lopez R, Bennett A, Burke CA. Individuals with sessile serrated polyps express an aggressive colorectal phenotype. Dis Colon Rectum. 2011;54:1216–23. doi: 10.1097/DCR.0b013e318228f8a9. [DOI] [PubMed] [Google Scholar]
- 5.Biscotti CV, Dawson AE, Dziura B, Galup L, Darragh T, Rahemtulla A, et al. Assisted primary screening using the automated ThinPrep Imaging System. Am J Clin Pathol. 2005;123:281–7. [PubMed] [Google Scholar]
- 6.Kahi CJ. How does the serrated polyp pathway alter CRC screening and surveillance? Dig Dis Sci. 2015;60:773–80. doi: 10.1007/s10620-014-3449-z. [DOI] [PubMed] [Google Scholar]
- 7.Aptoula E, Courty N, Lefevre S. Mitosis Detection in Breast Cancer Histological Images with Mathematical Morphology. 2013, 21st Signal Processing and Communications Applications Conference (SIU), IEEE. 2013:1–4. [Google Scholar]
- 8.Irshad H, Veillard A, Roux L, Racoceanu D. Methods for nuclei detection, segmentation, and classification in digital histopathology: A review-current status and future potential. IEEE Rev Biomed Eng. 2014;7:97–114. doi: 10.1109/RBME.2013.2295804. [DOI] [PubMed] [Google Scholar]
- 9.Veta M, van Diest PJ, Willems SM, Wang H, Madabhushi A, Cruz-Roa A, et al. Assessment of algorithms for mitosis detection in breast cancer histopathology images. Med Image Anal. 2015;20:237–48. doi: 10.1016/j.media.2014.11.010. [DOI] [PubMed] [Google Scholar]
- 10.Snover DC. Update on the serrated pathway to colorectal carcinoma. Hum Pathol. 2011;42:1–10. doi: 10.1016/j.humpath.2010.06.002. [DOI] [PubMed] [Google Scholar]
- 11.Abdeljawad K, Vemulapalli KC, Kahi CJ, Cummings OW, Snover DC, Rex DK. Sessile serrated polyp prevalence determined by a colonoscopist with a high lesion detection rate and an experienced pathologist. Gastrointest Endosc. 2015;81:517–24. doi: 10.1016/j.gie.2014.04.064. [DOI] [PubMed] [Google Scholar]
- 12.Gurcan MN, Boucheron LE, Can A, Madabhushi A, Rajpoot NM, Yener B. Histopathological image analysis: A review. IEEE Rev Biomed Eng. 2009;2:147–71. doi: 10.1109/RBME.2009.2034865. [DOI] [PMC free article] [PubMed] [Google Scholar]
- 13.Madabhushi A, Lee G. Image analysis and machine learning in digital pathology: Challenges and opportunities. Med Image Anal. 2016;33:170–5. doi: 10.1016/j.media.2016.06.037. [DOI] [PMC free article] [PubMed] [Google Scholar]
- 14.Naik S, Doyle S, Feldman M, Tomaszewski J, Madabhushi A. Gland Segmentation and Computerized Gleason Grading of Prostate Histology by Integrating Low., High-level and Domain Specific Information. MIAAB Workshop. Citeseer. 2007:1–8. [Google Scholar]
- 15.Nakhleh RE. Error reduction in surgical pathology. Arch Pathol Lab Med. 2006;130:630–2. doi: 10.5858/2006-130-630-ERISP. [DOI] [PubMed] [Google Scholar]
- 16.Raab SS, Grzybicki DM, Janosky JE, Zarbo RJ, Meier FA, Jensen C, et al. Clinical impact and frequency of anatomic pathology errors in cancer diagnoses. Cancer. 2005;104:2205–13. doi: 10.1002/cncr.21431. [DOI] [PubMed] [Google Scholar]
- 17.Malkin HM. History of pathology: Comparison of the use of the microscope in pathology in Germany and the United States during the nineteenth century. Ann Diagn Pathol. 1998;2:79–91. doi: 10.1016/s1092-9134(98)80036-1. [DOI] [PubMed] [Google Scholar]
- 18.Gil J, Wu H, Wang BY. Image analysis and morphometry in the diagnosis of breast cancer. Microsc Res Tech. 2002;59:109–18. doi: 10.1002/jemt.10182. [DOI] [PubMed] [Google Scholar]
- 19.Boucheron LE. Object-and spatial-level quantitative analysis of multispectral histopathology images for detection and characterization of cancer. Ph.D. Thesis, University of California, Santa Barbara. 2008 [Google Scholar]
- 20.Sertel O, Kong J, Catalyurek UV, Lozanski G, Saltz JH, Gurcan MN. Histopathological image analysis using model-based intermediate representations and color texture: Follicular lymphoma grading. J Signal Process Syst. 2009;55:169–83. [Google Scholar]
- 21.Doyle S, Hwang M, Shah K, Madabhushi A, Feldman M, Tomaszeweski J. Automated Grading of Prostate Cancer Using Architectural and Textural Image Features. 2007 4th IEEE International Symposium on Biomedical Imaging: From Nano to Macro. IEEE. 2007:1284–7. [Google Scholar]
- 22.Rajpoot K, Rajpoot N. International Conference on Medical Image Computing and Computer-Assisted Intervention. Springer; 2004. SVM Optimization for Hyperspectral Colon Tissue Cell Classification; pp. 829–37. [Google Scholar]
- 23.Kallenbach-Thieltges A, Großerüschkamp F, Mosig A, Diem M, Tannapfel A, Gerwert K. Immunohistochemistry, histopathology and infrared spectral histopathology of colon cancer tissue sections. J Biophotonics. 2013;6:88–100. doi: 10.1002/jbio.201200132. [DOI] [PubMed] [Google Scholar]
- 24.Sims AJ, Bennett MK, Murray A. Image analysis can be used to detect spatial changes in the histopathology of pancreatic tumours. Phys Med Biol. 2003;48:N183–91. doi: 10.1088/0031-9155/48/13/401. [DOI] [PubMed] [Google Scholar]
- 25.LeCun Y, Bengio Y, Hinton G. Deep learning. Nature. 2015;521:436–44. doi: 10.1038/nature14539. [DOI] [PubMed] [Google Scholar]
- 26.He K, Zhang X, Ren S, Sun J. Delving deep into rectifiers: Surpassing human-level performance on ImageNet classification. Proceedings of the IEEE International Conference on Computer Vision. 2015:1026–34. [Google Scholar]
- 27.Farabet C, Couprie C, Najman L, LeCun Y. Scene Parsing with Multiscale Feature Learning, Purity Trees, and Optimal Covers. arXiv Preprint arXiv: 12022160. 2012 [Google Scholar]
- 28.Hadsell R, Sermanet P, Ben J, Erkan A, Scoffier M, Kavukcuoglu K, et al. Learning long-range vision for autonomous off-road driving. J Field Robot. 2009;26:120–44. [Google Scholar]
- 29.Xie Y, Kong X, Xing F, Liu F, Su H, Yang L. Learning long-range vision for autonomous off-road driving. J. Field Robot. 2009;26:120–44. [Google Scholar]
- 30.Sirinukunwattana K, Ahmed Raza SE, Yee-Wah Tsang, Snead DR, Cree IA, Rajpoot NM. Locality sensitive deep learning for detection and classification of nuclei in routine colon cancer histology images. IEEE Trans Med Imaging. 2016;35:1196–206. doi: 10.1109/TMI.2016.2525803. [DOI] [PubMed] [Google Scholar]
- 31.Janowczyk A, Madabhushi A. Deep learning for digital pathology image analysis: A comprehensive tutorial with selected use cases. J Pathol Inform. 2016;7:29. doi: 10.4103/2153-3539.186902. [DOI] [PMC free article] [PubMed] [Google Scholar]
- 32.Cruz-Roa AA, Ovalle JE, Madabhushi A, Osorio FA. In: International Conference on Medical Image Computing and Computer-Assisted Intervention. Springer; 2013. A Deep Learning Architecture for Image Representation, Visual Interpretability and Automated Basal-cell Carcinoma Cancer Detection; pp. 403–10. [DOI] [PubMed] [Google Scholar]
- 33.Ertosun MG, Rubin DL. AMIA Annual Symposium Proceedings. Vol. 2015. American Medical Informatics Association; 2015. Automated Grading of Gliomas Using Deep Learning in Digital Pathology Images: A Modular Approach with Ensemble of Convolutional Neural Networks; p. 1899. [PMC free article] [PubMed] [Google Scholar]
- 34.Malon CD, Cosatto E. Classification of mitotic figures with convolutional neural networks and seeded blob features. J Pathol Inform. 2013;4:9. doi: 10.4103/2153-3539.112694. [DOI] [PMC free article] [PubMed] [Google Scholar]
- 35.Wang H, Cruz-Roa A, Basavanhally A, Gilmore H, Shih N, Feldman M, et al. Cascaded Ensemble of Convolutional Neural Networks and Handcrafted Features for Mitosis Detection. In: SPIE Medical Imaging. International Society for Optics and Photonics. 2014:90410. [Google Scholar]
- 36.Sirinukunwattana K, Snead DR, Rajpoot NM. A stochastic polygons model for glandular structures in colon histology images. IEEE Trans Med Imaging. 2015;34:2366–78. doi: 10.1109/TMI.2015.2433900. [DOI] [PubMed] [Google Scholar]
- 37.Le Cun BB, Denker JS, Henderson D, Howard RE, Hubbard W, Jackel LD. Handwritten Digit Recognition with a Back-propagation Network. Advances in Neural Information Processing Systems. Citeseer. 1990 [Google Scholar]
- 38.Krizhevsky A, Sutskever I, Hinton GE. Imagenet Classification with Deep Convolutional Neural Networks. Advances in Neural Information Processing Systems. 2012:1097–105. [Google Scholar]
- 39.Bengio Y. Learning Deep Architectures for AI. Vol. 2. Hanover, MA, USA: Now Publishers Inc; 2009. Foundations and trends in machine learning; pp. 1–127. [Google Scholar]
- 40.Simonyan K, Zisserman A. Very Deep Convolutional Networks for Large.scale Image Recognition. CoRR. 2014. Available from: http://www.arxiv.org/abs/1409.1556 .
- 41.Szegedy C, Liu W, Jia Y, Sermanet P, Reed S, Anguelov D, et al. Going Deeper with Convolutions. Proceedings of the IEEE Conference on Computer Vision and Pattern Recognition. 2015:1–9. [Google Scholar]
- 42.Simonyan K, Vedaldi A, Zisserman A. Deep inside Convolutional Networks: Visualising Image Classification Models and Saliency Maps. arXiv Preprint arXiv: 13126034. 2013 [Google Scholar]
- 43.He K, Zhang X, Ren S, Sun J. Deep residual learning for image recognition. Proceedings of the IEEE Conference on Computer Vision and Pattern Recognition. 2016:770–778. [Google Scholar]
- 44.Russakovsky O, Deng J, Su H, Krause J, Satheesh S, Ma S, et al. Imagenet large scale visual recognition challenge. Int J Comput Vis. 2015;115:211–52. [Google Scholar]
- 45.Lin TY, Maire M, Belongie S, Hays J, Perona P, Ramanan D, et al. In European Conference on Computer Vision. Springer International Publishing; 2014. Microsoft coco: Common objects in context; pp. 740–55. [Google Scholar]
- 46.Powers DM. Evaluation: From precision, recall and f-measure to roc, informedness, markedness and correlation. Int J Machine Learn Technol. 2011;2:37–63. [Google Scholar]
- 47.Clopper CJ, Pearson ES. The use of confidence or fiducial limits illustrated in the case of the binomial. Biometrika. 1934;26:404–13. [Google Scholar]
- 48.Cancer Facts and Figures. Atlanta: American Cancer Society, 2016; 2016. Society AC, American Cancer Society. [Google Scholar]


