

Abstract
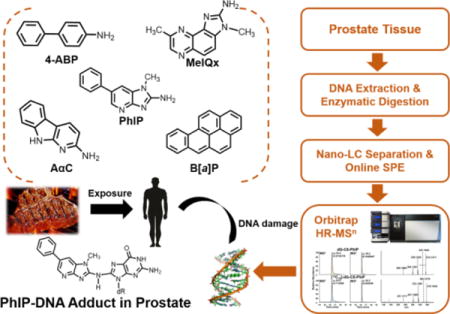
Epidemiologic studies have reported an association between frequent consumption of well-done cooked meats and prostate cancer risk. However, unambiguous physiochemical markers of DNA damage from carcinogens derived from cooked meats, such as DNA adducts, have not been identified in human samples to support this paradigm. We have developed a highly sensitive nano-LC-Orbitrap MSn method to measure DNA adducts of several carcinogens originating from well-done cooked meats, tobacco smoke and environmental pollution including: 2-amino-1-methyl-6-phenylimidazo[4,5-b]pyridine (PhIP), 2-amino-9H-pyrido[2,3-b]indole (AαC), 2-amino-3,8-dimethylimidazo[4,5-f]quinoxaline (MeIQx), benzo[a]pyrene (B[a]P) and 4-aminobiphenyl (4-ABP). The limit of quantification (LOQ) of the major deoxyguanosine (dG) adducts of these carcinogens ranged between 1.3 – 2.2 adducts per 109 nucleotides per 2.5 μg DNA assayed. The DNA adduct of PhIP, N-(deoxyguanosin-8-yl)-PhIP (dG-C8-PhIP) was identified in 11 out of 35 patients, at levels ranging from 2 to 120 adducts per 109 nucleotides. The dG-C8 adducts of AαC, MeIQx, and the B[a]P adduct, 10-(deoxyguanosin-N2-yl)-7,8,9-trihydroxy-7,8,9,10-tetrahydrobenzo[a]pyrene (dG-N2-B[a]PDE) were not detected in any specimen, whereas N-(deoxyguanosin-8-yl)-4-ABP (dG-C8-4-ABP) was identified in one subject (30 adducts per 109 nucleotides). PhIP DNA adducts also were recovered quantitatively from formalin fixed paraffin embedded (FFPE) tissues, signifying FFPE tissues can serve as biospecimens for carcinogen DNA adduct biomarker research. Our biomarker data provide support to the epidemiological observations implicating PhIP, one of the most mass-abundant heterocyclic aromatic amines formed in well-done cooked meats, as a DNA damaging agent that may contribute to the etiology of prostate cancer.
TOC image
INTRODUCTION
Prostate cancer is the most frequently diagnosed malignancy and second leading cause of cancer-related deaths among men in the United States.1 In 2015, the Working Group of the International Agency for Research on Cancer (IARC) classified the consumption of red meat as probably carcinogenic to humans (Group 2A) with an increased risk to colorectal cancer.2,3 This classification was based on a compilation of epidemiology data and strong mechanistic evidence from animal and human studies. The frequent consumption of cooked red meat was also positively associated with an elevated risk of prostate and pancreatic cancers.3
The cooking of meats can produce carcinogen polycyclic aromatic hydrocarbons (PAH) and heterocyclic aromatic amines (HAA). More than a dozen PAH can form in some cooked meats, particularly when meat is exposed to flame and charred.4,5 Benzo[a]pyrene (B[a]P) is a prototypical PAH formed in charred meats and it is also present in tobacco smoke, and an environmental pollutant.6 B[a]P is a recognized human carcinogen (Group 1).6 Over twenty genotoxic HAA are formed in well-done cooked meats at concentrations ranging from <1 up to 500 parts-per-billion.7 The amounts of HAA formed are dependent upon the type of meat and method of cooking.8 2-Amino-1-methyl-6-phenylimidazo[4,5-b]pyridine (PhIP) is the most mass-abundant carcinogenic HAA formed during the high-temperature cooking of meats.8 PhIP is a rodent prostate carcinogen9 and classified as a possible human carcinogen (Group 2B, IARC).10 PhIP forms DNA adducts and induces oxidative stress, atrophy of the acini and inflammation of the prostate in rodent models.9,11–13 These are also features in the pathology of human prostate cancer.14 A paradigm has been put forth for a causal role of consumption of well-done cooked meats containing PAH and HAA in the etiology of prostate cancer. However, a critical missing link to support this paradigm is specific biomarkers of DNA damage of carcinogens derived from cooked meat.2,3,15 DNA adducts are a measure of internal exposure to chemicals, which can lead to mutations, and considered important biomarkers for the human risk assessment.16,17
The measurement of DNA adducts in human biospecimens is challenging because the amount of tissue available for assay is usually very small and DNA adduct formation generally occurs at ultra-low levels (~1 adduct per 107 to 1010 nucleotides).18 32P-postlabeling and immunohistochemistry (IHC) methods have been widely used for DNA adduct detection in human biospecimens.19,20 For example, supposed DNA adducts of PhIP, 4-ABP and B[a]P were measured by 32P-postlabeling in exfoliated breast epithelial cells in milk of lactating mothers. Thirty samples contained detectable levels of PhIP adducts, with a mean value of 4.7 adducts/107 nucleotides; 18 were positive for ABP adducts with a mean value of 4.7 adducts/107 nucleotides; and 13 contained B[a]P adducts with a mean level of 1.9 adducts/107 nucleotides.21 In IHC studies, PhIP-DNA adducts were detected in 82% of mammary samples of breast cancer patients and 71% of tissue samples of healthy control patients, at levels that exceeded several adducts per 107 nucleotides.22 Similarly, frequent and high levels of PhIP- and B[a]P-DNA adducts were reported in human prostate specimens, when assayed by IHC.23–25 The estimated levels of PhIP adducts were comparable to those levels reported in tissues of rodents given a single acute or chronic doses of PhIP, which exceed human dietary levels by a million-fold or more.26,27
The occurrence of putative PhIP-DNA adducts in human tissues at such high levels is alarming, and if confirmed, PhIP would be recognized as a major dietary DNA-damaging agent. However, the proof of identity of PhIP-DNA adducts and other DNA adducts by IHC and 32P-postlabeling methods is equivocal. An important drawback of IHC is that the specificity of the antibodies, including monoclonal antibodies, for DNA adducts is uncertain as they may cross-react with other DNA lesions or endogenous components, leading to errors in identification and quantification. The uncertainty in labeling efficiency and the lack of physiochemical structural confirmation puts DNA adduct analysis by 32P-postlabeling methods into question.28,29
There is a critical need to establish specific methods to identify and quantify DNA adducts for human cancer risk assessment. Liquid chromatography-mass spectrometry (LC-MS) has emerged as the most promising technique to assay a variety of DNA adducts with a level of sensitivity that can be superior to that of 32P-postlabeling or IHC methods for certain DNA adducts.29–31 In this study, we developed a highly sensitive and selective nano-LC-high resolution MSn method to identify and quantitate DNA adducts formed in prostate specimens of human cancer patients. We have measured DNA adducts of several carcinogens formed in cooked meats or present in the environment including: AαC, MeIQx,7 4-ABP,33 and B[a]P33 (Figure 1). The primary DNA adducts of HAA and 4-ABP are formed at the C8 position of deoxyguanosine (dG).15,34 B[a]P undergoes bioactivation to form a diol-epoxide, which reacts with the N2 position of dG to give 10-(deoxyguanosin-N2-yl)-7,8,9-trihydroxy-7,8,9,10-tetrahydrobenzo[a]pyrene (B[a]PDE) as the major adduct.35
Figure 1.
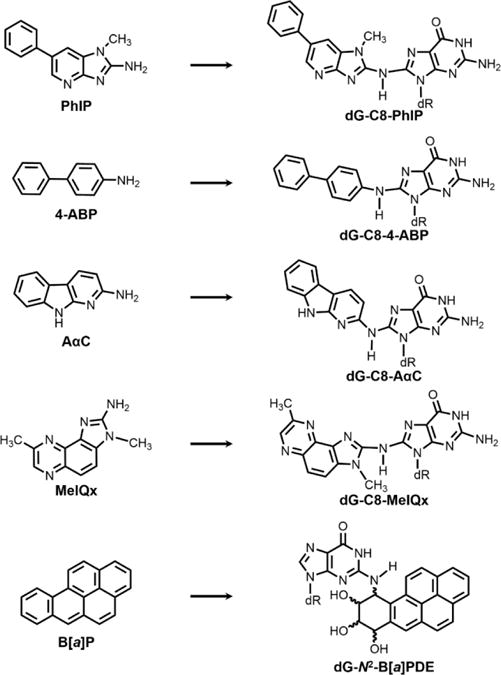
Structures of carcinogens and their major DNA adducts. (dR = deoxyribose).
We report the occurrence of dG-C8-PhIP in biopsy tissues of 11 out of 35 human prostate cancer patients. In contrast, DNA adducts of the other carcinogens investigated were not detected, except for one subject who was positive for dG-C8-4-ABP, a carcinogen present in tobacco smoke and an environmental pollutant.33 In addition, we show that our recently established method of DNA adduct retrieval from formalin-fixed paraffin-embedded (FFPE) tissue blocks29,36 can be used to measure dG-C8-PhIP in FFPE prostate tissue.
EXPERIMENTAL SECTION
Safety Considerations
PhIP, 4-ABP, AαC, MeIQx and B[a]P are known or potential human carcinogens and should be handled with caution in a well-ventilated fume hood with the appropriate personal protective equipment. Human tissue specimens were processed in a biohazard hood, and all unused tissue material was treated with bleach prior to discarding the material in biohazard waste receptacles.
Materials
Calf thymus (CT) DNA, RNase A (bovine pancreas), RNase T1 (Aspergillus oryzae), Proteinase K (Tritirachium album), DNase I (type IV, bovine pancreas), alkaline phosphatase (Escherichia coli), nuclease P1 (Penicillium citrinum) were purchased from Sigma-Aldrich (St. Louis, MO). Phosphodiesterase I (Crotalus adamanteus venom) was purchased from Worthington Biochemical Corp. (Newark, NJ). Maxwell 16 FFPE Plus LEV DNA purification kit was purchased from Promega Co. (Madison, WI). Unlabeled and stable isotopically labeled internal standards of [13C10]-dG-C8-PhIP, [13C10]-dG-C8-4-ABP, [13C10]-dG-C8-AαC, [2H3C]-dG-C8-MeIQx and [13C10]-dG-N2-B[a]PDE were synthesized as described.37,38
Human Prostate Tissue Collection and Treatment
The research protocol was reviewed and approved by the Institutional Review Board at University of Minnesota. Cases recruited for study were sent a letter introducing the study protocol, followed by a phone call from a study interviewer. The study population consisted of men from Minnesota, Wisconsin, South Dakota, North Dakota, and Iowa, who were diagnosed with prostate cancer and scheduled to undergo radical prostatectomy (mean age: 64.2 ± 8.5). A food frequency questionnaire was provided to obtain information about eating habits. All subjects were omnivores and ate cooked red meat at least seven times per week. Full details on the demographics of the subjects, dietary and life-style habits, and prostate pathology will be reported elsewhere. The identities of all patients were rendered anonymous.
H&E-stained slides of tissue specimens were reviewed by the study pathologist (P. Murugan) to confirm samples assayed for DNA adducts were largely tumor-free. Normal tumor-adjacent prostate tissues (peripheral and transition zones) were snap-frozen in liquid nitrogen and stored at −80 °C. Matching FFPE samples were fixed in 10% neutral buffered formalin for 24 h at room temperature, then tissues underwent serial dehydration with ethanol, followed by p-xylene, and embedded in paraffin by a Sakura Tissue Tech VIP 2000 (Torrance, CA) following the previously reported protocol.39
Extraction and Enzymatic Digestion of Prostate DNA
Fresh frozen prostate tissues were thawed on ice and homogenized in 4 mL of 50 mM Tris EDTA buffer containing 10 mM β-mercaptoethanol (pH 8.0) using a blade homogenizer (Pro Scientific, Oxford, CT). The homogenates were centrifuged at 3,000 g for 10 min at 4°C and DNA was isolated from the pellet by the phenol/chloroform extraction method (Protocol S-1 in Supporting Information).
The procedure of DNA isolation from FFPE samples is described in Supporting Information (Protocol S-2). The rehydrated tissues were homogenized by the same method used for fresh frozen tissues. DNA was extracted per the manufacturer’s instructions for the Maxwell 16 FFPE Plus LEV DNA purification kit. DNA concentration was determined using an Agilent 8453 UV/Vis spectrophotometer (Agilent Technologies, Santa Clara, CA), assuming that 50 μg/mL of double-stranded DNA gives an absorbance of 1.0 at 260 nm.
DNA (20 μg) containing isotopically labeled internal standards ([13C10]-dG-C8-PhIP, [13C10]-dG-C8-4-ABP, [13C10]-dG-C8-AαC, [2H3C]-dG-C8-MeIQx and [13C10]-dG-N2-B[a]PDE each at a level of 3 adducts per 108 nucleotides) was digested with a cocktail of enzymes (Protocol S-3 in Supporting Information). Samples were concentrated to dryness by vacuum centrifugation, reconstituted in 50% DMSO:H2O (1:1, 30 μL), centrifuged at 21,000 g for 10 min, and the supernatant was carefully retrieved for LC-MS analysis.
Nano LC-Orbitrap-MSn Analysis of DNA Adducts
A Dionex UltiMate 3000 RSLCnano UHPLC System interfaced with a Nanospray Flex ion source, and an Orbitrap Fusion Tribrid MS (Thermo Fisher Scientific, San Jose, CA) were used for the analysis of DNA adducts. A NanoAcquity 10K 2G V/V UPLC Symmetry C18 trap column (180 μm × 20 mm, 5 μm particle size, Waters Corp., Milford, MA) was employed for online trapping of DNA adducts. DNA digests (3–8 μg DNA) were injected into the trap column and washed with mobile phase A for 4 min at a flow rate of 12 μL/min before back-flushing the analytes onto the analytical column. At 20 min, the trap column was switched off-line and washed at 50 μL/min with 100% mobile phase B in order to avoid potential carryover effects. A self-packed Luna C18 column (5 μm particle size, Phenomenex Corp., Torrance, CA) prepared with a PicoTip emitter (75 μm × 200 mm, 10 μm tip ID, New Objective Inc., Woburn, MA) was used for LC separation with the following conditions: mobile phase A, 0.05% formic acid in water; mobile phase B, 0.05% formic acid-95% acetonitrile-5% water; isocratic run starting at 1% B was kept for 4 min at a flow rate of 0.6 μL/min, followed by linear gradient starting at 1% B and arriving at 99% B in 19.5 min at the flow rate of 0.3 μL/min, then the column was washed at 99% B for 4 min and equilibrated at 1% B for 5.5 min at the flow rate of 0.6 μL/min.
Xcalibur version 3.0.63 software was used for data acquisition and analysis. The adduct analysis was performed in positive ion mode at the MS2 scan stage with high-energy collision-induced dissociation (HCD). The MS was calibrated externally with Pierce™ LTQ ESI Positive Ion Calibration Solution (Thermo Scientific, San Jose, CA). Other MS parameters were as follows: spray voltage, 2200 V; ion transfer tube temperature, 300 °C; quadrupole isolation, 1 m/z; Orbitrap resolution, 60,000 (m/z 200); collision energy (CE), 25%; maximum injection time, 100 ms; AGC target, 5 × 10⁴. Scanning at the MS3 scan stage was done by collision induced dissociation (CID-CID) with the collision energy of 30% at the MS2 stage and 36% at the MS3 stage. Orbitrap resolution was set at 30,000 (m/z 200); isolation mode, quadrupole (isolation window m/z 0.8); maximum injection time, 200 ms; AGC target, 5 × 10⁴.
The targeted MS2 ion transitions were: dG-C8-PhIP (m/z 490.2 → 374.1470), [13C10]-dG-C8-PhIP (m/z 500.2 → 379.1640); dG-C8-4-ABP (m/z 435.2 → 319.1302), [13C10]-dG-C8-4-ABP (m/z 445.2 → 324.1470); dG-C8-AαC (m/z 449.2 → 333.1207), [13C10]-dG-C8-AαC (m/z 459.2 → 338.1375); dG-C8-MeIQx (m/z 479.2 → 363.1425), [2H3C]-dG-C8-MeIQx (m/z 482.2 → 366.1613) and dG-N2-B[a]PDE (m/z 570.2 → 257.0959, 285.0916, 454.1510), [13C10]-dG-N2-B[a]PDE (m/z 580.2 → 257.0959, 285.0916, 459.1678). Oxidized ring-opened PhIP adducts were monitored at the MS2 scan stage with the following transitions: dG-C8-PhIP-Guanidine (m/z 383.2 → 267.1353), dG-C8-PhIP-Spirohydantoin (m/z 506.2 → 390.1422). Quantitation was achieved by extracted ion chromatograms (EICs) of the aglycone ions ([M+H-116.0473]+) of each adduct and their corresponding internal standards ([M+H-121.0641]+) except for [2H3C]-dG-C8-MeIQx ([M+H-116.0473]+). All analytes were assayed within a 5 ppm mass tolerance window.
Method Validation and Calibration Curve
The accuracy and performance of the method was determined with carcinogen-treated CT DNA containing known levels of PhIP, 4-ABP and B[a]P adducts.35,37,40 The intra-day and inter-day accuracy and precision of the assay were determined by analyzing adduct levels in the carcinogen-treated CT DNA on eight different days. In order to assess the matrix effect on adduct measurements, the above mentioned carcinogen-modified CT DNA was spiked into human prostate DNA samples and measured for adduct levels.
The calibration curves were constructed at six levels. Isotope-labeled and unlabeled dG-C8-PhIP, dG-C8-4-ABP, dG-C8-AαC, dG-C8-MeIQx and dG-N2-B[a]PDE were spiked into 20 μg of non-modified CT DNA after digestion with the level of internal standard at 2 adducts per 108 nucleotides. A six points calibration curve was constructed ranging from 0.04 – 3.13 ratio of unlabeled to labeled adducts, corresponding to levels of adducts ranging from 0.8 to 62 adducts per 109 nucleotides. DNA (2.5 μg) digest was injected on to the column and each calibration point was assayed in triplicate (Figure S-1). Data were fitted to a straight line (peak area ratio vs. amount ratio) by ordinary least-squared with equal weighting. Limit of quantification (LOQ) was determined by the slope (S) of the regression and its standard deviation (σ) with the following formula: LOQ = 10σ/S.41
RESULTS AND DISCUSSION
Method Development and Validation
We modified our previously published capillary UPLC-ESI-IT-MSn method to quantify DNA adducts in human prostate samples.36,42,43 To improve the sensitivity of the assay, we performed nanoflow-chromatography with nanospray ionization instead of capillary chromatography. The modified nucleosides were measured by MS/MS employing HCD and the accurate mass measurements of the aglycone ions ([M+H-116.0473]+) were determined with the high resolution Orbitrap instead of the previous low resolution measurements, which were conducted by MS3 stage scanning with the LTQ Velos.36,42,43 The amount of DNA digest injected onto the column was maximized by employing an online micro-SPE trap column, which served to enrich the hydrophobic DNA adducts while removing polar non-modified nucleosides, salts, and other components. The ion suppression effects were modest, with the signals of response of the internal standards in the DNA digest 30 – 50% of those signals obtained with pure standards.
The six points calibration curves of dG-C8-PhIP, dG-C8-4-ABP, dG-C8-AαC, dG-C8-MeIQx and dG-N2-B[a]PDE are shown in Figure S-1. The linearity of the calibration curves is represented by the slope and the goodness-of-fit linear regression values (r2 > 0.998). All calibration curves showed good linearity over a 63-fold range of adduct levels. The method is highly sensitive and the LOQ values (per 109 nucleotides in 2.5 μg DNA) are: 1.3 adducts for dG-C8-PhIP, 2.2 adducts for dG-C8-4-ABP, 1.7 adducts for dG-C8-AαC, 1.6 adducts for dG-C8-MeIQx and 1.5 adducts for dG-N2-B[a]PDE.41
The method was validated by the measurements of known levels of adducts of PhIP,37 4-ABP40 and B[a]P-modified CT DNA35 on eight different days. The method was optimized to measure adducts in human samples with low amounts of DNA (10 – 20 μg), where only two or three independent replicates can be performed. Therefore, the method validation study was conducted with duplicate samples, instead of the typical number of five to ten replicates. The levels of adducts measured were within two-fold of the target values (Table 1). The inter-laboratory estimates of the levels of these DNA adducts are quite comparable,35,37,40 if we consider that the assays employed different sets of internal standards, different enzymes and DNA digestion conditions, and different MS instruments for analysis. For example, the target value of dG-C8-PhIP in tritium labelled-PhIP-modified CT DNA was determined by liquid scintillation counting of dG-C8-[3H]-PhIP, isolated by HPLC after enzymatic digestion of the DNA;37 the target values of dG-C8-4-ABP and dG-N2-B[a]PDE were based upon the levels of adducts determined by triple stage quadrupole tandem mass spectrometry in an independent laboratory.35,40 The overall intra-day and inter-day precisions (CV%) were below 7% for all adducts (Table 1).
Table 1.
Performance of nano-LC high resolution-MS to measure DNA adductsa
| dG-C8-PhIP | ||||||||||
|---|---|---|---|---|---|---|---|---|---|---|
| D1 | D2 | D3 | D4 | D5 | D6 | D7 | D8 | Intra CV% | Inter CV% | |
| Mean | 3.75 | 3.57 | 3.43 | 4.10 | 4.00 | 3.36 | 4.12 | 4.57 | 5.9% | 6.0% |
| SD | 0.23 | 0.25 | 0.16 | 0.44 | 0.21 | 0.06 | 0.28 | 0.23 | ||
| CV% | 6.1% | 6.9% | 4.8% | 10.7% | 5.3% | 1.7% | 6.9% | 5.1% | ||
|
| ||||||||||
| dG-C8-4-ABP | ||||||||||
| D1 | D2 | D3 | D4 | D5 | D6 | D7 | D8 | Intra CV% | Inter CV% | |
| Mean | 1.36 | 1.25 | 1.21 | 1.99 | 1.79 | 1.54 | 1.41 | 1.78 | 5.4% | 5.3% |
| SD | 0.08 | 0.10 | 0.06 | 0.04 | 0.14 | 0.04 | 0.10 | 0.10 | ||
| CV% | 6.0% | 7.6% | 4.9% | 2.0% | 7.9% | 2.3% | 7.0% | 5.6% | ||
|
| ||||||||||
| dG-N2-B[a]PDE | ||||||||||
| D1 | D2 | D3 | D4 | D5 | D6 | D7 | D8 | Intra CV% | Inter CV% | |
| Mean | 4.93 | 3.98 | 3.35 | 4.88 | 4.74 | 4.57 | 4.27 | 4.79 | 6.8% | 6.8% |
| SD | 0.25 | 0.30 | 0.16 | 0.66 | 0.18 | 0.31 | 0.36 | 0.21 | ||
| CV% | 5.0% | 7.5% | 4.7% | 13.6% | 3.8% | 6.7% | 8.5% | 4.4% | ||
Adduct levels are expressed as per 108 nucleotides. D1 to D8 indicate different days. Two independent assays were performed per day. Intra-day and inter-day precision are reported as percent coefficient of variation (CV%). SD, standard deviation. Target level of all three adducts is 3 adducts per 108 nucleotides.
Identification of Carcinogenic DNA Adducts in Human Prostate
dG-C8-PhIP was found in 11 out of 35 human prostate samples, whereas dG-C8-4-ABP was identified in one sample. The mass chromatograms of dG-C8-PhIP and dG-C8-4-ABP at the MS2 and MS3 scan stages, and the product ion spectra of the aglycone adducts at the MS3 scan stage are depicted in Figure 2B and Figure 2C. In contrast, dG-C8-MeIQx, dG-C8-AαC, and dG-N2-B[a]PDE adducts were below the LOQ value in all specimens (Figure 2A).
Figure 2.

EICs at the MS2 scan stage of a human prostate sample targeting dG-C8-AαC, dG-C8-MeIQx, dG-N2-B[a]PDE, dG-C8-PhIP, and dG-C8-4-ABP. (A) Prostate sample that is negative for all DNA adducts. EICs at MS2 and MS3 scan stages and product ion spectra at the MS3 scan stage of human prostate sample that is positive for (B) dG-C8-PhIP and (C) dG-C8-4-ABP. Proposed MS3 fragmentation pathways of each adduct are displayed on the right panel, isotopically labeled 13C atoms of the internal standards are marked in red.
The identities of dG-C8-PhIP and dG-C8-4-ABP in the prostate were confirmed by the MS3 scan stage product ion spectra obtained by CID-CID fragmentation and Orbitrap detection. The major product ions of the aglycone of dG-C8-PhIP at m/z 250.1084, 304.1301, 329.1254, and 357.1203, and (all within 1.5 ppm from the theoretical values) are produced by cleavage of the guanine moiety. The product ion spectrum of [13C10]-dG-C8-PhIP closely matches the spectrum of dG-C8-PhIP with mass shifts attributed to the 13C isotopes. The product ion spectra of dG-C8-4-ABP and [13C10]-dG-C8-4-ABP are also in excellent agreement. The spectra of these adducts are in good agreement to those previously obtained with the LTQ Velos.36,38,42,43 The high resolution MS3 product ion spectra provide unambiguous evidence for the presence of dG-C8-PhIP and dG-C8-4-ABP in human prostate DNA. The EICs and MS3 spectra of the synthetic standards of dG-C8-MeIQx, dG-C8-AαC and dG-N2-B[a]PDE are shown in Figure S-2 of Supporting Information.
CT DNA containing known amounts of dG-C8-PhIP, dG-C8-4-ABP and dG-N2-B[a]PDE were spiked into several human prostate DNA samples that were found to be negative for all adducts and re-measured post-spiking in order to evaluate the prostate DNA matrix effect on adduct measurements. Interfering components can result in mass shifts due to the merging of unresolved ions because of insufficient resolution even at 60,000, resulting in false negatives by high resolution mass accuracy MS instruments.44,45 The results are summarized in Table S-1. By comparing adduct levels of human prostate DNA diluted 1:1 with PhIP-, 4-ABP-, and B[a]P-carcinogen-modified CT DNA to those adduct levels measured from only CT DNA, the range in recovery of the carcinogen DNA adducts in human prostate samples was between 70 – 120%. These findings show that prostate DNA matrix effects are negligible.
Frequency of Detection of dG-C8-PhIP and Adduct Levels in Human Prostate
Comparable levels of dG-C8-PhIP were found in transition and peripheral zones of prostate (Figure 3). This finding is consistent with data of the rat model where dG-C8-PhIP levels in rat ventral (corresponding to human prostate peripheral zone) and dorsal zones (corresponding to human transition zone) were similar, despite the much higher incidence of carcinomas induced by PhIP in the ventral prostate.9 Interestingly, the dG-C8-4-ABP was detected in one prostate sample (Sample P8) at a level of 2.84 ± 0.06 adducts per 108 nucleotides for the peripheral zone and 3.11 ± 0.01 adducts per 108 nucleotides for the transition zone. This subject also harbored the highest dG-C8-PhIP. Surprisingly, this subject is a never-smoker.
Figure 3.
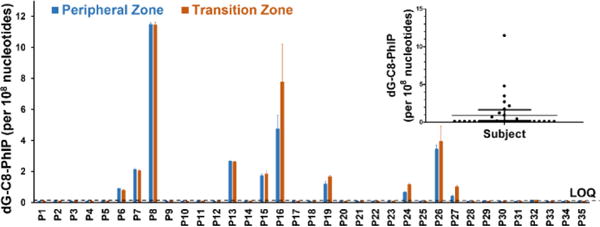
Summary of the frequency and levels of dG-C8-PhIP per 108 nucleotides in human prostate peripheral and transition zones. The LOQ value is 1.3 adducts per 109 nucleotides.
Compared to previously reported IHC data, which showed nearly 100% positivity for dG-C8-PhIP and adduct levels well above 1 adduct per 107 nucleotides in prostate DNA of cancer patients,23,46–48 our data reveal a considerably lower frequency of detection of dG-C8-PhIP (31% frequency) with considerably lower adduct levels than those values estimated by IHC. The levels of dG-PhIP ranged from 2 to 120 adducts per 109 nucleotides, by specific nano-LC-Orbitrap MSn. Similarly, frequent and high levels of dG-N2-B[a]P were detected, by IHC, in human prostate.24,25 Even though our nano-LC-Orbitrap MSn method is 100-fold more sensitive than the IHC assays, we did not detect dG-N2-B[a]P in a single specimen. We believe that the discrepancy in these DNA adduct measurements is attributed to the cross-reactivity of the antibodies with other presumed DNA adducts or endogenous cellular components in the IHC experiments.
The levels of dG-C8-PhIP measured by nano-LC-Orbitrap MSn varied by nearly 60-fold (2 to 120 adducts per 109 nucleotides) among subjects. The PhIP-DNA adducts levels are likely the summation of recent and chronic exposures. The inter-individual differences in adduct levels can be attributed to different amounts of dietary intake of PhIP, since the levels of PhIP formed in cooked meat can vary by 50-fold or more.8 Inter-individual differences in genetic factors such as genetic polymorphisms in enzymes of xenobiotic metabolism that impact bioactivation and/or detoxication of these procarcinogens, and differences in expression of enzymes involved in DNA repair also can influence the levels of DNA adducts. Since the epithelial cells of the prostate have a very low cell turnover rate (>1 year),49 DNA adducts may persist and accumulate. However, dG-C8-PhIP (and other bulky DNA adducts) also may undergo nucleotide excision repair.50 Moreover, we do not know the adduct levels at the time of cancer initiation, which occurred long before clinical diagnosis of prostate cancer. The measurement of dG-C8-PhIP was obtained at a single point in time. Investigations on the variation in dG-C8-PhIP levels and its persistence over time in prostate are warranted.
Ring-Opened PhIP Adducts Are Not Observed in Human Prostate
Inflammation and oxidative stress are thought to strongly contribute to prostate carcinogenesis.14 Arylamine and heteroarylmine dG-C8 adducts are susceptible to oxidation under alkaline pH during sample preparation, resulting in the formation of ring-opened adducts.51–54 Thus, we analyzed for oxidized ring-opened PhIP adducts including guanidine and spirohydantoin derivatives of dG-C8-PhIP in a number of randomly selected human prostate samples. PhIP-treated CT DNA was oxidized with NaOH to generate artificial ring-opened PhIP adducts which served as reference compounds. Neither of the oxidized ring-opened adducts were detected (Protocol S-4 and Figure S-3), suggesting the dG-C8-PhIP is relatively stable to the inflammation/oxidative stress conditions in vivo, and during DNA sample workup ex-vivo.
PhIP DNA Adduct Levels in Fresh Frozen and FFPE Prostate Tissue
The measurement of DNA adducts in humans is often restricted by the availability of fresh frozen tissues. In contrast, FFPE samples are often readily accessible. Our laboratory has reported that DNA adducts of several carcinogens, including aristolochic acid, B[a]P, 4-ABP, and PhIP can be recovered in high yield from FFPE rodent tissues.36,39 In this study, we have compared the PhIP-DNA adduct levels from fresh frozen prostate tissues with paired FFPE tissue blocks from three patients who were positive for dG-C8-PhIP. The FFPE blocks were stored at room temperature for a minimum of five months prior to analysis. DNA extraction and the adduct measurements were performed side-by-side and the results are shown in Figure 4. The levels of dG-C8-PhIP were marginally lower in FFPE specimens compared to the fresh frozen samples, but the differences were not statistically significant (P > 0.05). These results signify that dG-C8-PhIP is stable to the formalin fixation and paraffin embedding procedure and the DNA retrieval process. FFPE tissues can be used as biospecimens for biomonitoring PhIP-DNA and other carcinogen DNA adducts in molecular epidemiology studies designed to assess the causal role of exposure to hazardous chemicals with cancer risk.36,39
Figure 4.
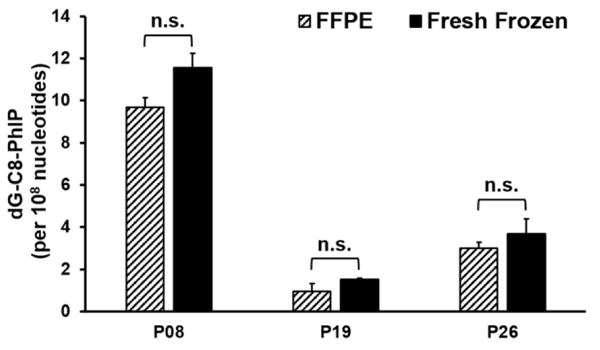
Comparison of dG-C8-PhIP levels (adducts per 108 nucleotides) between fresh frozen and FFPE prostate specimens from patients P08, P19 and P26. Two independent analyses were done per subject; n.s.: statistically not significant (P > 0.05).
CONCLUSIONS
DNA adducts of carcinogens originating from dietary or environmental sources have long been thought to contribute to the initiation of human cancers.17 The data of molecular epidemiologic studies combined with the mechanistic information on chemical carcinogenesis have firmly established causative linkages between exposure to aflatoxin B1 and aristolochic acids in cancer risk, where elevated levels of exposure and unique mutational signatures were used to establish the causative role of these chemicals in human cancer.55,56 There are many other mutagens and potential human carcinogens to which we are exposed to daily at low levels. The question is do any of these chemicals contribute to human cancer risk? One example is PhIP, a mutagen formed in cooked meat8 and a rodent prostate carcinogen.9 Epidemiology studies have linked cooked red meat containing PhIP with prostate cancer risk.2,3 To our knowledge, our study is the first report to identify a DNA adduct of a cooked mutagen in human prostate by a specific LC-MS measurement. A significant percentage of prostate cancer patients harbor dG-C8-PhIP. Further studies are required to determine if PhIP plays a role in the etiology of prostate cancer. Our nano-LC-Orbitrap MSn method can be adapted to biomonitor DNA adducts of a broader range of food-borne and environmentally related carcinogens. With recent improvements in the sensitivity of analytical MS instrumentation and the ability to screen for multiple DNA adducts simultaneously,57 we expect that many adducts will be identified in human tissues by MS instruments in the near future. These biomarker data can help to identify hazardous chemicals in the environment and diet that may be linked to specific types of cancers.
Supplementary Material
Acknowledgments
We thank Dr. Badrinath Konety, MD, Department of Urology, University of Minnesota, for his interest and support of this project. Drew Sciacca, Department of Laboratory Medicine and Pathology, who handled the prostatectomy specimens and dissected appropriate tissue, and Beth Fenske and Carla Heinke, from BioNet Tissue Procurement, for collection of the prostate biospecimens. Dr. Frederick A. Beland from the National Center for Toxicology Research/U.S. FDA kindly provided PhIP, 4-ABP and B[a]P-treated CT DNA.
This work is supported by R01CA122320 (R.J.T.) and R33CA186795 (R.J.T) from the National Cancer Institute of the National Institutes of Health. Mass spectrometry was carried out in the Analytical Biochemistry Shared Resource of the Masonic Cancer Center, University of Minnesota, funded in part by Cancer Center Support Grant CA-077598.
Footnotes
Supporting Information
The Supporting Information is available free of charge on the ACS Publications website.
Protocols describing DNA extraction from fresh frozen and FFPE tissue, DNA digestion by nucleases; preparation and oxidation of PhIP-treated CT DNA; three figures showing calibration curves, EICs and product ion spectra at the MS3 scan stage of dG-C8 adducts of AαC, MeIQx and dG-N2-B[a]PDE, and EICs at the MS2 scan stage of oxidized ring-opened PhIP adducts; a table showing DNA adduct level estimates in human prostate DNA spiked with 4-ABP, B[a]P and PhIP-modified CT DNA.
CONFLICT OF INTEREST DISCLOSURE
The authors declare no competing financial interest.
References
- 1.U.S. Cancer Statistics Working Group. United States Cancer Statistics: 1999-2013 Incidence and Mortality Web-based Report. Atlanta: U.S. Department of Health and Human Services, Centers for Disease Control and Prevention and National Cancer Institute; 2016. [Google Scholar]
- 2.Norat T, Bingham S, Ferrari P, Slimani N, Jenab M, Mazuir M, Overvad K, Olsen A, Tjonneland A, Clavel F, Boutron-Ruault MC, Kesse E, Boeing H, Bergmann MM, Nieters A, Linseisen J, Trichopoulou A, Trichopoulos D, Tountas Y, Berrino F, Palli D, Panico S, Tumino R, Vineis P, Bueno-de-Mesquita HB, Peeters PH, Engeset D, Lund E, Skeie G, Ardanaz E, Gonzalez C, Navarro C, Quiros JR, Sanchez MJ, Berglund G, Mattisson I, Hallmans G, Palmqvist R, Day NE, Khaw KT, Key TJ, San Joaquin M, Hemon B, Saracci R, Kaaks R, Riboli E. J Natl Cancer Inst. 2005;97:906–916. doi: 10.1093/jnci/dji164. [DOI] [PMC free article] [PubMed] [Google Scholar]
- 3.Bouvard V, Loomis D, Guyton KZ, Grosse Y, Ghissassi FE, Benbrahim-Tallaa L, Guha N, Mattock H, Straif K. Lancet Oncol. 2015 doi: 10.1016/S1470-2045(16)30513-7. [DOI] [PubMed] [Google Scholar]
- 4.Phillips D. H. Mutat Res. 1999;443:139–147. doi: 10.1016/s1383-5742(99)00016-2. [DOI] [PubMed] [Google Scholar]
- 5.Mottier P, Parisod V, Turesky RJ. J Agric Food Chem. 2000;48:1160–1166. doi: 10.1021/jf991205y. [DOI] [PubMed] [Google Scholar]
- 6.IARC. IARC Monographs on the Evaluation of Carcinogenic Risks to Humans. Tobacco smoke and involuntary smoking. Vol. 83. International Agency for Research on Cancer; Lyon, France: 2002. [PMC free article] [PubMed] [Google Scholar]
- 7.Sugimura T, Wakabayashi K, Nakagama H, Nagao M. Cancer Sci. 2004;95:290–299. doi: 10.1111/j.1349-7006.2004.tb03205.x. [DOI] [PMC free article] [PubMed] [Google Scholar]
- 8.Felton JS, Jagerstad M, Knize MG, Skog K, Wakabayashi K. In: Food Borne Carcinogens Heterocyclic Amines. Nagao M, Sugimura T, editors. John Wiley & Sons Ltd; Chichester, England: 2000. pp. 31–71. [Google Scholar]
- 9.Shirai T, Sano M, Tamano S, Takahashi S, Hirose M, Futakuchi M, Hasegawa R, Imaida K, Matsumoto KI, Wakabayashi K, Sugimura T, Ito N. Cancer Res. 1997;57:195–198. [PubMed] [Google Scholar]
- 10.International Agency for Research on Cancer. IARC Monographs on the Evaluation of Carcinogenic Risks to Humans. Some naturally occurring substances: food items and constituents, heterocyclic aromatic amines and mycotoxins. Vol. 56. International Agency for Research on Cancer; Lyon, France: 1993. pp. 165–242. 1993. [Google Scholar]
- 11.Borowsky AD, Dingley KH, Ubick E, Turteltaub KW, Cardiff RD, Devere-White R. Neoplasia. 2006;8:708–715. doi: 10.1593/neo.06373. [DOI] [PMC free article] [PubMed] [Google Scholar]
- 12.Nakai Y, Nelson WG, De Marzo AM. Cancer Res. 2007;67:1378–1384. doi: 10.1158/0008-5472.CAN-06-1336. [DOI] [PubMed] [Google Scholar]
- 13.Li G, Wang H, Liu AB, Cheung C, Reuhl KR, Bosland MC, Yang CS. Cancer Prev Res(Phila) 2012;5:963–972. doi: 10.1158/1940-6207.CAPR-12-0023. [DOI] [PMC free article] [PubMed] [Google Scholar]
- 14.Nakai Y, Nonomura N. Int J Urol. 2013;20:150–160. doi: 10.1111/j.1442-2042.2012.03101.x. [DOI] [PubMed] [Google Scholar]
- 15.Turesky RJ, Le Marchand L. Chem Res Toxicol. 2011;24:1169–1214. doi: 10.1021/tx200135s. [DOI] [PMC free article] [PubMed] [Google Scholar]
- 16.Jarabek AM, Pottenger LH, Andrews LS, Casciano D, Embry MR, Kim JH, Preston RJ, Reddy MV, Schoeny R, Shuker D, Skare J, Swenberg J, Williams GM, Zeiger E. Crit Rev Toxicol. 2009;39:659–678. doi: 10.1080/10408440903164155. [DOI] [PubMed] [Google Scholar]
- 17.Loeb LA, Harris CC. Cancer Res. 2008;68:6863–6872. doi: 10.1158/0008-5472.CAN-08-2852. [DOI] [PMC free article] [PubMed] [Google Scholar]
- 18.Phillips DH. Mutat Res. 2005;577:284–292. doi: 10.1016/j.mrfmmm.2005.03.008. [DOI] [PubMed] [Google Scholar]
- 19.Phillips DH. Cancer Lett. 2012;334:5–9. doi: 10.1016/j.canlet.2012.11.027. [DOI] [PubMed] [Google Scholar]
- 20.Poirier MC, Santella RM, Weston A. Carcinogenesis. 2000;21:353–359. doi: 10.1093/carcin/21.3.353. [DOI] [PubMed] [Google Scholar]
- 21.Gorlewska-Roberts K, Green B, Fares M, Ambrosone CB, Kadlubar FF. Environ Mol Mutagen. 2002;39:184–192. doi: 10.1002/em.10060. [DOI] [PubMed] [Google Scholar]
- 22.Zhu J, Chang P, Bondy ML, Sahin AA, Singletary SE, Takahashi S, Shirai T, Li D. Cancer Epidemiol Biomarkers Prev. 2003;12:830–837. [PubMed] [Google Scholar]
- 23.Tang D, Liu JJ, Rundle A, Neslund-Dudas C, Savera AT, Bock CH, Nock NL, Yang JJ, Rybicki BA. Cancer Epidemiol Biomarkers Prev. 2007;16:803–808. doi: 10.1158/1055-9965.EPI-06-0973. [DOI] [PMC free article] [PubMed] [Google Scholar]
- 24.Tang D, Kryvenko ON, Wang Y, Jankowski M, Trudeau S, Rundle A, Rybicki BA. Carcinogenesis. 2013;34:113–120. doi: 10.1093/carcin/bgs326. [DOI] [PMC free article] [PubMed] [Google Scholar]
- 25.Pratt MM, John K, MacLean AB, Afework S, Phillips DH, Poirier MC. Int J Environ Res Public Health. 2011;8:2675–2691. doi: 10.3390/ijerph8072675. [DOI] [PMC free article] [PubMed] [Google Scholar]
- 26.Pfau W, Brockstedt U, Shirai T, Ito N, Marquardt H. Mutat Res. 1997;378:13–22. doi: 10.1016/s0027-5107(97)00093-6. [DOI] [PubMed] [Google Scholar]
- 27.Kaderlik KR, Minchin RF, Mulder GJ, Ilett KF, Daugaard-Jenson M, Teitel CH, Kadlubar FF. Carcinogenesis. 1994;15:1703–1709. doi: 10.1093/carcin/15.8.1703. [DOI] [PubMed] [Google Scholar]
- 28.Phillips DH, Farmer PB, Beland FA, Nath RG, Poirier MC, Reddy MV, Turteltaub KW. Environ Mol Mutagen. 2000;35:222–233. doi: 10.1002/(sici)1098-2280(2000)35:3<222::aid-em9>3.0.co;2-e. [DOI] [PubMed] [Google Scholar]
- 29.Yun BH, Sidorenko V, Rosenquist TA, Dickman KG, Grollman AP, Turesky RJ. Toxicol Res. 2015;4:763–776. doi: 10.1039/C5TX00052A. [DOI] [PMC free article] [PubMed] [Google Scholar]
- 30.Tretyakova N, Goggin M, Sangaraju D, Janis G. Chem Res Toxicol. 2012;25:2007–2035. doi: 10.1021/tx3002548. [DOI] [PMC free article] [PubMed] [Google Scholar]
- 31.Liu S, Wang Y. Chem Soc Rev. 2015 [Google Scholar]
- 32.Yoshida D, Matsumoto T. Cancer Letters. 1980;10:141–149. doi: 10.1016/0304-3835(80)90037-3. [DOI] [PubMed] [Google Scholar]
- 33.International Agency for Research on Cancer. IARC Monographs on the Evaluation of Carcinogenic Risks to Humans (2012). Personal habits and indoor combustions. 100E. Lyon; France: 2012. [PMC free article] [PubMed] [Google Scholar]
- 34.Beland FA, Beranek DT, Dooley KL, Heflich RH, Kadlubar FF. Environ Health Perspect. 1983;49:125–134. doi: 10.1289/ehp.8349125. [DOI] [PMC free article] [PubMed] [Google Scholar]
- 35.Beland FA, Churchwell MI, Von Tungeln LS, Chen S, Fu PP, Culp SJ, Schoket B, Gyorffy E, Minarovits J, Poirier MC, Bowman ED, Weston A, Doerge DR. Chem Res Toxicol. 2005;18:1306–1315. doi: 10.1021/tx050068y. [DOI] [PubMed] [Google Scholar]
- 36.Guo J, Yun BH, Upadhyaya P, Yao L, Krishnamachari S, Rosenquist TA, Grollman AP, Turesky RJ. Anal Chem. 2016;88:4780–4787. doi: 10.1021/acs.analchem.6b00124. [DOI] [PMC free article] [PubMed] [Google Scholar]
- 37.Lin D, Kaderlik KR, Turesky RJ, Miller DW, Lay JO, Jr, Kadlubar FF. Chem Res Toxicol. 1992;5:691–697. doi: 10.1021/tx00029a016. [DOI] [PubMed] [Google Scholar]
- 38.Bessette EE, Goodenough AK, Langouet S, Yasa I, Kozekov ID, Spivack SD, Turesky RJ. Anal Chem. 2009;81:809–819. doi: 10.1021/ac802096p. [DOI] [PMC free article] [PubMed] [Google Scholar]
- 39.Yun BH, Rosenquist TA, Nikolic J, Dragicevic D, Tomic K, Jelakovic B, Dickman KG, Grollman AP, Turesky RJ. Anal Chem. 2013;85:4251–4258. doi: 10.1021/ac400612x. [DOI] [PMC free article] [PubMed] [Google Scholar]
- 40.Beland FA, Doerge DR, Churchwell MI, Poirier MC, Schoket B, Marques MM. Chem Res Toxicol. 1999;12:68–77. doi: 10.1021/tx980172y. [DOI] [PubMed] [Google Scholar]
- 41.http://www.fda.gov/downloads/Drugs/GuidanceComplianceRegulatoryInformation/Guid-nces/UCM070107.pdf
- 42.Bessette EE, Spivack SD, Goodenough AK, Wang T, Pinto S, Kadlubar FF, Turesky RJ. Chem Res Toxicol. 2010;23:1234–1244. doi: 10.1021/tx100098f. [DOI] [PMC free article] [PubMed] [Google Scholar]
- 43.Goodenough AK, Schut HA, Turesky RJ. Chem Res Toxicol. 2007;20:263–276. doi: 10.1021/tx0601713. [DOI] [PMC free article] [PubMed] [Google Scholar]
- 44.Glauser G, Grund B, Gassner AL, Menin L, Henry H, Bromirski M, Schutz F, McMullen J, Rochat B. Anal Chem. 2016;88:3264–3271. doi: 10.1021/acs.analchem.5b04689. [DOI] [PubMed] [Google Scholar]
- 45.Kellmann M, Muenster H, Zomer P, Mol H. J Am Soc Mass Spectrom. 2009;20:1464–1476. doi: 10.1016/j.jasms.2009.03.002. [DOI] [PubMed] [Google Scholar]
- 46.Tang D, Liu JJ, Bock CH, Neslund-Dudas C, Rundle A, Savera AT, Yang JJ, Nock NL, Rybicki BA. Int J Cancer. 2007;121:1319–1324. doi: 10.1002/ijc.22806. [DOI] [PMC free article] [PubMed] [Google Scholar]
- 47.Tang D, Kryvenko ON, Wang Y, Trudeau S, Rundle A, Takahashi S, Shirai T, Rybicki BA. Int J Cancer. 2013 doi: 10.1002/ijc.28092. [DOI] [PMC free article] [PubMed] [Google Scholar]
- 48.Takahashi S, Tamano S, Hirose M, Kimoto N, Ikeda Y, Sakakibara M, Tada M, Kadlubar FF, Ito N, Shirai T. Cancer Res. 1998;58:4307–4313. [PubMed] [Google Scholar]
- 49.Berges RR, Vukanovic J, Epstein JI, CarMichel M, Cisek L, Johnson DE, Veltri RW, Walsh PC, Isaacs JT. Clin Cancer Res. 1995;1:473–480. [PMC free article] [PubMed] [Google Scholar]
- 50.Reeves DA, Mu H, Kropachev K, Cai Y, Ding S, Kolbanovskiy A, Kolbanovskiy M, Chen Y, Krzeminski J, Amin S, Patel DJ, Broyde S, Geacintov NE. Nucleic Acids Res. 2011;39:8752–8764. doi: 10.1093/nar/gkr537. [DOI] [PMC free article] [PubMed] [Google Scholar]
- 51.Shibutani S, Gentles RG, Iden CR, Johnson F. J Am Chem Soc. 1990;112:5667–5668. [Google Scholar]
- 52.Stover JS, Ciobanu M, Cliffel DE, Rizzo CJ. J Am Chem Soc. 2007;129:2074–2081. doi: 10.1021/ja066404u. [DOI] [PMC free article] [PubMed] [Google Scholar]
- 53.Rindgen D, Turesky RJ, Vouros P. Chem Res Toxicol. 1995;8:1005–1013. doi: 10.1021/tx00050a003. [DOI] [PubMed] [Google Scholar]
- 54.Tang Y, Kassie F, Qian X, Ansha B, Turesky RJ. Toxicol Sci. 2013;133:248–258. doi: 10.1093/toxsci/kft077. [DOI] [PMC free article] [PubMed] [Google Scholar]
- 55.Hussain SP, Harris CC. Mutat Res. 2000;462:311–322. doi: 10.1016/s1383-5742(00)00015-6. [DOI] [PubMed] [Google Scholar]
- 56.Grollman AP. Environ Mol Mutagen. 2013;54:1–7. doi: 10.1002/em.21756. [DOI] [PubMed] [Google Scholar]
- 57.Balbo S, Turesky RJ, Villalta PW. Chem Res Toxicol. 2014;27:356–366. doi: 10.1021/tx4004352. [DOI] [PMC free article] [PubMed] [Google Scholar]
Associated Data
This section collects any data citations, data availability statements, or supplementary materials included in this article.