Abstract
The zinc finger E-box-binding transcription factor Zeb1 plays a pivotal role in the epithelial-mesenchymal transition. Numerous studies have focused on the molecular mechanisms by which Zeb1 contributes to this process. However, the functions of Zeb1 beyond the epithelial-mesenchymal transition remain largely elusive. Using a transdifferentiation system to convert mouse embryonic fibroblasts (MEFs) into functional neurons via the neuronal transcription factors achaete-scute family bHLH (basic helix-loop-helix) transcription factor1 (Ascl1), POU class 3 homeobox 2 (POU3F2/Brn2), and neurogenin 2 (Neurog2, Ngn2) (ABN), we found that Zeb1 was up-regulated during the early stages of transdifferentiation. Knocking down Zeb1 dramatically attenuated the transdifferentiation efficiency, whereas Zeb1 overexpression obviously increased the efficiency of transdifferentiation from MEFs to neurons. Interestingly, Zeb1 improved the transdifferentiation efficiency induced by even a single transcription factor (e.g. Asc1 or Ngn2). Zeb1 also rapidly promoted the maturation of induced neuron cells to functional neurons and improved the formation of neuronal patterns and electrophysiological characteristics. Induced neuron cells could form functional synapse in vivo after transplantation. Genome-wide RNA arrays showed that Zeb1 overexpression up-regulated the expression of neuron-specific genes and down-regulated the expression of epithelial-specific genes during conversion. Taken together, our results reveal a new role for Zeb1 in the transdifferentiation of MEFs into neurons.
Keywords: cell biology, cell therapy, fibroblasts, neurons, reprogramming, transcription factor, Zeb1, transdifferentiation
Introduction
The direct conversion of mouse embryonic fibroblasts (MEFs)4 into functional neurons (induced neurons, or iN cells) by Wernig and colleagues (1) through the forced expression of the transcription factors achaete-scute family bHLH (basic helix-loop-helix) transcription factor1 (Ascl1), POU class 3 homeobox 2 (POU3F2/Brn2), and myelin transcription factor 1 like (Myt1l) (ABM) was truly groundbreaking. These authors then systematized their research through a series of studies in which they directly converted human non-neural somatic cells (fetal and postnatal fibroblasts) and pluripotent stem cells into iN cells using the same three factors (2), induced human embryonic stem cells (ESCs) and induced pluripotent stem cells (iPSCs) into functional neurons by the forced expression of a single transcription factor (Ngn2 or Neuronal differentiation 1 (NeuroD1)) (3), demonstrated the hierarchical mechanism of the three transcription factors, and highlighted Ascl1 as the single most important driver of reprogramming versus Brn2 and Myt1l, which primarily enhanced neuronal maturation (4, 5). Furthermore, this group found that Ascl1 alone was sufficient to generate iN cells from mouse and human fibroblasts and from ESCs (6). A set of elegant studies from other laboratories also demonstrated that various combinations of transcription factors converted human fibroblasts into iNs (hiNs) or even specific neuronal subtypes, such as dopamine (hiDAs) and motor neurons (hiMNs) (2, 7–10). Together with customized transcription factors, microRNAs, small molecules, or even gene editing can be used to transdifferentiate MEFs into neurons (11–17). However, these studies largely utilized integrating delivery systems, such as retroviral or lentiviral vectors, which carried a high risk of introducing insertion mutations and activating tumor-related genes (18). Thus, we developed a non-integrating adenoviral delivery system and succeeded in converting fibroblasts into neurons by expressing a mixture of transcription factors (Ascl1, Brn2, and Ngn2-ABN) (18, 19). This non-integrating system reduces the risk of insertion mutations and tumors, thereby providing new strategies for cell therapy for degenerative diseases and holding great promise for regenerative medicine. However, the efficiency of this approach is low, suggesting that additional transcription factors are needed to increase the conversion efficiency.
The ZEB (zinc finger E-box-binding-homeobox) family of transcription factors consists of two members, Zeb1 (zinc finger E-box-binding homeobox 1) and Zeb2 (also called Smad interacting protein 1 (SIP1)), both of which play pivotal roles in vertebrate embryonic development (20). As a well known activator of the epithelial-mesenchymal transition (EMT), Zeb1 has been extensively studied as a transcriptional repressor that negatively regulated the expression of the polarity marker E-cadherin (14, 21–23). Extensive studies have shown that Zeb1 is also involved in cancer progression, facilitating tumor invasion and metastasis by driving the EMT (23–28). Furthermore, Zeb1 has been implicated in the development of placental blood vessels, the palate, teeth and adipose tissue, and the DNA damage response (29–33). Homozygous Zeb1 knock-out (KO) mice have a cleft lip and palate, as well as aberrant proliferation and differentiation in chondroid tissues, and die within 24 h after birth (31). Interestingly, despite being a non-neuronal transcription factor, Zeb1 plays important roles in the nervous system during ontogenesis. For example, Zeb1 is up-regulated in developing neurons in various parts of the central nervous system and is critical for the maintenance of spinal cord neural stem cells (34, 35). Therefore, determining whether Zeb1 functions during the conversion of fibroblasts into functional neurons is of great interest.
In this study, we used a non-integrating adenoviral delivery system expressing a combination of transcription factors (ABN) (18, 19) to establish a transdifferentiation system for converting MEFs into functional neurons. Knocking down Zeb1 in this system significantly decreased the transdifferentiation efficiency from fibroblasts to neurons, whereas Zeb1 overexpression obviously increased the conversion efficiency, improved neuronal pattern formation, and enhanced the physiological functions of the iN cells. Furthermore, Zeb1 overexpression increased the efficiency of transdifferentiation even in combination with individual Ascl1/Ngn2. Genome-wide RNA array analyses showed that Zeb1 overexpression up-regulated the transcript levels of neuron-specific genes. Our findings provided the first evidence of a role for Zeb1 in the production of iN cells via transdifferentiation.
Results
Zeb1 was strongly up-regulated at early stages of ABN-mediated transdifferentiation
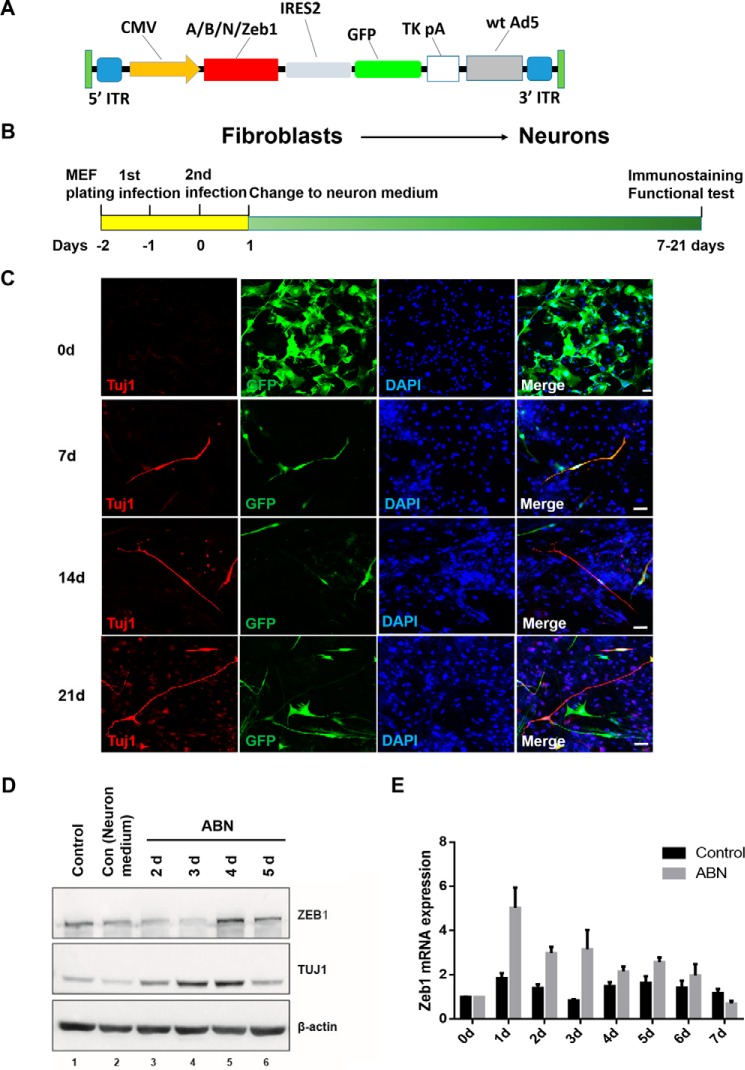
To examine the expression of Zeb1 during the early stages of transdifferentiation from MEFs to functional neurons, primary MEFs were isolated from E13.5 mouse embryos, taking great care to exclude pre-existing neurons, astrocytes, and neural progenitors (supplemental Fig. S1A). We ectopically overexpressed the target genes using the commercial pAd-DESTTM adenoviral vector, whose backbone contains enhanced green fluorescent protein (eGFP) to facilitate the calculation of virus titers and the tracing of iN cells during transdifferentiation (18) (Fig. 1A). MEFs were infected with Ascl1, Brn2, and Ngn2 once daily for 2 consecutive days in transdifferentiation medium and then cultured in neuronal medium to promote neuronal survival and maturation until further analysis (Fig. 1B). During culture in neuronal medium, MEFs were gradually induced into bipolar neuron-like cells, some of which even expressed the neuronal marker β-III-tubulin (Tuj1) 7 days post-infection (Fig. 1C). iN cells became gradually mature as the culture period progressed (Fig. 1C). Real-time PCR and Western blotting also showed that Tuj1 levels were up-regulated over time, indicating the successful establishment of the transdifferentiation system (Fig. 1D and supplemental Fig. S1B). In conjunction with TUJ1 expression, ZEB1 protein levels increased during transdifferentiation. Both ZEB1 and TUJ1 reached their highest expression levels on day 4, and then their expression declined (Fig. 1D). Consistent with the Western blot results, Zeb1 mRNA was strongly up-regulated at the beginning of transdifferentiation, peaking on day 1 (Fig. 1E).
Figure 1.
Zeb1 was strongly up-regulated during the early stages of transdifferentiation from MEFs into iN cells. A, the mouse cDNAs of Ascl1, Brn2, Ngn2, and Zeb1 were cloned into a commercial adenoviral vector (pAd/CMV/V5-DESTTM) under the control of a CMV promoter. B, a schematic overview of the generation of iN cells by ABN or ABN + Zeb1. C, iN cells were immunostained with TUJ1 on days 7, 14, and 21 post-infection. eGFP marks cells infected by adenovirus (here and for subsequent experiments). DAPI shows nuclei. Scale bar, 50 μm. D, Western blotting of ZEB1 and TUJ1 expression in the indicated cells. β-actin is the loading control (here and for subsequent experiments). E, quantitative real-time PCR analysis of Zeb1 expression during ABN-induced transdifferentiation.
Knocking down Zeb1 significantly decreased the transdifferentiation efficiency of MEFs into neurons by ABN
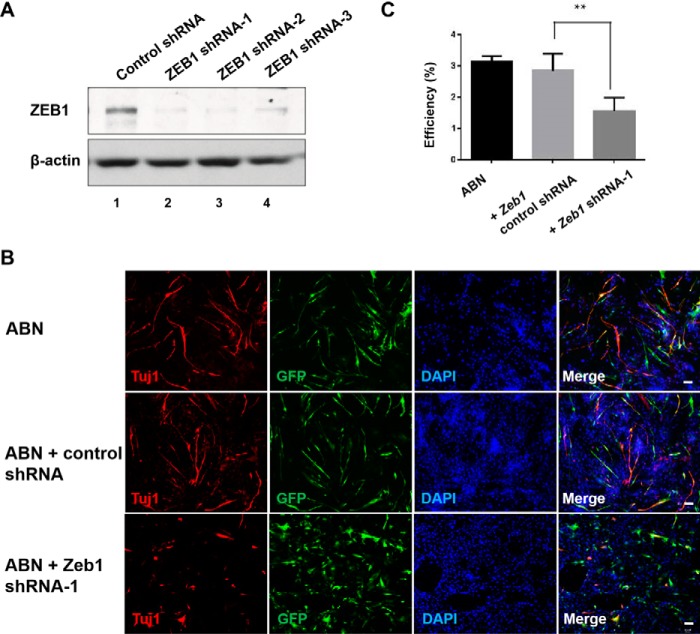
To test the functional role of Zeb1 during transdifferentiation, we knocked down Zeb1 in Ascl1, Brn2, and Ngn2-infected MEFs on day 2 post-infection using lentiviruses carrying either Zeb1 shRNA or control shRNA (Fig. 2A). The number of iN cells was counted based on immunofluorescence analysis of TUJ1 expression 7 days post-infection, whereas the conversion efficiency was calculated by dividing the number of iN cells (TUJ1 positive) by the number of total cells in each field (Fig. 2C). The control groups (ABN alone or ABN plus control shRNA) showed almost equal numbers of TUJ1-positive cells (Fig. 2, B and C). However, the number of TUJ1-positive cells was dramatically reduced in the Zeb1 shRNA-infected group (Fig. 2, B and C) (p < 0.01).
Figure 2.
Zeb1 shRNA strongly reduced the efficiency of ABN-induced transdifferentiation from MEFs into iN cells. A, Western blotting of ZEB1 in cells transfected with either control siRNA or Zeb1 shRNA. B, immunofluorescence staining of TUJ1 in cells with indicated treatment. The immunostaining was repeated at least three times (here and for subsequent experiments). Scale bar, 50 μm. C, the transdifferentiation efficiency from MEFs into iN cells was presented as the percentage of induced TUJ1-positive cells versus total cells stained by DAPI. Data represent the mean ± S.D. **, p < 0.01.
Zeb1 promoted ABN-mediated transdifferentiation from MEFs into neurons
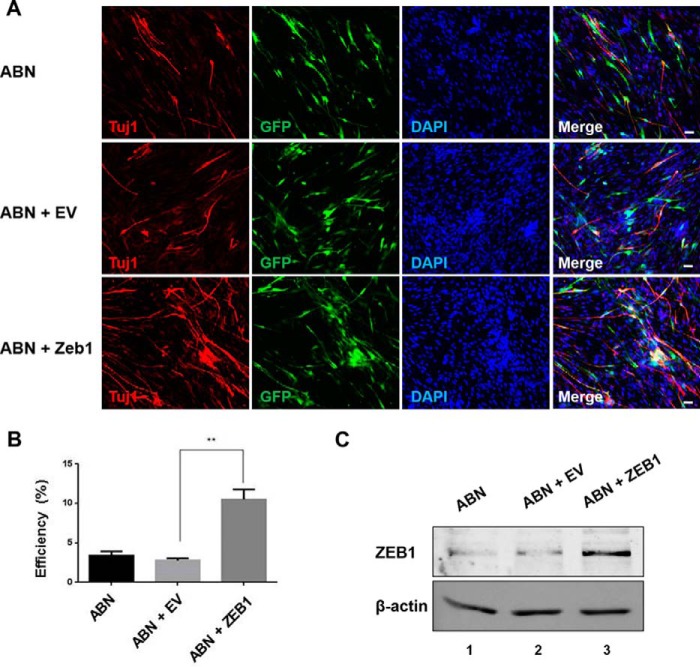
Encouraged by the above Zeb1 knockdown results, we investigated the effect of Zeb1 overexpression on transdifferentiation efficiency. We introduced the Zeb1 adenovirus or the control adenovirus into MEFs infected with Ascl1, Brn2, and Ngn2. Seven days later, more TUJ1-positive cells were observed in the Zeb1-overexpressing MEFs, as demonstrated by immunostaining (Fig. 3A). Statistical analyses showed that Zeb1 overexpression promoted the conversion of MEFs into neurons by more than 3-fold compared with the control group (Fig. 3B) (p < 0.01). With the introduction of Zeb1, the ABN-treated MEFs started to exhibit neuronal morphology 3 days post Zeb1 infection, as determined by eGFP expression, whereas neuronal morphology was not observed in the control cells until 5 days after Zeb1 infection (data not shown).
Figure 3.
Zeb1 overexpression promoted the generation of iN cells. A, immunofluorescence staining of TUJ1 in iN cells treated with different combinations for 7 days as indicated. Scale bar, 50 μm. B, the transdifferentiation efficiency from MEFs into iN cells, presented as the percentage of ABN + empty vector (EV) or ABN + Zeb1-induced TUJ1-positive neuronal cells versus total cells 7 days post-infection. The total cells were determined by DAPI staining. Data represent the mean ± S.D. **, p < 0.01. C, Western blotting of ZEB1 expression in cells under the indicated treatments.
iN cells infected with ABN + Zeb1 matured with prolonged cultivation (supplemental Fig. S2A), and we observed some multipolar neurons in both the ABN and the ABN + Zeb1 groups after 3 weeks, with comparably more complex structures (supplemental Fig. S2B).
Zeb1 promoted the generation of mature iN cells
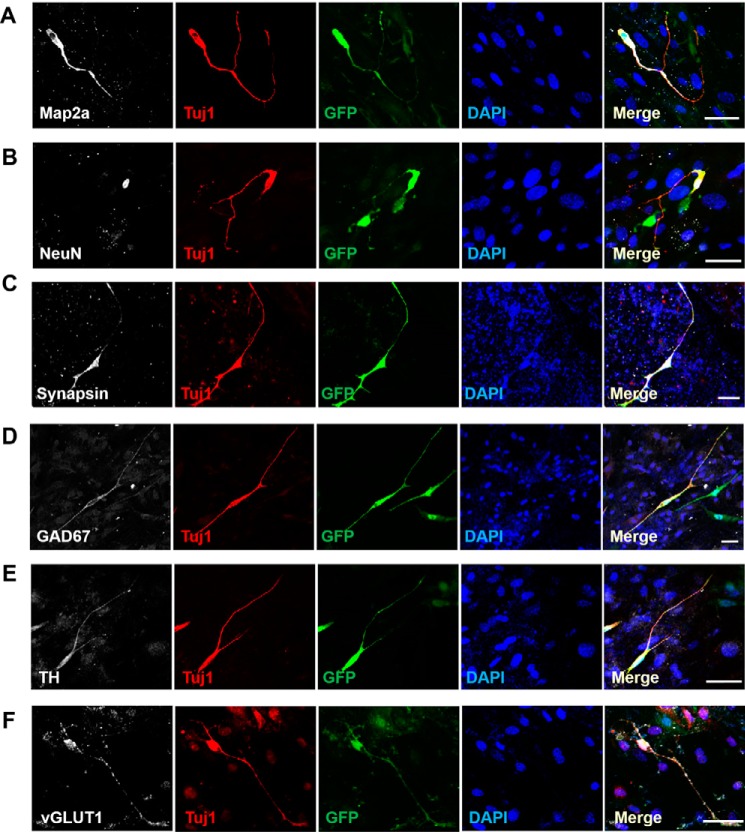
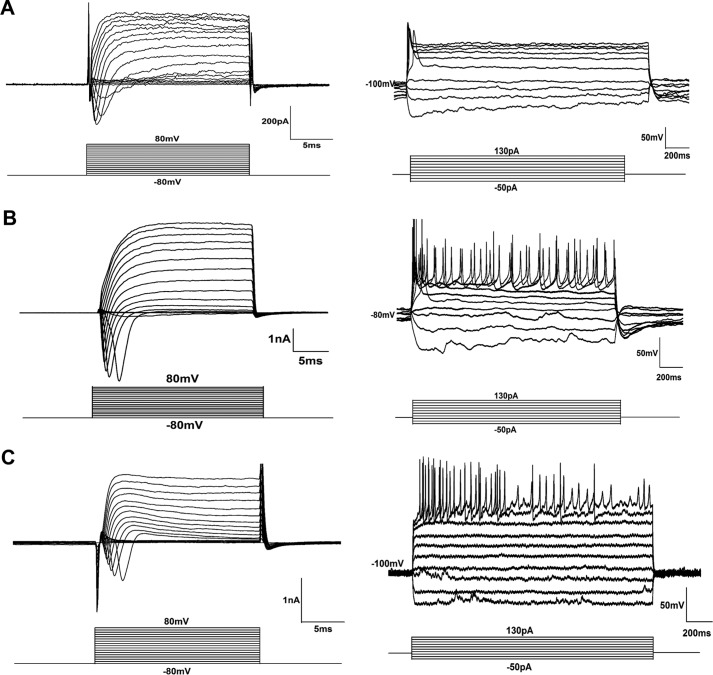
Although the iN cells generated by Ascl1, Brn2, and Ngn2 and Zeb1 were TUJ1 positive and showed a neuronal morphology, it was necessary to evaluate the maturity of the iN cells. Immunostaining showed that the iN cells expressed mature neuronal markers 14 days post-infection, including the pan-neuronal markers microtubule-associated protein 2a (Map2a) (76.27% of the total iN cells) (Fig. 4A), neuronal nuclear protein (NeuN) (55.02% of the total iN cells) (Fig. 4B), and Synapsin (75.04% of the total iN cells) (Fig. 4C); the inhibitory neuron marker glutamate decarboxylase 1 (GAD67) (34.3% of the total iN cells) (Fig. 4D); the dopaminergic neuron marker tyrosine hydroxylase (TH) (20.25% of the total iN cells) (Fig. 4E); and the excitatory neuron marker vesicular glutamate transporter 1 (vGLUT1) (17.05% of the total iN cells) (Fig. 4F). We also tested the expression of these neuronal markers at other time points. On day 7 post-infection, only Map2a, Synapsin, and NeuN were detected (supplemental Fig. S3), but on day 21 post-infection, iN cells expressed all these neuronal markers we detected, with more complex structures (supplemental Fig. S4). Next, we investigated whether Zeb1 could facilitate the maturation of iN cells at the physiological level. To examine the electrophysiological properties of the iN cells, such as the ability to fire action potentials (APs) and the induction of a membrane current, we performed whole-cell patch clamp recording of iN cells with a complex neuronal morphology (eGFP positive) on day 21 after adenovirus infection. Primary neurons were used as a positive control. Although depolarizing voltage steps in voltage clamp mode elicited fast inward sodium currents in both the ABN-induced (Fig. 5A) and the Ascl1, Brn2, and Ngn2 + Zeb1-induced (Fig. 5B) iN cells, the latter appeared to exhibit better sodium and potassium currents that were more similar to those of primary neurons (Fig. 5C). By contrast, we observed almost no consecutive APs in the ABN-infected iN cells 21 days post-infection (Fig. 5A). Following Zeb1 overexpression, however, the iN cells were able to fire multiple APs, similar to the primary neurons (Fig. 5, B and C). These results illustrated that Zeb1 promoted maturation of iN cells and functional membrane properties.
Figure 4.
Characterization of iN cells by mature neuronal markers. A–F, immunostaining analysis of mature neuronal markers 2 weeks post-infection using the antibodies against Map2a (A), NeuN (B), and Synapsin (C), pan-neuronal markers; GAD67 (D), inhibitory neuron marker; tyrosine hydroxylase (TH) (E), dopaminergic neuron marker; vGLUT1 (F), excitatory neuron marker. Scale bar, 50 μm.
Figure 5.
Identification of iN cells by electrophysiology. A–C, electrophysiology recordings of iN cells induced by ABN (A) or ABN + Zeb1 (B) for 3 weeks. C, electrophysiology recordings of mouse primary neurons as a positive control. The Na+ and K+ current crest values are shown.
Zeb1 facilitated the generation of iN cells induced by a single transcription factor
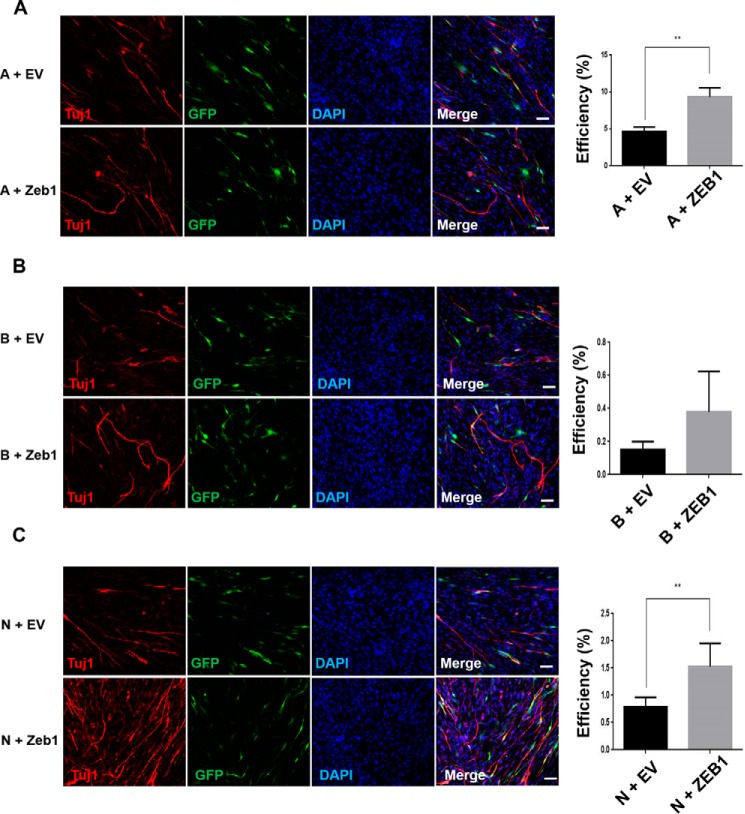
Previously, we found that the individual transcription factors Ascl1, Brn2, and Ngn2 were also able to mediate the reprogramming and conversion of MEFs into TUJ1-positive iN cells, although the process was slow and inefficient (data not shown). We therefore examined whether Zeb1 in combination with Ascl1, Brn2, or Ngn2 alone could improve the transdifferentiation efficiency. To address this question, we introduced Zeb1 into Ascl1-, Brn2-, or Ngn2-infected MEFs. Although the transdifferentiation efficiency was 4.64, 0.15, and 0.79%, respectively, for Ascl1, Brn2, and Ngn2 alone, Zeb1 overexpression increased the efficiencies to 9.34% (Fig. 6A) (p < 0.01), 0.38% (Fig. 6B), and 1.53% (Fig. 6C) (p < 0.01) in the Ascl1-, Brn2-, and Ngn2-treated groups, respectively. We also observed bipolar or multipolar iN cells after 3 weeks of cultivation in these groups (supplemental Fig. S5). Interestingly, even Zeb1 alone was able to convert MEFs into TUJ1-positive iN cells with more complex bipolar structures with the culture progressed (supplemental Fig. S6).
Figure 6.
Zeb1 overexpression promoted the generation of iN cells following transdifferentiation with Ascl1, Brn2, and Ngn2 alone. A–C, immunofluorescence staining of TUJ1 in the indicated cells. The conversion efficiency of each group was quantified by calculating the ratio of TUJ1-positive cells versus the total cells. A, Ascl1; B, Brn2; and N, Ngn2. Data represent the means ± S.D. **, p < 0.01. Scale bars, 50 μm.
iN cells formed functional synapse in vivo after transplantation
For accurate functional analysis of induced neurons, we transplanted Ascl1, Brn2, and Ngn2- + Zeb1-induced iN cells (3 days post-infection) to the hippocampal area of 4-week-old C57BL/6 mice (Fig. 7A). The mice that received grafts unilaterally were euthanized 3 weeks after transplantation, and the brain sections were collected for analysis. eGFP showed 2–3% iN cells survived in the brain; after staining the brain sections with SYNAPSIN, we found some grafted iN cells labeled with GFP appeared to have extensive presynaptic innervation with other neurons (Fig. 7B), suggesting the transplanted iN cells converted into neurons in vivo. Furthermore, we found the iN cells expressed other neuronal markers, such as NeuN, GAD67, and vGLUT1 (Fig. 7, C–E), indicating the maturation of iN cells in vivo.
Figure 7.
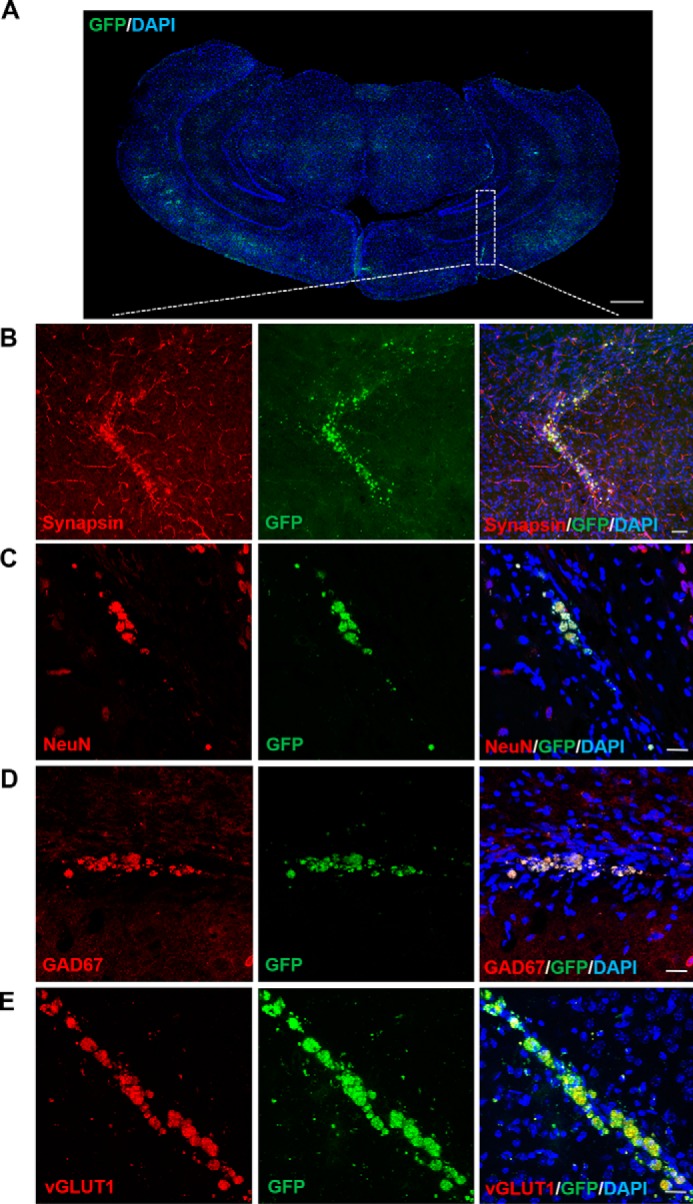
Transplantation of ABN + Zeb1 iN cells in vivo. A, a schematic overview of grafted GFP+ iN cells transplantation in the brain cortex. White dotted lines represent transplantation site. B, iN cells express SYNAPSIN 3 weeks after transplantation. C–E, iN cells express mature neuronal markers NeuN (C), GAD67 (D), vGLUT1 (E) 3 weeks after transplantation. Scale bars, 50 μm.
Zeb1 promoted primary neuron-like gene expression profiles in iN cells
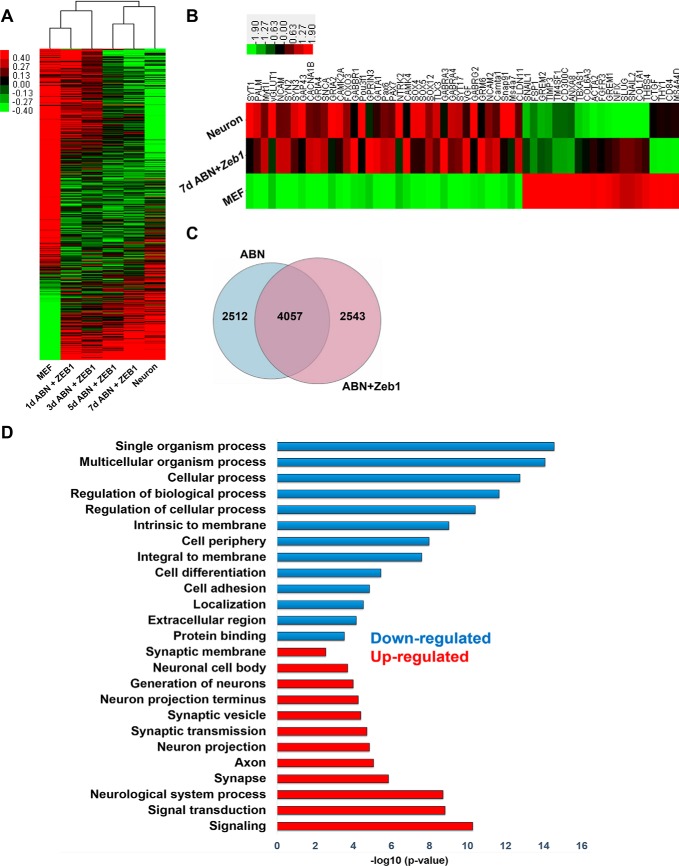
To elucidate the molecular mechanism by which Zeb1 promoted the transdifferentiation of MEFs into neurons following ABN induction, we examined genome-wide transcriptional changes in iN cells from days 1 to 7 post-infection using a genome-wide RNA array analysis. In this process, the genome expression patterns of both the ABN (supplemental Fig. S7A) and the Ascl1, Brn2, and Ngn2 + Zeb1 (Fig. 8A) groups became increasingly similar to the primary neurons. However, in the ABN groups, the 5-day and 7-day profiles were more similar to the 3-day profile than to that of the primary neurons, whereas the 5-day and 7-day samples in the ABN + Zeb1 groups tended to more closely mirror the primary neurons (Fig. 8A and supplemental Fig. S7A). During the conversion from MEFs to neurons, neuron-related genes such as SYT1, PALM, Myt1l, NCAM, SYN2, and SYN3 were significantly up-regulated (Fig. 8B), whereas MEF-related genes such as Snail1, FSP1, CD84, CD300C, COL1A1, and GREM2 were markedly down-regulated (Fig. 8B).
Figure 8.
Whole-genome RNA array analysis of gene expression profiles. A, hierarchical clustering analysis of the whole-genome profiles of ABN + Zeb1 groups. Primary neurons were isolated from the hippocampus of a newborn pup. iN cells were harvested at the indicated time points. B, hierarchical clustering analysis of specific genes mainly expressed in neurons or MEFs. Primary neurons were isolated from the hippocampus of a newborn pup, as above. iN cells were derived 7 days post-transfection. C, Venn diagram showing the overlap between the 6,569 DEGs from the ABN group and the 6,600 DEGs from the ABN + Zeb1 group after 7 days of cultivation. D, Gene Ontology analysis of the significantly differentially expressed genes in the 7-day ABN + Zeb1 group versus ABN.
To explore the similarities in the genome-wide expression patterns of iN cells and primary neurons, we subjected all 14 samples (1–7 days ABN and 1–7 days ABN + Zeb1) to principle component analysis. The gene expression patterns of the iN cells showed progressively increasing differences from MEFs and a stepwise increase in similarity to the primary neurons over time. The 7-day ABN + Zeb1 sample was closest to the positive control and showed a higher degree of similarity to the primary neurons than to the ABN sample (supplemental Fig. S7B). Bioinformatic analysis identified 6,569 differentially expressed genes (DEGs) (-fold change >2) (p < 0.05) in the ABN group and 6,600 DEGs in the ABN + Zeb1 group compared with the control. Additionally, most DEGs (4,057 DEGs) from the two groups overlapped (Fig. 8C). We then compared the two DEG groups (7-day ABN and 7-day ABN + Zeb1). The up-regulated and down-regulated genes in 7-day ABN + Zeb1 were subjected to Gene Ontology (GO) function enrichment analysis. Intriguingly, most up-regulated genes were enriched for GO terms associated with neuronal properties, such as signaling, neurological system process, and synapse or synaptic transmission, whereas most of the down-regulated genes were enriched in the GO terms related to MEF processes, including cellular process, regulation of biological process, cell periphery, and cell adhesion (Fig. 8D).
To obtain a broad overview of the changes in transcript abundance over time, we performed Short Time-series Expression Miner (STEM) analysis. We found that a gene cluster continued growing over the 7-day cultivation (supplemental Fig. S8, A and B). Then, we sent this cluster of 710 genes for GO analysis and found that these genes were mostly enriched for GO terms associated with neuronal processes, such as neuronal postsynaptic density, synaptic membrane, neuron-neuron synaptic transmission, and neuron cell body (supplemental Fig. S8C).
Discussion
In this study, we used an adenovirus carrying Zeb1 together with the defined non-integrating ABN transcription factors to convert MEFs into neurons. Zeb1 is not a traditional neuronal transcription factor. Here, we found for the first time that this non-neuronal transcription factor can promote the ABN-induced transdifferentiation of fibroblasts into neurons based on the following evidence. First, knocking down Zeb1 in the ABN inducing system significantly decreased the transdifferentiation efficiency. Conversely, the addition of Zeb1 not only accelerated transdifferentiation but also improved the function of the induced neurons. Second, the ABN + Zeb1-induced neurons expressed specific neuronal markers, and they exhibited electrophysiological properties that were more similar to the primary neurons. More intriguingly, these iN cells further matured and formed functional synapses in vivo after being transplanted into the hippocampal area of the mouse brain.
RNA array and bioinformatic analyses showed that the expression profiles of the ABN + Zeb1 samples were more similar to primary neurons than the ABN groups and that ABN + Zeb1 could up-regulate neuron-related genes and down-regulate MEF-related genes to a greater degree than the ABN group. Short Time-series Expression Miner analysis found that ABN +Zeb1 up-regulated two more clusters of genes than did the ABN group; the function of these genes were “negative regulation of neuron apoptotic process” and “negative regulation of neuron death,” suggesting Zeb1 may improve the transdifferentiation by modulating apoptosis. p53 was an important factor in programmed cell apoptosis, and it was recently reported that p53 repressed Zeb1 and Zeb2 expression by up-regulating miRNAs, including miR-200 and miR-192 family members (37). Conversely, suppression of p53 markedly increased the transdifferentiation efficiency of fibroblasts into induced dopaminergic neurons by Ascl1, Nurr1, Lmx1a, and miR-124 (38). Thus, there may be a regulatory network between Zeb1, p53, and neuron death-regulating genes during transdifferentiation from MEFs into neurons, which requires further study.
Another interesting finding of this study is that Zeb1 improved the transdifferentiation efficiency induced by single neuron transcription factors, Ascl1 or Ngn2. Ascl1 has been reported to be the driving force for iN cell reprogramming. MEFs transfected with Ascl1 alone were fully reprogrammed to a neuronal lineage but were less mature at early time points and required further maturation by the introduction of two other transcription factors (Brn2 and Myt1l) at later time points (4, 6). Here, we found that Zeb1 overexpression significantly improved Ascl1-mediated transdifferentiation. Other single transcription factors, such as NeuroD1 or Ngn2, could facilitate differentiation from human/mouse ESCs or iPSCs into neurons, but cannot mediate the transdifferentiation from fibroblasts to neurons (3, 36). In our study, Ngn2 alone was found to be able to promote transdifferentiation from fibroblasts to neurons, albeit with a relatively low efficiency, and the addition of Zeb1 greatly improved this efficiency. Zeb1 could also promote Brn2-activated transdifferentiation to some extent, although this effect was not statistically significant. This result was expected because Brn2 is primarily required during later reprogramming stages to enhance neuronal maturation and is not deterministic for the neuronal lineage when expressed alone (6). Furthermore, we found even Zeb1 alone could initiate the transdifferentiation of MEFs into iN cells. It is a fascinating challenge to investigate the related mechanisms and elucidate whether Zeb1 alone can transdifferentiate MEFs into mature and functional neurons.
In summary, our data revealed that Zeb1 is a new and important transcription factor in transdifferentiation; it can promote the transdifferentiation from MEFs into iN cells more efficiently and functionally.
Experimental procedures
Animals
WT ICR mice, age 6–8 weeks, 10 female (∼26 g) and 5 male (∼30 g), were purchased from Vital River Laboratory Animal Technology Corp (Beijing, China) and then raised in a sterile room. All experiments were performed under the guidance of the Ethics Committee of the Institute of Zoology, Chinese Academy of Sciences.
Isolation and culture of mouse embryonic fibroblasts
Primary MEFs were isolated from E13.5 ICR mouse embryos (1). First, the head, dorsal root ganglia, vertebral column, and visceral organs were removed; then, the remaining tissues were dissected into small pieces and treated with 0.25% trypsin (25200–056, Gibco) for 10 min. The dissociated cells were cultured in DMEM (11995–065, Gibco) supplemented with 10% fetal bovine serum (FBS) (Biochrom), 0.1 mm non-essential amino acids (NEAA) (11140–050, Gibco), and 2 mm GlutaMAX (35050–061, Gibco) in a 37 °C and 5% CO2 incubator. MEFs were used between passages two and four.
Adenovirus production and infection
We used the Gateway Expression System (Invitrogen) to produce adenoviruses carrying the transcription factors Ascl1, Brn2, Ngn2, or Zeb1, as described previously (18). The candidate genes were amplified from a mouse cDNA library and inserted into the pENTR 3C Dual Selection Vector (Invitrogen). The resulting plasmids were generated by LR (attL × attR) recombination reaction. Viral constructs were transfected into 293A cells, and high-titer (108 IU/ml) viral particles were obtained by two rounds of amplification according to the manufacturer's instructions. The determination of the adenoviral titer was similar to that of the lentiviral titer except that the virus stock was diluted because the addition of a high concentration of adenovirus caused the majority of the 293T cells to die quickly. MEFs were infected twice with adenovirus for 8 h per day at a multiplicity of infection (m.o.i.) of 10. Twenty-four h later, half of the culture medium was changed to neural medium (Neurobasal medium/DMEM-F12 1:1, 1×B-27, 5 ng/ml BDNF). Afterward, half of the medium was replaced every 2 days until the cells were ready for immunostaining and electrophysiological experiments.
Lentivirus production
Lentiviruses containing the different shRNAs were purchased from GenePharma (Suzhou). Control shRNA sequence was TTCTCCGAACGTGTCACGTTTC. Zeb1 shRNA sequence was GAAAGGCATTTAAACACAA; GCAGTTACACCTTTGCATA; GCCCACAGATACGACAGAA.
Immunofluorescence
iN cells were fixed with 4% paraformaldehyde (PFA) for 20 min at room temperature and then treated with 0.3% Triton X-100 for 10 min before being blocked with 5% BSA for 30 min. Primary antibodies were diluted in antibody dilution buffer (PBS with 1% BSA and 0.1% Triton X-100). The iN cells were incubated overnight with primary antibody at 4 °C and treated with secondary antibody for 60 min at room temperature. The following primary antibodies were used: rabbit anti-TUJ1 (T3952, Sigma), mouse anti-MAP2a (MAB378, Millipore), mouse anti-NeuN (MAB377, Millipore), rabbit anti-TH (AB152, Millipore), rabbit anti-ZEB1 (ABN285, Millipore), mouse anti-GAD67 (MAB5406, Millipore), mouse anti-SYPSIN (106001, Synaptic Systems), and mouse anti-vGLUT1 (MAB5502, Millipore). The secondary antibodies were diluted 1:200 in ADS. The cells were washed with PBS and incubated with the appropriate highly cross-adsorbed Alexa Fluor 555 goat anti-rabbit IgG (A-21429, Life Technologies) and Alexa Fluor 647 goat anti-mouse IgG antibodies (A-21236, Life Technologies). Images were acquired on a Carl Zeiss LSM 780 confocal laser-scanning microscope with a 10× or 20× objective lens, and image analysis was conducted using the Zeiss LSM Image Browser software.
Transdifferentiation efficiency analysis
The conversion efficiency was quantified using the neuronal purity as the percentage of TUJ1 cells relative to the total final population. Briefly, 8 to 10 visual fields were randomly selected per well. The number of iN cells marked by TUJ1 staining and the number of total cells visualized by DAPI staining were counted. The efficiency was calculated by dividing the number of iN cells by the number of total cells in each field.
Quantitative PCR analysis
The transdifferentiated cells were harvested every 24 h. Total RNA was extracted using TRIzol (15596–018, Ambion) according to the manufacturer's instructions. Two micrograms of total RNA was reverse transcribed and then quantified using SYBR Green (RR820A, TaKaRa). β-actin was included as the reference. The sequences of the Zeb1 primers were as follows: Forward: 5′-TGAGCACACAGGTAAGAGGCC-3′; reverse: 5′-GGCTTTTCCCCAGAGTGCA-3′.
Western blotting
Cells were lysed in RIPA buffer (50 mm Tris, pH 7.5, 150 mm NaCl, 0.1% SDS, 1% Nonidet P-40, 2 mm EDTA, and 0.5% sodium deoxycholate) supplemented with 1 mm phenylmethylsulfonyl fluoride and a protease inhibitor mixture (Roche). Proteins were quantified using the BCA Protein Assay Kit (Pierce Biotechnology). Briefly, 20 μg of total protein extract were subjected to SDS-PAGE and transferred electrophoretically onto a pure nitrocellulose blotting membrane (Pall Corporation). After being blocked with 5% skim milk, the membrane was sequentially incubated with primary antibodies against ZEB1 (sc-25388, Santa Cruz), TUJ1 (T3952, Sigma), and β-actin (TA-09, ZSGB-Bio), followed by horseradish peroxidase-conjugated secondary antibodies. The signals were developed using the GeneGnome Imaging System (Syngene).
Electrophysiology
Electrophysiological experiments were performed on MEF-derived iN cells 7–12 days post-infection. Whole-cell patch clamp recordings in either voltage or current clamp mode were conducted to measure voltage-activated sodium/potassium currents or action potentials and were recorded using an Axopatch 200B or MultiClamp 700A amplifier (Molecular Devices). The electric signals were filtered at 2–10 kHz, digitized at 20–100 kHz (Digidata 1322A, Molecular Devices) and analyzed using pClamp version 9.2 (Molecular Devices). The glass micropipette contained a solution consisting of 130 mm K+-gluconate, 20 mm KCl, 10 mm HEPES, 0.2 mm EGTA, 4 mm Mg2ATP, 0.3 mm Na2GTP, and 10 mm Na2+-phosphocreatine (at pH 7.3, 310 mosmol), and the pipette ranged from 2.0 to 4.0 megaohms. The bath solution contained 124 mm NaCl, 3.3 mm KCl, 2.4 mm MgSO4, 1.2 mm NaH2PO4, 26 mm NaHCO3, and 10 mm glucose (at pH 7.4, 310 mosmol). The transmitter receptor blockers tetrodotoxin (100 nm), AP5 ((2R)-amino-5-phosphonovaleric acid) (50 μm), and CNQX (6-cyano-7-nitroquinoxaline-2,3-dione) (10 μm) were used in the bath solution for the detection of action potentials and spontaneous excitatory postsynaptic currents.
Transplantation of iN cells in vivo
5 × 10⁴ iN cells were transplanted into the hippocampal area of 4-week-old C57BL/6 mice. Three weeks after transplantation, the mice were perfused with 0.9% saline and followed by 4% PFA. The brains were dissected out and fixed in 4% PFA overnight, followed by dehydration in 15% sucrose for 1 day at 4 °C, then 30% sucrose for 1 day at 4 °C. Consecutive coronal sections (30 μm) were prepared using a Leica CM 1950 Sliding Microtome.
Gene expression microarray analysis
The mouse genome-wide gene expression analysis was performed using Human OneArray gene chips (Phalanx Biotech Group, Inc.). Total RNA was extracted from primary MEFs, from MEFs infected with adenoviruses carrying ABN or ABN + Zeb1 at different days post-infection, and from primary hippocampus neurons from a postnatal day 0 ICR mouse (a positive control). RNA was reversed transcribed using SuperScript ΙΙ Reverse Transcriptase (18064–014, Invitrogen). For gene expression profiling analysis, the MouseWG-6 v2.0 Expression BeadChip Kit was used, which contains 26,423 mouse genome probes and 872 experimental control probes. The Rosetta Resolver System (Rosetta Biosoftware) was used to calculate the GeneChip Robust Multichip Average and to normalize the data sets for the single-channel experiment analyses. Principle component analysis was performed using SPSS V.19. Hierarchical clustering analysis was applied using a Euclidean distance matrix and the complete-linkage clustering method. Linear models and empirical Bayes' methods were used to choose DEGs that showed > 2-fold changes and an adjusted p value less than 0.05. Afterward, DEGs with expression level changes > 2-fold were applied for GO analyses using DAVID Bioinformatics Resources.
Statistical analysis
Statistical analysis was performed using Student's t test with a paired, 2-tailed distribution. Values were considered statistically significant at p < 0.05 (*) and p < 0.01 (**). All data represent the mean ± S.D. or S.E., as detailed in the figure legends.
Author contributions
Author contributions: H. W. conceived the study, designed the experiments, and supervised the research. J. J. conceived the study and critically revised the manuscript. L. Y., Y. L., Z. S., and X. L. conducted the experiments and analyzed the data. L. Y. and Y. L. collected and analyzed the data, organized figures, and drafted the manuscript. Z. S. and X. L. contributed to the adenoviral vector construction and the figure organization. J. M. contributed to the immunofluorescent experiments. B. H. conceived the study and commented on the manuscript. All authors contributed to the figure and manuscript preparation and approved the version that was submitted.
Supplementary Material
Acknowledgment
We are very grateful to the Beijing Compass Biotechnology Company for its excellent technical assistance with the microarray experiments.
This work was supported by the Strategic Priority Research Program of the Chinese Academy of Sciences (XDA01020102). The authors declare that they have no conflicts of interest with the contents of this article.
This article contains supplemental Figs. S1–S8.
- MEFs
- mouse embryonic fibroblasts
- EMT
- epithelial-mesenchymal transition
- iN
- induced neuron
- ESC
- embryonic stem cells
- iPSCs
- induced pluripotent stem cells
- eGFP
- enhanced green fluorescent protein
- APs
- action potentials
- DEGs
- differentially expressed genes
- GO
- Gene Ontology
- PFA
- paraformaldehyde.
References
- 1. Vierbuchen T., Ostermeier A., Pang Z. P., Kokubu Y., Südhof T. C., and Wernig M. (2010) Direct conversion of fibroblasts to functional neurons by defined factors. Nature 463, 1035–1041 [DOI] [PMC free article] [PubMed] [Google Scholar]
- 2. Pang Z. P., Yang N., Vierbuchen T., Ostermeier A., Fuentes D. R., Yang T. Q., Citri A., Sebastiano V., Marro S., Südhof T. C., and Wernig M. (2011) Induction of human neuronal cells by defined transcription factors. Nature 476, 220–223 [DOI] [PMC free article] [PubMed] [Google Scholar]
- 3. Zhang Y., Pak C., Han Y., Ahlenius H., Zhang Z., Chanda S., Marro S., Patzke C., Acuna C., Covy J., Xu W., Yang N., Danko T., Chen L., Wernig M., and Südhof T. C. (2013) Rapid single-step induction of functional neurons from human pluripotent stem cells. Neuron 78, 785–798 [DOI] [PMC free article] [PubMed] [Google Scholar]
- 4. Wapinski O. L., Vierbuchen T., Qu K., Lee Q. Y., Chanda S., Fuentes D. R., Giresi P. G., Ng Y. H., Marro S., Neff N. F., Drechsel D., Martynoga B., Castro D. S., Webb A. E., Südhof T. C., Brunet A., Guillemot F., Chang H. Y., and Wernig M. (2013) Hierarchical mechanisms for direct reprogramming of fibroblasts to neurons. Cell 155, 621–635 [DOI] [PMC free article] [PubMed] [Google Scholar]
- 5. Ali F. R., Cheng K., Kirwan P., Metcalfe S., Livesey F. J., Barker R. A., and Philpott A. (2014) The phosphorylation status of Ascl1 is a key determinant of neuronal differentiation and maturation in vivo and in vitro. Development 141, 2216–2224 [DOI] [PubMed] [Google Scholar]
- 6. Chanda S., Ang C. E., Davila J., Pak C., Mall M., Lee Q. Y., Ahlenius H., Jung S. W., Südhof T. C., and Wernig M. (2014) Generation of induced neuronal cells by the single reprogramming factor ASCL1. Stem Cell Reports 3, 282–296 [DOI] [PMC free article] [PubMed] [Google Scholar]
- 7. Pfisterer U., Kirkeby A., Torper O., Wood J., Nelander J., Dufour A., Björklund A., Lindvall O., Jakobsson J., and Parmar M. (2011) Direct conversion of human fibroblasts to dopaminergic neurons. Proc. Natl. Acad. Sci. U.S.A. 108, 10343–10348 [DOI] [PMC free article] [PubMed] [Google Scholar]
- 8. Caiazzo M., Dell'Anno M. T., Dvoretskova E., Lazarevic D., Taverna S., Leo D., Sotnikova T. D., Menegon A., Roncaglia P., Colciago G., Russo G., Carninci P., Pezzoli G., Gainetdinov R. R., Gustincich S., Dityatev A., and Broccoli V. (2011) Direct generation of functional dopaminergic neurons from mouse and human fibroblasts. Nature 476, 224–227 [DOI] [PubMed] [Google Scholar]
- 9. Ambasudhan R., Talantova M., Coleman R., Yuan X., Zhu S., Lipton S. A., and Ding S. (2011) Direct reprogramming of adult human fibroblasts to functional neurons under defined conditions. Cell Stem Cell 9, 113–118 [DOI] [PMC free article] [PubMed] [Google Scholar]
- 10. Son E. Y., Ichida J. K., Wainger B. J., Toma J. S., Rafuse V. F., Woolf C. J., and Eggan K. (2011) Conversion of mouse and human fibroblasts into functional spinal motor neurons. Cell Stem Cell 9, 205–218 [DOI] [PMC free article] [PubMed] [Google Scholar]
- 11. Ladewig J., Mertens J., Kesavan J., Doerr J., Poppe D., Glaue F., Herms S., Wernet P., Kögler G., Müller F.-J., Koch P., and Brüstle O. (2012) Small molecules enable highly efficient neuronal conversion of human fibroblasts. Nature Methods 9, 575–578 [DOI] [PubMed] [Google Scholar]
- 12. Shenoy A., and Blelloch R. (2012) microRNA induced transdifferentiation. F1000 Biology Reports 4, 3. [DOI] [PMC free article] [PubMed] [Google Scholar]
- 13. Chanda S., Marro S., Wernig M., and Südhof T. C. (2013) Neurons generated by direct conversion of fibroblasts reproduce synaptic phenotype caused by autism-associated neuroligin-3 mutation. Proc. Natl. Acad. Sci. U.S.A. 110, 16622–16627 [DOI] [PMC free article] [PubMed] [Google Scholar]
- 14. Chang Y. C., Tsai C. H., Lai Y. L., Yu C. C., Chi W. Y., Li J. J., and Chang W. W. (2014) Arecoline-induced myofibroblast transdifferentiation from human buccal mucosal fibroblasts is mediated by ZEB1. J. Cell. Mol. Med. 18, 698–708 [DOI] [PMC free article] [PubMed] [Google Scholar]
- 15. Hu W., Qiu B., Guan W., Wang Q., Wang M., Li W., Gao L., Shen L., Huang Y., Xie G., Zhao H., Jin Y., Tang B., Yu Y., Zhao J., and Pei G. (2015) Direct conversion of normal and Alzheimer's disease human fibroblasts into neuronal cells by small molecules. Cell Stem Cell 17, 204–212 [DOI] [PubMed] [Google Scholar]
- 16. Li X., Zuo X., Jing J., Ma Y., Wang J., Liu D., Zhu J., Du X., Xiong L., Du Y., Xu J., Xiao X., Wang J., Chai Z., Zhao Y., and Deng H. (2015) Small-molecule-driven direct reprogramming of mouse fibroblasts into functional neurons. Cell Stem Cell 17, 195–203 [DOI] [PubMed] [Google Scholar]
- 17. Yoo A. S., Sun A. X., Li L., Shcheglovitov A., Portmann T., Li Y., Lee-Messer C., Dolmetsch R. E., Tsien R. W., and Crabtree G. R. (2011) MicroRNA-mediated conversion of human fibroblasts to neurons. Nature 476, 228–231 [DOI] [PMC free article] [PubMed] [Google Scholar]
- 18. Meng F., Chen S., Miao Q., Zhou K., Lao Q., Zhang X., Guo W., and Jiao J. (2012) Induction of fibroblasts to neurons through adenoviral gene delivery. Cell Res. 22, 436–440 [DOI] [PMC free article] [PubMed] [Google Scholar]
- 19. Shi Z., Shen T., Liu Y., Huang Y., and Jiao J. (2014) Retinoic acid receptor γ (Rarg) and nuclear receptor subfamily 5, group A, member 2 (Nr5a2) promote conversion of fibroblasts to functional neurons. J. Biol. Chem. 289, 6415–6428 [DOI] [PMC free article] [PubMed] [Google Scholar]
- 20. Gheldof A., Hulpiau P., van Roy F., De Craene B., and Berx G. (2012) Evolutionary functional analysis and molecular regulation of the ZEB transcription factors. Cell. Mol. Life Sci. 69, 2527–2541 [DOI] [PMC free article] [PubMed] [Google Scholar]
- 21. Liu Y., El-Naggar S., Darling D. S., Higashi Y., and Dean D. C. (2008) Zeb1 links epithelial-mesenchymal transition and cellular senescence. Development 135, 579–588 [DOI] [PMC free article] [PubMed] [Google Scholar]
- 22. Fu J., Lv X., Lin H., Wu L., Wang R., Zhou Z., Zhang B., Wang Y. L., Tsang B. K., Zhu C., and Wang H. (2010) Ubiquitin ligase cullin 7 induces epithelial-mesenchymal transition in human choriocarcinomaok;1 cells. J. Biol. Chem. 285, 10870–10879 [DOI] [PMC free article] [PubMed] [Google Scholar]
- 23. Zhang P., Sun Y., and Ma L. (2015) ZEB1: At the crossroads of epithelial-mesenchymal transition, metastasis and therapy resistance. Cell Cycle 14, 481–487 [DOI] [PMC free article] [PubMed] [Google Scholar]
- 24. Arima Y., Hayashi H., Sasaki M., Hosonaga M., Goto T. M., Chiyoda T., Kuninaka S., Shibata T., Ohata H., Nakagama H., Taya Y., and Saya H. (2012) Induction of ZEB proteins by inactivation of RB protein is key determinant of mesenchymal phenotype of breast cancer. J. Biol. Chem. 287, 7896–7906 [DOI] [PMC free article] [PubMed] [Google Scholar]
- 25. Berx G., Raspe E., Christofori G., Thiery J. P., and Sleeman J. P. (2007) Pre-EMTing metastasis? Recapitulation of morphogenetic processes in cancer. Clin. Exp. Metastasis 24, 587–597 [DOI] [PubMed] [Google Scholar]
- 26. Yang J., and Weinberg R. A. (2008) Epithelial-mesenchymal transition: At the crossroads of development and tumor metastasis. Dev. Cell 14, 818–829 [DOI] [PubMed] [Google Scholar]
- 27. Ren J., Chen Y., Song H., Chen L., and Wang R. (2013) Inhibition of ZEB1 reverses EMT and chemoresistance in docetaxel-resistant human lung adenocarcinoma cell line. J. Cell. Biochem. 114, 1395–1403 [DOI] [PubMed] [Google Scholar]
- 28. Sánchez-Tilló E., de Barrios O., Siles L., Cuatrecasas M., Castells A., and Postigo A. (2011) β-catenin/TCF4 complex induces the epithelial-to-mesenchymal transition (EMT)-activator ZEB1 to regulate tumor invasiveness. Proc. Natl. Acad. Sci. U.S.A. 108, 19204–19209 [DOI] [PMC free article] [PubMed] [Google Scholar]
- 29. Pirinen E., and Soini Y. (2014) A survey of zeb1, twist and claudin 1 and 4 expression during placental development and disease. Acta Pathol. Microbiol. Immunol. Scand. 122, 530–538 [DOI] [PubMed] [Google Scholar]
- 30. Shin J. O., Nakagawa E., Kim E. J., Cho K. W., Lee J. M., Cho S. W., and Jung H. S. (2012) miR-200b regulates cell migration via Zeb family during mouse palate development. Histochem. Cell Biol. 137, 459–470 [DOI] [PubMed] [Google Scholar]
- 31. Bellon E., Luyten F. P., and Tylzanowski P. (2009) δ-EF1 is a negative regulator of Ihh in the developing growth plate. J. Cell Biol. 187, 685–699 [DOI] [PMC free article] [PubMed] [Google Scholar]
- 32. Gubelmann C., Schwalie P.C., Raghav S.K., Röder E., Delessa T., Kiehlmann E., Waszak S.M., Corsinotti A., Udin G., Holcombe W., Rudofsky G., Trono D., Wolfrum C., Deplancke B. (2014) Identification of the transcription factor ZEB1 as a central component of the adipogenic gene regulatory network. eLIFE 3, e03346. [DOI] [PMC free article] [PubMed] [Google Scholar]
- 33. Zhang P., Wei Y., Wang L., Debeb B. G., Yuan Y., Zhang J., Yuan J., Wang M., Chen D., Sun Y., Woodward W. A., Liu Y., Dean D. C., Liang H., Hu Y., Ang K. K., Hung M. C., Chen J., and Ma L. (2014) ATM-mediated stabilization of ZEB1 promotes DNA damage response and radioresistance through CHK1. Nature Cell Biol. 16, 864–875 [DOI] [PMC free article] [PubMed] [Google Scholar]
- 34. Darling D. S., Stearman R. P., Qi Y., Qiu M.-S., and Feller J. P. (2003) Expression of Zfhep/δEF1 protein in palate, neural progenitors, and differentiated neurons. Gene Expr. Patterns 3, 709–717 [DOI] [PMC free article] [PubMed] [Google Scholar]
- 35. Sabourin J. C., Ackema K. B., Ohayon D., Guichet P. O., Perrin F. E., Garces A., Ripoll C., Charité J., Simonneau L., Kettenmann H., Zine A., Privat A., Valmier J., Pattyn A., and Hugnot J. P. (2009) A mesenchymal-like ZEB1(+) niche harbors dorsal radial glial fibrillary acidic protein-positive stem cells in the spinal cord. Stem Cells 27, 2722–2733 [DOI] [PubMed] [Google Scholar]
- 36. Thoma E. C., Wischmeyer E., Offen N., Maurus K., Sirén A. L., Schartl M., and Wagner T. U. (2012) Ectopic expression of neurogenin 2 alone is sufficient to induce differentiation of embryonic stem cells into mature neurons. PloS One 7, e38651. [DOI] [PMC free article] [PubMed] [Google Scholar]
- 37. Kim T., Veronese A., Pichiorri F., Lee T. J., Jeon Y. J., Volinia S., Pineau P., Marchio A., Palatini J., Suh S. S., Alder H., Liu C. G., Dejean A., and Croce C. M. (2011) p53 regulates epithelial-mesenchymal transition through microRNAs targeting ZEB1 and ZEB2. J. Exp. Med. 208, 875–883 [DOI] [PMC free article] [PubMed] [Google Scholar]
- 38. Jiang H., Xu Z., Zhong P., Ren Y., Liang G., Schilling H. A., Hu Z., Zhang Y., Wang X., Chen S., Yan Z., and Feng J. (2015) Cell cycle and p53 gate the direct conversion of human fibroblasts to dopaminergic neurons. Nat. Commun. 6, 10100. [DOI] [PMC free article] [PubMed] [Google Scholar]
Associated Data
This section collects any data citations, data availability statements, or supplementary materials included in this article.


