

Abstract
H-Ras, K-Ras, and N-Ras are small GTPases that are important in the control of cell proliferation, differentiation, and survival, and their mutants occur frequently in human cancers. The G-domain, which catalyzes GTP hydrolysis and mediates downstream signaling, is 95% conserved between the Ras isoforms. Because of their very high sequence identity, biochemical studies done on H-Ras have been considered representative of all three Ras proteins. We show here that this is not a valid assumption. Using enzyme kinetic assays under identical conditions, we observed clear differences between the three isoforms in intrinsic catalysis of GTP by Ras in the absence and presence of the Ras-binding domain (RBD) of the c-Raf kinase protein (Raf-RBD). Given their identical active sites, isoform G-domain differences must be allosteric in origin, due to remote isoform-specific residues that affect conformational states. We present the crystal structure of N-Ras bound to a GTP analogue and interpret the kinetic data in terms of structural features specific for H-, K-, and N-Ras.
Keywords: allosteric regulation, conformational change, enzyme catalysis, enzyme structure, oncogene, Ras protein
Introduction
The Ras isoforms, K-Ras4B (referred to here as K-Ras), N-Ras, and H-Ras are GTPases that play key roles as regulators of signal transduction pathways involved in cell growth, differentiation, migration, and apoptosis (1). All Ras proteins are anchored to the membrane via post-translational modifications at their C-terminal hypervariable regions (HVR)3 that guide localization into distinct membrane compartments (2, 3). The catalytic domain, consisting of residues 1–166, actively propagates signaling when bound to GTP and is inactive when bound to GDP, with the P-loop (residues 10–17), switch I (residues 30–40), and switch II (residues 60–76) forming the active site for GTP hydrolysis, as well as an interaction surface for different effectors and regulators (4). The catalytic domain comprises two lobes (Fig. 1). The active site structural elements are found within the first half of the catalytic domain (residues 1–86), referred to as the effector lobe, which is 100% identical in sequence between the Ras isoforms (5, 6). The effector lobe contains three of the five highly conserved motifs found in small GTPases (7, 8). The backbone amides of the P-loop (GXXXXGK(S/T)) interact with the α- and β-phosphates of the nucleotide, whereas Thr-35 and residues 57–60 of the DXXG motif are important for Mg2+ coordination (9, 10).
Figure 1.
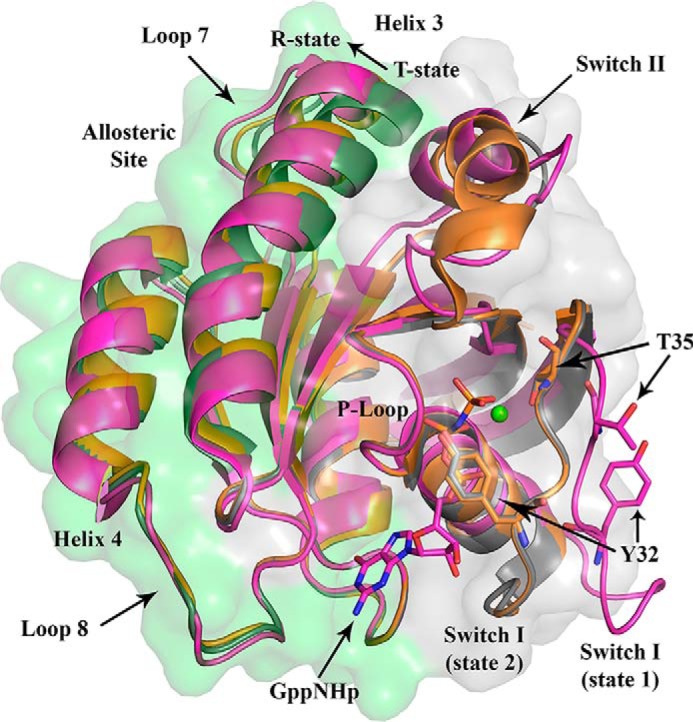
Catalytic G-domain of Ras showing the two lobes and conformational states. Three models are superimposed: H-Ras with switch I in state 1 and the allosteric switch (helix 3/loop 7) in the R state (magenta, PDB code 4EFL); H-Ras with switch I in state 2 and the allosteric switch in the T state (gray, PDB code 2RGE); and H-Ras with switch I in state 2 and the allosteric switch in the R state (orange, PDB code 3K8Y). The effector lobe is shaded in gray, and the allosteric lobe is shaded in green. Tyr-32, which is close to the γ-phosphate of the nucleotide, and Thr-35, which interacts with the Mg2+ ion when switch I is in state 2, are both turned away from the active site in state 1. The conformational change in going from T state to R state is indicated by an arrow. In the T state, helix 3 clashes with switch II, promoting a disordered conformation, whereas in the R state there is room for the switch II helix to form.
On the opposite side of the G-domain is the allosteric lobe, comprising the second half of the catalytic domain (residues 87–166). The allosteric lobe contains the NKXD (residues 116–119) motif responsible for the specificity of the guanine nucleotide (11), and the EXSAK (residues 143–147) motif, aided by effector lobe residue Phe-28, helps to stabilize nucleotide binding. The allosteric lobe contains hot spots of protein–ligand interactions (5) that bind membrane components (12) and harbors all of the residue differences between the Ras G-domains, with sequence identity of 90% between allosteric lobes of the three Ras proteins.
The isoforms of Ras exist in a diverse ensemble of conformations, regulated by the nucleotide-bound state (13). In the GTP-bound state, switch I in the active site interconverts between open (state 1) and closed (states 2) conformations (Fig. 1), as assessed by NMR (14, 15). States 1 and 2 are associated with different biochemical activities, and the equilibrium between these states differs among small GTPases (15, 16). State 1 favors nucleotide exchange but inhibits interaction with effector proteins (16). In contrast, state 2 is associated with effector binding and GTP hydrolysis (15).
In the Ras–Raf-RBD complex, with switch I stabilized in state 2, switch II can attain two states corresponding to catalytically incompetent (T state) and catalytically active (R state) conformations (Fig. 1) (17). The allosteric lobe contains an allosteric site that binds Ca2+ and a negatively charged ligand to promote a disorder to order transition in switch II through a shift in helix 3/loop 7 toward helix 4, placing Gln-61 at the catalytic center (18). We associate this ordered state with an increase in intrinsic hydrolysis in the presence of Raf (17, 19–21).
Regulation of the signaling state of Ras is a result of activation by guanine nucleotide exchange factors that catalyze the loading of GTP (22) and deactivation by GTPase-activating proteins (GAPs) that increase the GTPase activity of Ras (23). Although GAP is effective in complex with the wild-type Ras proteins, oncogenic mutants are insensitive to regulation by GAPs (24). Raf is a unique effector protein in that it interacts with Ras at switch I, but not switch II, and binds with nanomolar affinity (21, 25). In this context, switch II is free for allosteric modulation by Ca2+ binding in the allosteric site, and we hypothesize that this leads to specific regulation of intrinsic hydrolysis in the context of Raf signaling, a mechanism that is independent from regulation by GAPs (17–21, 26, 27). This scenario is consistent with the observation that binding of Raf-RBD to Ras fully inhibits GAP activity (28) and that GAP is generally a poor competitor of Ras–effector interactions (28, 29). We have experimentally linked allosteric modulation with signaling through the Ras/Raf/MEK/ERK pathway in NIH-3T3 cells and shown that GTP hydrolysis is completely abrogated in the Q61L oncogenic mutant in complex with Raf (19). It is clear that both GAP-catalyzed and intrinsic hydrolysis of GTP on Ras play important and unique roles in signal attenuation.
Little effort has been made to place the biochemical activities of the Ras isoforms in their individual contexts, and nearly all of the structural biology and biochemistry work has used H-Ras as a model for all three isoforms. In fact, there are no published crystal structures of wild-type K-Ras or N-Ras in the GTP-bound form, although there are structures of a few K-Ras oncogenic mutants bound to GTP analogues, a structure of N-Ras-GDP, and several structures of K-Ras and its mutants in the GDP-bound form, often bound to inhibitors of nucleotide exchange (30). This lack of structural information for wild-type K-Ras and N-Ras in the GTP-bound active state leaves H-Ras as the representative of all three isoforms for discerning mechanisms at the molecular level.
Early work on full-length H-Ras and N-Ras hinted at differences in intrinsic hydrolytic activity (31, 32). These results have received little attention, as the experimental studies were performed under diverse reaction conditions. More recently, molecular dynamics simulations of Ras in its nucleotide-free (6) and nucleotide-bound (33, 34) forms show that H-, K-, and N-Ras differ in their overall dynamics. However, the assumption that the identical active sites in the Ras isoforms leads to identical kinetics has prevailed, with an exclusive reliance on H-Ras for linking biochemical and structural properties.
Here, we present a systematic study of intrinsic hydrolytic reactivity of H-, K-, and N-Ras based on single-turnover experiments performed under the same conditions for the three wild-type isoforms alone and in the presence Raf-RBD. Determination of the hydrolysis rate constants for Ras loaded with radioactive GTP shows that there are significant differences in the biochemical activities between the isoforms. The rate constants for hydrolysis catalyzed by K-Ras and N-Ras are about one-third of that observed for H-Ras. Raf-RBD has little or no effect on hydrolysis for H-Ras and N-Ras, but it increases the rate constant for K-Ras to the value obtained for H-Ras. In addition to hydrolysis rate constants, we present the crystal structure of N-Ras in its GTP-bound state for a detailed comparison with H-Ras and K-Ras and test the effects on hydrolysis of specific mutants in the allosteric lobe that differ among the isoforms. Although we find that these point mutants do not significantly affect the GTP hydrolysis rate constant on H-Ras, we suggest key structural features that together may drive differences in allosteric modulation between the isoforms.
Results
Kinetics of GTP hydrolysis on H-, K-, and N-Ras in the absence and presence of Raf-RBD
Single-turnover experiments were performed to obtain rate constants for hydrolysis of GTP catalyzed by Ras, using a discontinuous assay based on the production of 32Pi, as described previously (27, 35). Briefly, Ras is loaded with [γ-32P]GTP (PerkinElmer Life Sciences); samples are removed from the reaction mixture at specific time points; the 32Pi product is isolated using an organic extraction method (36, 37), and the radioactivity is measured with a scintillation counter (300SL, LabLogic). All hydrolysis experiments were performed in triplicates. Combined experimental data, i.e. 32Pi product concentrations versus reaction time, were subjected to global nonlinear regression analysis (38) by using the software package DynaFit (39, 40). The data were fit to a single-step, first-order kinetic model represented by Equation 1, where Pi is the experimentally observed radioactive inorganic phosphate.
| (Eq. 1) |
The underlying system of first-order ordinary differential equations was automatically derived by the DynaFit software. See the supplemental data document for the raw data, details of the model, the DynaFit script, and the individual progress curves. Non-symmetrical confidence intervals for rate constants were determined by using the profile-t method of Bates and Watts at 68% confidence level, formally corresponding to 1 S.D. (41, 42).
The results are summarized graphically in Fig. 2. The numerical values of the rate constant, khyd, for each isoform in the absence and presence of Raf-RBD are given in Table 1. The khyd for H-Ras of 0.016 min−1 is very similar to previously published values (31, 32, 43), whereas khyd values for K-Ras and N-Ras are both 0.006 min−1, lower than expected. As observed previously, Raf-RBD does not affect the rate constant for H-Ras. This is also the case for N-Ras, with khyd remaining small. Surprisingly, Raf-RBD has a significant effect on the rate constant for K-Ras, with khyd increasing from 0.006 to 0.011 min−1, approaching the value obtained for H-Ras.
Figure 2.
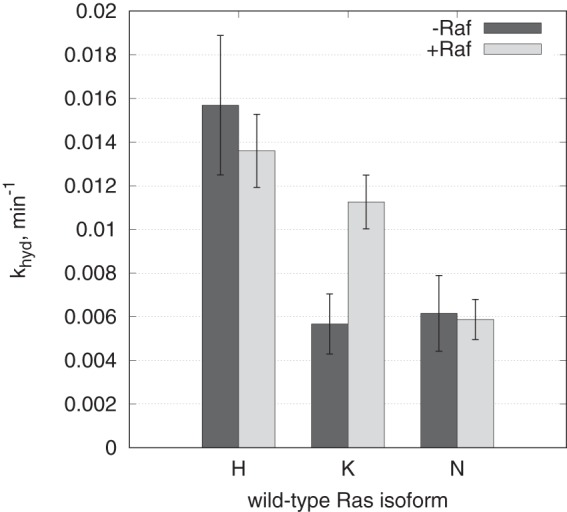
Single-turnover GTP hydrolysis experiments for H-Ras, K-Ras, and N-Ras conducted in the absence or in the presence of Raf-RBD. The vertical axis represents the single-turnover rate constant khyd: the dark gray and light gray bars correspond to the best-fit values from global fit of combined triplicate experiments in the absence of Raf-RBD and presence of Raf-RBD, respectively. The error bars are calculated as the “low” and “high” limits of nonsymmetrical confidence intervals at 68% confidence level. See supplemental data for the raw data and individual progress curves.
Table 1.
Results of single-turnover experiments
The low and high values are limits of nonsymmetrical confidence intervals (profile-t method of Bates and Watts (42)) at 68% confidence level.
| Isoform | 1000 × khyd | Low | High | t½ |
|---|---|---|---|---|
| min−1 | min | |||
| H-Ras | 16 ± 3 | 13 | 19 | 40 |
| K-Ras | 6 ± 1 | 4 | 7 | 120 |
| N-Ras | 6 ± 2 | 4 | 8 | 120 |
| H-Ras + Raf | 14 ± 2 | 12 | 15 | 50 |
| K-Ras + Raf | 11 ± 1 | 10 | 13 | 60 |
| N-Ras + Raf | 6 ± 1 | 5 | 7 | 120 |
| H-RasQ95L | 19 ± 3 | 17 | 22 | 40 |
| H-RasH166Y | 19 ± 1 | 18 | 20 | 40 |
| H-RasY141F | 15 ± 1 | 14 | 16 | 50 |
To check the binding capacity of Raf-RBD to each Ras isoform, we used isothermal titration calorimetry (ITC) to measure the affinity and thermodynamic parameters of the interaction between H-Ras, K-Ras, and N-Ras with Raf-RBD (Table 2). The ΔG0 value of −9.59 ± 0.03 kJ/mol obtained for complex formation between H-Ras and Raf-RBD agrees very well with the previously published value of −9.6 ± 0.2 kcal/mol (44), and the stoichiometry of the interaction was 1.02 ± 0.02, as expected. The Kd of 94 ± 4 nm agrees well with the previously published values of 88 nm (44) and 80 nm (45). The differences observed in both ΔH0 and TΔS0 values across the literature can be attributed most likely to differences in Tris versus HEPES buffer protonation enthalpies, and this issue has been extensively discussed elsewhere (44, 45). For the K-Ras and Raf-RBD interaction, the Kd is 98 ± 2 nm. This and all other thermodynamic parameters obtained for the interaction between K-Ras and Raf-RBD are similar to those obtained for H-Ras, with a nearly identical ΔG0 of −9.56 kJ/mol. The N-Ras–Raf-RBD interaction has a lower affinity, with Kd of 205 ± 8 nm, very similar ΔH0 values, but lower ΔS0, implying that binding between N-Ras and Raf-RBD is less entropically favorable than for the other two isoforms.
Table 2.
Thermodynamic quantities measured by isothermal titration calorimetry for binding of H-, K-, and N-Ras to Raf-RBD
Errors are from triplicate experiments.
| H-Ras | K-Ras | N-Ras | |
|---|---|---|---|
| Ka (106 m−1) | 10.7 ± 0.5 | 10.2 ± 0.2 | 4.7 ± 0.2 |
| Kd (nm) | 94 ± 4 | 98 ± 2 | 206 ± 8 |
| n | 1.02 ± 0.02 | 0.97 ± 0.08 | 0.91 ± 0.01 |
| ΔS (J mol/K) | 102 ± 4 | 99 ± 4 | 91.4 ± 1.9 |
| ΔH (kcal/mol) | −2.3 ± 0.3 | −2.6 ± 0.3 | −2.6 ± 0.1 |
| ΔG (kcal/mol) | −9.59 ± 0.03 | −9.56 ± 0.01 | −9.12 ± 0.03 |
Crystal structure of wild-type N-Ras bound to the GTP analogue GppNHp
To correlate our kinetic data with Ras structural features, we first identified specific locations of isoform variation in H-, K-, and N-Ras. A direct comparison of G-domain sequences shows that there are 17 residue positions in the allosteric lobe that differs in at least one of the three isoforms and that they cluster near the highly conserved nucleotide-binding NKXD and EXSAK motifs characteristic of small GTPases (46), as well as on helix 3 (Fig. 3a). Of these 17 residues in the allosteric lobe, 9 of them (53%) are unique to N-Ras, 7 (41%) are unique to H-Ras, and only 5 (29%) are unique to K-Ras.
Figure 3.

Amino acid sequence differences between H-, K-, and N-Ras. a, sequences of the three Ras isoforms are shown, numbered every 10 residues. Amino acid residues common to H-, K-, and N-Ras are in black. Residues that are different in any isoform are shown in green in the H-Ras sequence (top row). Residues in K-Ras that are the same as in H-Ras are shown in green in the K-Ras sequence, and those that are different from H-Ras are shown in yellow (middle row). Residues in N-Ras that are the same as in H-Ras are shown in green, and those that are the same as in K-Ras are shown in yellow, and those that are unique to N-Ras are in cyan (bottom row). The G elements found in all GTPases are shown in red with boxes above the Ras sequences labeled G1–G5. In the effector lobe, G1 is the P-loop; G2 is switch I; and G3 is switch II. In the allosteric lobe, G4 and G5 are the NKXD and EXSAK motifs, respectively, important for binding the guanine base of the nucleotide. b, amino acid differences mapped onto the three-dimensional structure of Ras. Left, K-Ras structure (PDB code 3GFT) with color scheme as shown for the sequence of K-Ras in a. Right, N-Ras structure (PDB code 5UHV, presented here) with color scheme as shown for the sequence of N-Ras in a.
In H-Ras, residue differences cluster at residues 121–122 (loop 8) and 126–128 (helix 4). In N-Ras the differences cluster at residues 94–95 (helix 3) and 131–132 (helix 4). In contrast, K-Ras lacks two or more consecutive sequence variations, with its five unique residues dispersed throughout the allosteric lobe (residues 95, 107, 122, 153, and 165). Interestingly, there are only two positions that differ in all three isoforms: residue 95 in helix 3 and residue 122 in loop 8. By mapping these sequence variations onto the respective isoforms in Fig. 3b, it becomes clear that the isoform differences cluster architecturally around the conserved allosteric site that we propose modulates hydrolysis in the presence of Raf (helix 3, loop 7, and helix 4) (19, 21) and the NKXD and EXSAK motifs that directly affect nucleotide binding (loop 8, helix 4 and helix 5) (10). The locations of these residues in relation to the allosteric site and active-site motifs implicate these regions as differentiating the kinetics we observed for H-, K-, and N-Ras isoforms.
A significant number of crystal structures of Ras and its mutants have been deposited in the PDB (13, 47). However, to correlate the kinetic differences with structural features it is desirable to compare crystal structures of each of the isoforms in their active GTP, or GTP-analogue, states. Although we could find such structures of H-Ras and K-Ras in the PDB, the only available crystal structure of N-Ras is bound to GDP. We therefore solved the crystal structure of the G-domain of N-Ras bound to the GTP analogue GppNHp (Table 3). N-Ras-GppNHp crystallized with symmetry of the P3221 space group, with similar packing as H-Ras-GppNHp in the same crystal form (PDB code 1CTQ) (48). We use our N-Ras structure as the basis for comparison with the structures of H- and K-Ras in the GTP-bound form.
Table 3.
Data collection and refinement statistics for wild type N-Ras bound to GppNHp
| Wavelength (Å) | 1.54 |
| Resolution range (Å) | 28.5–1.67 (1.73–1.67)a |
| Space group | P3221 |
| Unit cell | |
| a, b, c (Å) | 30.01, 39.01, 159.2 |
| α, β, γ (°) | 90, 90, 120 |
| Total reflections | 17,229 (1459)a |
| Unique reflections | 195,722 |
| Multiplicity | 11.4 |
| Completeness (%) | 98.7 (87.7)a |
| Mean I/σ | 24.0 (1.31)a |
| Wilson B factor | 26.4 |
| Rmerge | 0.079 |
| Rwork (%) | 18.8 (26.8)a |
| Rfree (%) | 22.8 (30.6)a |
| No. of non-hydrogen atoms | 1434 |
| Macromolecules | 1281 |
| Ligands | 33 |
| Water | 120 |
| Protein residues | 166 |
| Root mean square (bonds) | 0.007 |
| Root mean square (°) | 1.11 |
| Ramachandran favored (%) | 97 |
| Ramachandran outliers (%) | 0 |
| Clash score | 4.3 |
| B-factor (average) | 28.5 |
| Macromolecules | 27.7 |
| Ligands | 25.4 |
| Solvent | 36.7 |
a Parentheses refer to data in highest resolution shell.
The crystal structure of N-Ras-GppNHp has switch I ordered in the active site, with Tyr-32 interacting with the γ-phosphate of a neighboring symmetry-related molecule of N-Ras. The conformation of switch I is nearly identical to that in H-Ras (PDB code 1CTQ), as is the P-loop and N terminus of switch II (Fig. 4a). Interestingly, the nucleophilic water molecule (i.e. Wat-175 in H-Ras) (48) is not present in our structure, and the side chains of Gln-61, Glu-62, and Glu-63 are disordered. The N termini of switch II in N-Ras and H-Ras are very similar in the two structures, up to residue Tyr-64. Starting at residue 65, the backbone of switch II in N-Ras begins to adopt a more open conformation that is farther from helix 3 and different from H-Ras (Fig. 4b). Although Arg-68 is well ordered in the H-Ras structure and makes van der Waals interactions with Tyr-71, it is partially disordered in N-Ras where Tyr-71 is disordered and turned out toward the solvent. The side chains for residues 69–74 at the end of helix 2 in switch II are also disordered. The main chain atoms in the two structures converge again starting at residue 75. In agreement with a poorly ordered N-Ras switch II, helix 3 is shifted away from the allosteric site to favor the T state (Fig. 4). The shift to the T state in helix 3 toward switch II is also seen for K-Ras (data not shown). These observations are consistent with the drop in khyd for K- and N-Ras in our hydrolysis experiments, i.e. both N- and K-Ras appear to favor the T state more so than H-Ras.
Figure 4.

Comparison between N-Ras and H-Ras bound to GppNHp, both solved from crystals with symmetry P3221. a, active site shown with 2Fo − Fc electron density map for the N-Ras structure, contoured at the 1σ level. The model for N-Ras (PDB code 5UHV, presented here) is shown in cyan and that for H-Ras (PDB code 1CTQ) is in green. The three phosphorus atoms of GppNHp are shown in orange, and the nitrogen atom that bridges the β- and γ-phosphates is in blue. The nucleotide-binding residues are shown, including the P-loop, switch I, switch II, and NKXD and EXSAK motifs. The magnesium ion is shown as a green sphere, and the nucleophilic water molecule found in the H-Ras structure (Wat-175) is shown as a black sphere. b, T state to R state conformational differences are indicated with an arrow at the C-terminal end of helix 3. Differences are also found in loop 7 and switch II. Disordered side chains were omitted from the model. For example, the N-Ras Tyr-71 side chain is represented up to the Cβ atom. The superposition of N-Ras and H-Ras was based on the nucleotide.
Isoform-specific residues near the allosteric site
The allosteric switch centers on interactions between helix 3 and switch II (18) and appears to be modulated by isoform-specific residues. N-Ras residue Asn-94 forms an H-bond with Tyr-137 (2.8 Å), which is not seen with His-94 in the H-Ras structure with PDB code 1CTQ (48). This interaction in N-Ras creates a water network that is also seen in some structures of H-Ras (i.e. PDB code 3K8Y) (18), connecting Arg-97, Lys-101, and Glu-98 together in the allosteric site (Fig. 5a). The two conformations that have been observed for His-94 in H-Ras allow either interaction with Tyr-137, whereas Glu-98 makes a salt bridge to Lys-101 as observed for Asn-94 in the N-Ras structure, or with Glu-98, in which case His-94 sequesters Glu-98 from making the salt bridge with Lys-101 (Fig. 5a). Residue 94 is also a histidine in K-Ras, and in the structure with PDB code 3GFT (Structural Genomics Consortium) it is in an intermediate position between those described for H-Ras and N-Ras. It is likely the case that the two conformations are accessible but populated differently in the three isoforms.
Figure 5.

Superposition of N-Ras with H-Ras and K-Ras showing areas associated with the allosteric site and switch II. The color scheme in the lower right panel is shown for H-Ras (PDB code 1CTQ, green), K-Ras (PDB code 3GFT, yellow), and N-Ras (PDB code 5UHV, presented here) for clarity. Water molecules are shown in the color of their respective structures. Selected H-bonding interactions are shown as red dashed lines. a, allosteric site with contributing residues from helix 3, loop 7, helix 4, and helix 5 shown as sticks. b, interactions between residue 166 (His in H-Ras and K-Ras and Tyr in N-Ras) and loop 7. c, residue 95 (Gln in H-Ras, His in K-Ras, and Leu in N-Ras) at the kink of helix 3 impacts the allosteric site through residue 94 (His in H-Ras and K-Ras and Asn in N-Ras) and switch II through Tyr-96.
Both helix 3 and loop 7 are shifted toward switch II in N-Ras, and residue Tyr-166, a residue unique to this isoform, appears to play a role in stabilizing this T state conformation (Fig. 5b). In wild-type H-Ras, His-166 forms peripheral H-bonds with the side chain and backbone of Asp-108, and it is often disordered in other crystal forms of H-Ras. The same situation is seen for K-Ras in the structures with PDB code 3GFT, in which residue 166 is also a histidine. Although Tyr-166 in N-Ras and His-166 in H- and K-Ras both have planar aromatic rings, the tyrosyl moiety reaches out closer to loop 7. Here, Tyr-166 forms a direct H-bond with Ser-106 instead of Asp-108. This new H-bond changes the interactions between helix 5 and loop 7, pushing loop 7, and by extension helix 3, toward switch II, a conformation characteristic of the T state.
Residue 95, which is a glutamine in H-Ras, a histidine in K-Ras, and a leucine in N-Ras, is uniquely positioned to influence the conformational states of residue 94 (Fig. 5c). For example, the Leu-95 residue in its most favored rotamer as found in the N-Ras structure sterically impedes the second conformation of Asn-94 due to its side-chain branch at Cγ. His-95 in K-Ras may do the same, although its polar side chain could be in a conformation where it H-bonds with polar or charged switch II residues. In contrast, the branch at Cδ for Gln-95 in H-Ras allows the dual conformation of His-94. Residue 95 also faces the N terminus of switch II, thereby providing an isoform-specific interaction surface between helix 3 and switch II, near the active site.
Impact on conserved nucleotide-binding motifs
A second area of isoform-specific residues is between the evolutionarily conserved NKXD (residues 116–119) and EXSAK (residues 143–147) motifs (8), located near the guanine moiety of GTP near the N termini of helix 3 and helix 4 (Fig. 3).
Toward the N terminus of helix 3, N-Ras has distinct residues at positions Ser-87 and Ala-91 compared with H-Ras and K-Ras, in which these residues are Thr-87 and Glu-91. In N-Ras, Ser-87 is found in a dual conformation that mimics the threonine conformer found in H- and K-Ras. In all three isoforms, residue 87 H-bonds with the backbone carbonyl and side-chain hydroxyl group of Thr-124 in loop 8 (Fig. 6a). This loop contains residues 116–125, including the conserved NKXD motif (116–119) followed by a number of isoform-specific sequence variations. Loop 8 leads to helix 4, whose first few residues (126–128, 131–132, and 135) also show sequence variation and are close to the EXSAK motif (Fig. 3). Loop 8 residues 121–122 are distinct between the isoforms (Fig. 6, a and b). Although proline at residue 121 in K- and N-Ras is likely to decrease the dynamics of loop 8, the conformation of loop 8 is overall similar to that seen for H-Ras with its alanine at residue 121. Loop 8 is exposed to solvent, and the hydroxyl-containing side chains of Ser-122 and Thr-122 in K- and N-Ras are expected to form more favorable solvent-related interactions as compared with Ala-122 in H-Ras.
Figure 6.

Superposition of H-Ras (green), K-Ras (yellow), and N-Ras (cyan) showing areas associated with the nucleotide-binding pocket with an impact on switch I. Water molecules are shown in the color of their respective structures. Selected H-bonding interactions are shown as red dashed lines. The NKXD and EXSAK motifs are highlighted in red, maintaining the ribbon diagram over the associated residues shown as sticks in the color of the particular isoforms. a, residue 87 (Thr in H-Ras and K-Ras and Ser in N-Ras) interaction with Thr-124 in loop 8 and the conserved guanine-binding residues. b, interaction between Arg-123 (loop 8) and Glu-143 (EXSAK motif), showing the effect of residues 141 (Tyr in H-Ras and Phe in K-Ras and N-Ras) on the salt bridge.
Loop 8 sequentially links β5 at the protein core to helix 4 (Figs. 3 and 6b). The side chain of Arg-123 extends between these two elements to make a salt bridge with Glu-143, from the EXSAK motif in β6, over loop 8 (Fig. 6b). This salt bridge links the nucleotide-binding motifs NKXD in loop 8 and EXSAK, thereby stabilizing the active site. Intriguingly, residue 141 appears to affect the geometry of interaction between Arg-123 and Glu-143. In H-Ras, the salt bridge is in ideal geometry with both nitrogen atoms of the Arg-123 guanidinium group and both oxygen atoms of the Glu-143 carboxylate forming a head-to-head interaction (Fig. 6b). Residue Tyr-141 hydroxyl group in this structure makes an H-bond with the side chain of Glu-143. In both K-Ras and N-Ras, residue 141 is a phenylalanine that sterically interacts with the carboxylate of the Glu-143 side chain. This interaction results in a shift of Glu-143 away from Phe-141, replacing a highly conserved water molecule found in H-Ras, such that only one of its side-chain oxygen atoms interacts with one of the nitrogen atoms of the Arg-123 guanidinium moiety (Fig. 6b). The other nitrogen atom interacts with a nearby water molecule that is H-bonded to the K-Ras- and N-Ras-specific residue Thr-127. Glu-143 is in crystal contacts in our N-Ras–GppNHp structure. However, it is unlikely that the position of Glu-143 is an artifact of the crystal packing, because the packing is the same in the H-Ras structure with PDB code 1CTQ (48). Furthermore, the shift in Glu-143 is also seen in K-Ras (PDB code 3GFT), which also contains Phe-141 and in which the crystal packing is different. The Glu-143 side chain, in the position found in N-Ras and K-Ras, displaces one of the highly conserved water molecules in the H-bonding network that links the active site to membrane-sensing residues in helix 5 (27). Importantly, all of the structures of H-Ras deposited in the PDB regardless of crystal form maintain the optimized salt bridge geometry, suggesting that this interaction is stable in H-Ras.
H-Ras point mutants do not have altered hydrolysis rate constants
Having identified areas of isoform-specific residues based on structural comparisons, we mutated H-Ras at three key residues discussed above to residues found in N-Ras, and the resulting rate constants were obtained by single-turnover experiments. Residues 95 on helix 3, 166 near the allosteric site, and 141 near the Arg-123–Glu-143 salt bridge were tested on H-RasQ95L, H-RasH166Y, and H-RasY141F mutants, respectively. The rate constants obtained from the single-turnover experiments are shown graphically in Fig. 7 and numerically in Table 1. The raw data with progress curves fitted to the first-order kinetic model are shown in the supplemental data. The rate constants of 0.019, 0.019, and 0.015 min−1 for H-RasQ95L, H-RasH166Y, and H-RasY141F, respectively, show a minimal effect, if any within the experimental error, compared with the rate constant of 0.016 min−1 obtained for wild-type H-Ras. Thus, although collectively these residues may contribute to the differences in rate constants observed for the isoforms, individually they do not significantly alter the rate constant for H-Ras. This supports the idea that isoform-specific residues play a role in the context of the collective residue differences in the allosteric lobe between the isoforms, rather than functioning in isolation to impact individual structural elements.
Figure 7.
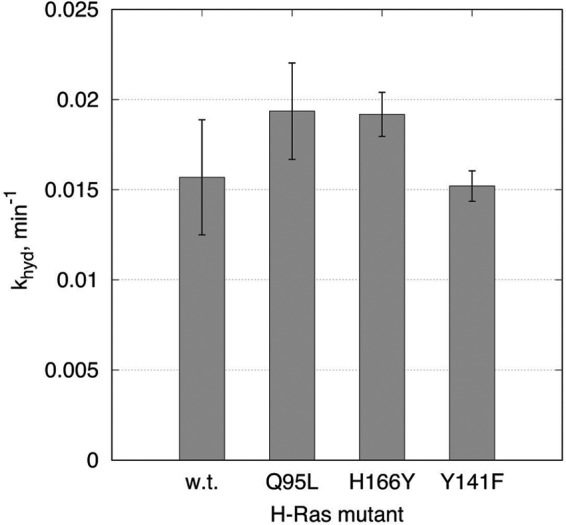
Single-turnover GTP hydrolysis experiments for H-RasQ95L, H-RasH166Y, and H-RasY141F conducted in the absence of Raf-RBD. The vertical axis represents the single-turnover rate constant khyd, with the bars corresponding to the best-fit value from global fit of combined triplicate experiments in the absence of Raf-RBD. The error bars are calculated as the low and high limits of non-symmetrical confidence intervals at 68% confidence level. See supplemental data for the raw data and individual progress curves.
Discussion
H-, K-, and N-Ras are biochemically distinct
We performed single-turnover experiments on H-Ras, K-Ras, and N-Ras using the natural substrate GTP, and we found that the isoforms show biochemical differences that have previously gone unappreciated.
Single-turnover experiments using Ras pre-loaded with some form of labeled GTP has been the norm in Ras enzymology for the past 2 decades (15, 19, 31, 32, 43, 49–62). Early work on the GTP hydrolysis catalyzed by H-Ras and to a lesser extent by N-Ras was performed by using 32P-labeled GTP at the γ-phosphate position, until the fluorescent N-methylanthraniloyl (mant) nucleotide derivatives became available in the early 1990s to measure the kinetics of hydrolysis and nucleotide exchange on Ras (63). These assays, dependent on the detection of fluorescence changes due to the microscopic environment of the mant probe, became the dominant strategy through which biochemical studies are performed to this day. However, the mant nucleotides have recently been shown by NMR to alter the active site environment in unpredictable ways (57). Therefore, the rate constants obtained using this method may not reflect the enzyme activity with GTP, as conformational states may be altered in subtle ways that affect hydrolysis. One could envision, for example, the mant moiety having a dominant effect, masking isoform differences and resulting in similar rate constants for the three Ras proteins. The progress of GAP-catalyzed hydrolysis of GTP bound to H-, K-, and N-Ras can be fitted to a single exponential, with higher rate constants, which were found to be similar between the three isoforms (49). The experiments used mant-GTP, which also affects GAP-catalyzed hydrolysis reactions (57), and it would be interesting to see if the results hold when using [γ-32P]GTP. Enzyme-coupled reactions provide an alternative (59, 60, 63, 64), but this method reports on GTPase product release rather than on cleavage of the phosphodiester bond (64, 65). In general, previously published studies on Ras hydrolysis are variable with respect to nucleotide pre-loading time, nucleotide identity, reaction temperature, and whether or not free nucleotide was removed prior to the reaction. Most importantly, they focus on one of the isoforms at a time, primarily H-Ras, with the assumption that results obtained for one of the isoforms are valid for the other two.
To determine first-order (exponential) rate constants with sufficient precision, it is important for the reaction progress curves associated with GTP hydrolysis to progress sufficiently past the initial quasi-linear region, such that the (exponential) curvature of the kinetic trace is clearly defined. In general, first-order exponential rate constants are determined with confidence when experimental kinetic traces progress to ∼2-fold past the half-life t½ = ln(2)/khyd (66). The original hydrolysis experiments published for H-Ras in the late 1980s used a [γ-32P]GTP discontinuous assay, referencing a 1983 paper on determination of GTP hydrolysis rate constants for EF-Tu, in which hydrolysis was carried out for 60 min with time points collected every minute (67). The rate constant for N-Ras was measured by a different group at the time using 3H instead of 32P to follow the reaction in a discontinuous assay for 250 min, with one time point measured at 360 min to determine that there was no longer any GTP, i.e. that the reaction had essentially gone to completion (32). This corresponds to about two half-lives for N-Ras at 37 °C. In our previous experiments with H-Ras, we collected hydrolysis data points for 100 min (18, 27), i.e. approximately two half-lives for this isoform. Here, we extended the experiments to 240 min, taking into account the lower hydrolytic rate constant for N-Ras. Given the rate constants with associated half-lives shown in Table 1, this represents 2 half-lives for N-Ras and K-Ras and 6 half-lives for H-Ras. In the presence of Raf-RBD, we collected data for 5, 4, and 2 half-lives for H-, K-, and N-Ras, respectively. Thus, we have confidence in our rate constants.
In this study, we used a radiometric assay adapted from earlier Ras literature (36, 37), where the substrate is GTP itself. We focus our analysis on single-turnover experiments, as this approach has been the standard for determination of intrinsic hydrolysis rate constants in the literature (15, 19, 31, 32, 43, 49–62). Our results show that H-Ras, K-Ras, and N-Ras are not biochemically identical. In addition to uncomplexed K-Ras and N-Ras being slower enzymes than H-Ras, Raf-RBD affects the catalytic reactivity of K-Ras but not of H-Ras or N-Ras. This highlights the fact that H-Ras cannot serve as a good model for the other two isoforms. Our kinetics results are in line with MD simulations of H-Ras, K-Ras, and N-Ras, which found K-Ras to be the most flexible of the isoforms, particularly at switch I (6), although more recent MD simulations by the same group found K-Ras to be less flexible (68). A greater flexibility of switch I in K-Ras is consistent with our results showing the effect of Raf-RBD stabilization of switch I on the hydrolysis rate constant.
Given the flexibility of the switch regions found for Ras-GTP in solution (69, 70), conformational changes preceding hydrolysis are likely to take place. Because the amino acid composition of the active site is identical for the three isoforms, protein dynamics and conformational rearrangements affected allosterically by isoform-specific residues is the most likely origin of the differences in rate constants we detect. If a Ras conformation with switch I in state 2 and switch II in the R state is necessary for hydrolysis to occur, then it is helpful to think of the rate constants as dependent on the frequency of this conformation in the ensemble of states. Our structural analysis suggests how isoform-specific residues in the allosteric lobe may contribute to the shift in the population of K-Ras and N-Ras away from its catalytic conformation relative to H-Ras, providing a rationale for their significantly lower rate constants.
Nature of the conformational change
By comparing the single-turnover reaction rate constants of the Ras isoforms alone and in the presence of Raf-RBD, we are able to obtain useful information about the nature of the conformational change that occurs for each isoform, because Raf-RBD binds switch I, bringing associated residues into a conformation that is optimal for catalysis. Thus, it is possible to determine the extent to which the state 1 to state 2 shift contributes to the overall reaction rate. State 1 is an open and non-catalytic conformation of switch I, whereas state 2 is a closed conformation necessary for hydrolysis (Fig. 1) (15, 16). Although state 2 is the dominant switch I conformation at equilibrium in the GTP-bound state of H-Ras (15), the equilibrium between the two states in K- and N-Ras has not yet been published. Because Raf-RBD does not affect the reaction rate constants for H-Ras or N-Ras, we conclude that the transition from state 1 to state 2 is not a limiting step for hydrolysis in these two isoforms. For K-Ras, however, state 2 stabilization through the interaction with Raf-RBD increases the rate constant to nearly the value obtained for H-Ras, supporting a rate-determining role for the state 1 to state 2 transition in K-Ras. Interestingly, K-Ras and H-Ras have very similar affinities for Raf-RBD, suggesting a low energy barrier for the transition between the two switch I conformational states in the presence of Raf. The affinity of N-Ras for Raf-RBD is about half of that observed for the other two isoforms. This implies that in N-Ras, the conformational transition necessary to attain a state 2 Raf-RBD-binding conformation is energetically costlier than in either H-Ras or K-Ras. Our ITC experiments determined that this is an entropic cost (Table 2).
There are several isoform-specific residues near the nucleotide-binding pocket that may play a role in the conformational transitions associated with the active site. One is Tyr-141 in H-Ras, and in K-Ras and N-Ras this residue is Phe-141. This combined with the presence of Pro-121 in these two isoforms may affect the configuration of the salt bridge between Arg-123 and Glu-143, which link the NKXD and EXSAK conserved active-site motifs. In N-Ras, the lower affinity for Raf-RBD may also have a contribution from Leu-95 in helix 3, which affects the conformation of switch II (18). Although the Raf-RBD binds only at switch I, the two switches are conformationally linked, with helix 3 and switch II driving the conformation of switch I (71).
Our single-turnover data are consistent with a state 1 to state 2 transition responsible for the lower rate constant in K-Ras compared with H-Ras. In N-Ras, this transition is not rate-limiting, because Raf-RBD stabilizes the state 2 conformation without any effect on the rate constant, which remains low. Therefore, unlike the situation for K-Ras, its lower rate constant must be due to conformational transitions elsewhere on the protein, perhaps including the above-suggested effect of Leu-95 on helix 3 and switch II. Interestingly, based on our crystal structures, the helix 3 conformation also appears to be influenced by residue 166, which is the bulkier Tyr-166 in N-Ras but is His-166 in H-Ras and K-Ras. N-Ras Tyr-166 pushes into loop 7, which could help stabilize the kink of helix 3 toward switch II that is essential to the T state conformation (Figs. 4b and 5b). This is not observed in the H-Ras–GppNHp structure in the same crystal form (PDB code 1CTQ) (48), which is found in the R state. A population shift toward the T state would mean that the catalytic conformation is accessed more rarely in N-Ras than in H-Ras and K-Ras, consistent with a smaller N-Ras rate constant in the presence of Raf-RBD. The interactions between His-94/Asn-94 and Glu-98 (which is sequestered from forming a salt bridge with Lys-101) or between His-94/Asn-94 and Tyr-137 (in which case Glu-98 interacts with Lys-101) (Fig. 5a) provide a mechanism for linking the allosteric site, helix 3, switch II, and switch I in different ways and may also contribute to the differences in rate constants observed for H-, K-, and N-Ras. It is important to stress that these proposed residue contributions to the differences in rate constants between the isoforms occur within the context of multiple isoform-specific residues, as our H-Ras point mutant experiments show no significant effects on the rate constant.
Overall, the fact that binding of Raf-RBD does not affect the hydrolysis rate constants for H-Ras and N-Ras suggests that conformational transitions other than state 1 to state 2 must be rate-limiting for these isoforms. These conformational transitions are much slower for N-Ras than for H-Ras as reflected in their relative rate constants. For K-Ras, once switch I is in state 2, the other conformational transitions occur at similar rates to those in H-Ras, as indicated by their similar rate constants in the presence of Raf-RBD.
H-bonding networks linking effector and allosteric lobes modulate isoform-specific behavior
Ras in its GTP-bound form is a flexible molecule capable of accessing a range of conformational states, particularly with respect to switch I and switch II regions that form the active site (70). These, in turn, are linked to the isoform-specific allosteric lobe through networks of communication that lead to functionally significant areas associated with the membrane and with dimerization to activate Raf (18, 27, 30, 72). Critical elements of the networks involving the switch regions are conserved, implying that these mechanisms are common to the three isoforms. However, they are modulated differently by surrounding residues in H-, K-, and N-Ras, leading to differences in dynamics (6, 34) and kinetics of GTP hydrolysis as observed in this study. These differences are also likely to impact dimerization and the way in which the G-domain interacts with the membrane, modulating interactions specific to each isoform (12). They could impact isoform-specific biological functions in ways that have not yet been determined (73).
Switch I connects to nucleotide-sensing residues in helix 5 through Cys-118, the X residue in the NKXD motif conserved across small GTPases, where Asp-119 makes nucleotide-specific interactions with the guanine base and is critical for nucleotide binding (Fig. 6a) (34). Cys-118 is linked to Glu-143 in the EXSAK motif through a water molecule that is highly conserved in Ras structures bound to GTP analogues (27), and from Glu-143, the water-mediated network continues on to the helix 5 residues. Thus, Cys-118 and Glu-143 are critical elements in the water-mediated network of communication between switch I and nucleotide-sensing residues in helix 5, and they are adjacent to residues that directly interact with the nucleotide. These two highly conserved elements are linked through loop 8 and helix 4, two of the most variable regions between the Ras isoforms (Fig. 3A), opening possibilities for isoform-specific variations in active-site conformations. The fact that Glu-143 links switch I to helix 5 residues, coupled with its interaction with Arg-123 in loop 8 as part of stabilizing the SAK residues at the nucleotide-binding site, explains the strictly conserved nature of Glu-143 across all GTPases. We have shown that perturbing the Arg-123–Glu-143 salt bridge in H-Ras by mutation of Tyr-141 to Phe does not by itself affect the hydrolysis rate constant for H-Ras. However, we propose that the isoform-specific variations found in loop 8 and helix 4, as well as at residue 141, collectively impact the nucleotide exchange reaction and the population of conformational states associated with switch I.
The switch II conformation is modulated by an allosteric mechanism through which it is linked to a Ca2+-binding site in the allosteric lobe, promoting the shift in helix 3 and loop 7 toward helix 4, characteristic of the T to R transition necessary for ordering switch II residues for GTP hydrolysis (Fig. 1) (17). The shift to the R state involves straightening the kink in helix 3 that is present in the T state around residues 90–95, where the H-bond between the carbonyl group of residue 90 and the amide of residue 94 is disrupted. This is precisely at another hot spot of Ras isoform-specific differences (Fig. 3), poised to affect the network of communication between switch II and the allosteric site. We have identified residue differences at positions 94 and 95 and propose that their local interactions affect the conformational equilibrium between T and R states associated with enzyme catalysis (Fig. 5c). In N-Ras, further stabilization of the non-catalytic T state appears to be aided by Tyr-166 as discussed above. It is intriguing, but not surprising, that residue 95, adjacent to the helix 3 kink, and residue 122, adjacent to the Arg-123 salt bridge, are the two positions in Ras where residues are different in all three isoforms.
The Ras allosteric networks are joined at the active site, where they affect each other through the interdependence previously established between switch I and switch II (71). Thus, although described here through local interactions, the effects of isoform-specific differences are global, and at least in terms of affecting hydrolysis rate constants, they likely occur in the context of multiple sites.
We have shown here that the isoform-specific sequences in the allosteric lobe have an impact on GTP hydrolysis and interaction with an effector protein, which must be due to allosteric effects on dynamics and conformational states, given the identical active sites. Although it is not currently possible to directly link the unique hydrolysis rate constants to biological function in the cell, these differences are likely to contribute to the higher level of complexity emerging from current studies in the Ras field. A significant population of state 1 on K-Ras, for example, could facilitate regulation by the positively charged C-terminal HVR as proposed previously (74), whereas the low hydrolysis rate constants observed for N-Ras in the presence of Raf-RBD might contribute to sustained signaling through the MAPK pathway in skin legions (75).
As a corollary to the differences we have observed between the three isoforms of Ras, it is likely that oncogenic mutants affect the H-, K-, and N-Ras functions in significantly different ways within the contexts of their isoform-specific sequences, structures, and dynamics. It is not sufficient to study each mutant within its local context in the active site. We have already shown that the Q61L mutant profoundly affects the dynamics of the entire H-Ras–Raf-RBD complex (21). It is likely that localization and other large-scale biological contexts play a significant role in the selection of particular mutations in the Ras isoforms associated with specific cancers (76), but it is now clear that conformational states at the active site are affected by sequence at the molecular level in a global scale, with great sensitivity to any changes that perturb the finely tuned equilibrium of conformational states inherent in each of the Ras isoforms.
Experimental procedures
Protein expression and purification
Hydrolysis and crystallization experiments were performed using the catalytic G-domain (residues 1–166) of human H-, K-, and N-Ras (EC 3.6.5.2). Protein expression and purification of wild-type Ras isoforms was performed as described for H-Ras (27, 77), with no modifications for K-Ras or N-Ras. The Ras proteins were stored at −80 °C for hydrolysis experiments in their GDP-bound state (78). For crystallization of N-Ras, GDP was exchanged for the GTP analogue GppNHp, using methods previously described (26, 77), and concentrated to 3.5 mg/ml before storage at −80 °C. In all cases, the purified proteins were flash-frozen in 25–55-μl aliquots. Protein concentrations for biochemical experiments were determined using the Bradford assay just prior to use (79).
For purification of the RBD (residues 51–131) of the c-Raf kinase (EC 2.7.11.1), Escherichia coli BL21 cells transfected with DNA coding for Raf-RBD in the pET21 vector system were grown in Luria Broth (LB) containing ampicillin (50 mg/lite) at 37 °C, and protein was expressed using 0.5 mm isopropyl 1-thio-β-d-galactopyranoside at 37 °C for 4 h. Pellets were thawed and solubilized in buffer A (20 mm HEPES, pH 7.0, 20 mm NaCl, 1 mm DTT) with standard protease inhibitors. Solubilized cells were sonicated and subjected to a 0.02% v/v polyethyleneimine bulk cut on ice. After polyethyleneimine precipitation, the protein sample was clarified again using centrifugation and syringe filtered with a 0.45-μm membrane before use in chromatography. The protein was purified by cation-exchange and size-exclusion chromatography, in that order, using an ÄKTA FPLC system (GE Healthcare). Cation exchange was done using a HiPrepTM SPFF column pre-equilibrated with buffer A, and elution was performed using a 0–70% buffer B (same as buffer A but with 1 m NaCl). Size-exclusion chromatography was run in 20 mm HEPES, pH 7.5, 50 mm NaCl, and 20 mm MgCl2. Pure Raf-RBD was pooled and concentrated to 8–11 mg/ml, flash-frozen in 55-μl aliquots, and stored at −80 °C. Protein purity was assessed using 15% SDS-polyacrylamide gel.
Intrinsic hydrolysis experiments
Single-turnover experiments were performed for the truncated H-, K-, N-Ras, alone and in the presence of 5-fold molar excess Raf-RBD (27, 36, 37). Given the high affinities shown in Table 2, this should result in all of the Ras proteins bound to Raf-RBD. Briefly, 5 μm Ras-GDP was incubated with 50 nm [γ-32P]GTP (PerkinElmer Life Sciences) in the presence of 1 mm EDTA for 5 min. The reaction was started by addition of 4 μl of this protein solution to 16 μl of hydrolysis buffer containing 20 mm Tris, pH 8.0, 100 mm NaCl, 5 mm MgCl2, 2 mm DTT, at 37 °C, with Ras and [γ-32P]GTP at final concentrations of 1 μm and 10 nm, respectively.
To allow sufficient reaction time, such that the exponential shape of reaction progress curves became sufficiently developed, single-turnover hydrolysis experiments were performed by collecting experimental data up to tmax = 300 min, at the following time points: 0, 5, 10, 15, 20, 25, 30, 35, 40, 60, 75, 90, 120, 150, 180, 210, 240, and 300 min. However, the t = 300-min data points were excluded from analysis, because of excessive experimental noise. The 32Pi product was isolated using an organic extraction method (36, 37), and the radioactivity was measured with a scintillation counter (300SL, LabLogic). The khyd values correspond to best-fit values from global fit (38) of combined triplicate experiments. Details are found in the supplemental data.
The single-turnover experiments were performed both in the absence and in the presence of Raf-RBD for the wild-type isoforms, but only in the absence of Raf-RBD for the H-Ras mutants. Each set of experiments was performed on 3 different days, with each day focused on one of the triplicates for H-, K-, and N-Ras (for the wild-type isoforms) or H-RasQ95L, H-RasH166Y, and H-RasY141F (for the mutants) performed side by side.
Isothermal titration calorimetry measurements of Ras isoforms in the presence of Raf-RBD
Thermodynamic properties of the Ras–Raf-RBD interaction were measured using a low volume isothermal titration calorimeter (Nano ITC, TA Instruments). H-, K-, and N-Ras and Raf-RBD were extensively dialyzed into filtered and degassed buffer containing 50 mm HEPES, pH 7.5, 150 mm NaCl, 5 mm MgCl2, 0.5 mm tris(2-carboxyethyl)phosphine, and 0.05% n-octyl β-d-glucopyranoside. Protein concentrations were calculated using an average of absorbance at 280 nm (A280) for accuracy. In all measurements, 300 μl of 30–80 μm of the appropriate Ras isoform was placed in the cell and titrated with Raf-RBD at an ∼10-fold higher concentration to achieve saturation. Because Ras and Raf-RBD interact with a 1:1 stoichiometry, the reverse experiment of 30–80 μm Raf-RBD titrated with ∼10-fold Ras was also conducted for each isoform to ensure data accuracy in the determined thermodynamic values. The background heat produced by ligand titration into buffer alone was subtracted from each titration experiment. All binding experiments were performed in triplicate.
Data analysis was conducted via manufacturer software (NanoAnalyze, TA Instruments) to give the stoichiometry (n), association constant (Ka), and enthalpy change (ΔH0) for the Ras–Raf-RBD interaction. The dissociation constant (Kd) was determined as the inverse of Ka. Total free energy change (ΔG0) upon complex formation can be calculated from the thermodynamic relationship ΔG0 = −RT lnKa, whereas the entropy change upon binding is dependent on the relationship ΔG0 = ΔH0 − TΔS0. These values allow for complete thermodynamic characterization of the interaction between each Ras isoform G-domain and Raf-RBD in solution.
Crystallization, data collection, and structure refinement for wild-type N-Ras-GppNHp
Purified N-Ras–GppNHp stored at −80 °C in 20 mm HEPES, pH 7.5, 50 mm NaCl, 20 mm MgCl2, and 1 mm DTT at a concentration of 3.5 mg/ml was thawed in ice. Crystals were grown using the hanging drop vapor diffusion method in 24-well plates with drops of 1.5 μl of protein and 1.5 μl of reservoir solution. The reservoir contained 200 μl of 0.2 m magnesium acetate tetrahydrate, 0.1 m sodium cacodylate trihydrate, pH 6.5, 20% w/v PEG 8000 (Hampton Research Crystal Screen number 18). Crystals were grown for 1 week at 18 °C and cryoprotected in a solution containing 70% mother liquor and 30% glycerol. Crystals were immediately flash-frozen in liquid nitrogen for data collection on a MicroMax-007 Rigaku X-ray generator mounted on an R-Axis IV++ detector. X-ray diffraction data were merged and scaled using HKL3000 (80). Molecular replacement and structure refinement were performed using the PHENIX suite of programs (81) with the H-Ras-GppNHp coordinates with PDB code 1CTQ used as the initial phasing model. The structure of N-Ras-GppNHp was solved at a resolution of 1.67Å, with data collection and refinement statistics shown in Table 3.
Author contributions
C. W. J. conceived the project, designed experiments, purified protein, performed and analyzed hydrolysis experiments, collected X-ray data, refined and analyzed the Ras structures, and wrote the paper. D. R. purified protein, performed and analyzed hydrolysis experiments, optimized N-Ras–GppNHp crystals, collected X-ray data, and refined N-Ras crystal structure. J. A. P. collected and analyzed ITC data. S. S. purified protein and found initial crystallization conditions for N-Ras–GppNHp. R. K. helped to analyze results of hydrolysis experiments. P. K. designed and analyzed the hydrolysis experiments using DynaFit4. C. M. conceived the project, designed experiments, analyzed results, and wrote the paper. All authors approved the final version of the manuscript.
Supplementary Material
Acknowledgments
We thank Prof. Lee Makowski for allowing use of the isothermal titration calorimeter and Yasmin Chishti for training J. A. P. on data collection for determination of Kd and thermodynamic parameters for the H-, K-, and N-Ras complexes with Raf-RBD. X-ray data were collected on equipment purchased by National Science Foundation Grant DBI-1228897 with matching funds from Northeastern University.
This work was supported by National Science Foundation Grant MCB-1517295. The authors declare that they have no conflicts of interest with the contents of this article.
The atomic coordinates and structure factors (code 5UHV) have been deposited in the Protein Data Bank (http://wwpdb.org/).
This article contains supplemental raw data, details of the model, DynaFit script, and individual progress curves.
- HVR
- hypervariable region
- GppNHp
- guanylyl-5-imidodiphosphate
- ITC
- isothermal titration calorimetry
- RBD
- Ras-binding domain
- PDB
- Protein Data Bank
- GAP
- GTPase-activating protein
- mant
- N-methylanthraniloyl
- MD
- molecular dynamics.
References
- 1. Cox A. D., and Der C. J. (2010) Ras history: the saga continues. Small GTPases 1, 2–27 [DOI] [PMC free article] [PubMed] [Google Scholar]
- 2. Hancock J. F. (2003) Ras proteins: different signals from different locations. Nature reviews. Mol. Cell Biol. 4, 373–384 [DOI] [PubMed] [Google Scholar]
- 3. Prior I. A., and Hancock J. F. (2012) Ras trafficking, localization and compartmentalized signalling. Semin. Cell Dev. Biol. 23, 145–153 [DOI] [PMC free article] [PubMed] [Google Scholar]
- 4. Milburn M. V., Tong L., deVos A. M., Brünger A., Yamaizumi Z., Nishimura S., and Kim S. H. (1990) Molecular switch of signal transduction: structural differences between active and inactive forms of protooncogenic ras proteins. Science 247, 939–945 [DOI] [PubMed] [Google Scholar]
- 5. Buhrman G., O'Connor C., Zerbe B., Kearney B. M., Napoleon R., Kovrigina E. A., Vajda S., Kozakov D., Kovrigin E. L., and Mattos C. (2011) Analysis of binding site hot spots on the surface of Ras GTPase. J. Mol. Biol. 413, 773–789 [DOI] [PMC free article] [PubMed] [Google Scholar]
- 6. Gorfe A. A., Grant B. J., and McCammon J. A. (2008) Mapping the nucleotide and isoform-dependent structural and dynamical features of Ras proteins. Structure 16, 885–896 [DOI] [PMC free article] [PubMed] [Google Scholar]
- 7. Bourne H. R., Sanders D. A., and McCormick F. (1991) The GTPase superfamily: conserved structure and molecular mechanism. Nature 349, 117–127 [DOI] [PubMed] [Google Scholar]
- 8. Valencia A., Chardin P., Wittinghofer A., and Sander C. (1991) The ras protein family: evolutionary tree and role of conserved amino acids. Biochemistry 30, 4637–4648 [DOI] [PubMed] [Google Scholar]
- 9. Araki M., Shima F., Yoshikawa Y., Muraoka S., Ijiri Y., Nagahara Y., Shirono T., Kataoka T., and Tamura A. (2011) Solution structure of the state 1 conformer of GTP-bound H-Ras protein and distinct dynamic properties between the state 1 and state 2 conformers. J. Biol. Chem. 286, 39644–39653 [DOI] [PMC free article] [PubMed] [Google Scholar]
- 10. Knihtila R., Holzapfel G., Weiss K., Meilleur F., and Mattos C. (2015) Neutron crystal structure of RAS GTPase puts in question the protonation state of the GTP γ-phosphate. J. Biol. Chem. 290, 31025–31036 [DOI] [PMC free article] [PubMed] [Google Scholar]
- 11. Zhong J. M., Chen-Hwang M. C., and Hwang Y. W. (1995) Switching nucleotide specificity of Ha-Ras p21 by a single amino acid substitution at aspartate 119. J. Biol. Chem. 270, 10002–10007 [DOI] [PubMed] [Google Scholar]
- 12. Parker J. A., and Mattos C. (2015) The Ras-membrane interface: isoform-specific differences in the catalytic domain. Mol. Cancer Res. 13, 595–603 [DOI] [PubMed] [Google Scholar]
- 13. Lu S., Jang H., Muratcioglu S., Gursoy A., Keskin O., Nussinov R., and Zhang J. (2016) Ras conformational ensembles, allostery, an signaling. Chem. Rev. 116, 6607–6665 [DOI] [PubMed] [Google Scholar]
- 14. Kalbitzer H. R., and Spoerner M. (2013) State 1(T) inhibitors of activated Ras. Enzymes 33, 69–94 [DOI] [PubMed] [Google Scholar]
- 15. Spoerner M., Hozsa C., Poetzl J. A., Reiss K., Ganser P., Geyer M., and Kalbitzer H. R. (2010) Conformational states of human rat sarcoma (Ras) protein complexed with its natural ligand GTP and their role for effector interaction and GTP hydrolysis. J. Biol. Chem. 285, 39768–39778 [DOI] [PMC free article] [PubMed] [Google Scholar]
- 16. Liao J., Shima F., Araki M., Ye M., Muraoka S., Sugimoto T., Kawamura M., Yamamoto N., Tamura A., and Kataoka T. (2008) Two conformational states of Ras GTPase exhibit differential GTP-binding kinetics. Biochem. Biophys. Res. Commun. 369, 327–332 [DOI] [PubMed] [Google Scholar]
- 17. Johnson C. W., and Mattos C. (2013) in Inhibitors of the Ras Superfamily G-proteins, Part A (Fuyuhiko T., ed) pp. 41–67, Academic Press, New York [Google Scholar]
- 18. Buhrman G., Holzapfel G., Fetics S., and Mattos C. (2010) Allosteric modulation of Ras positions Q61 for a direct role in catalysis. Proc. Natl. Acad. Sci. U.S.A. 107, 4931–4936 [DOI] [PMC free article] [PubMed] [Google Scholar]
- 19. Buhrman G., Kumar V. S., Cirit M., Haugh J. M., and Mattos C. (2011) Allosteric modulation of Ras-GTP is linked to signal transduction through RAF kinase. J. Biol. Chem. 286, 3323–3331 [DOI] [PMC free article] [PubMed] [Google Scholar]
- 20. Buhrman G., Wink G., and Mattos C. (2007) Transformation efficiency of RasQ61 mutants linked to structural features of the switch regions in the presence of Raf. Structure 15, 1618–1629 [DOI] [PMC free article] [PubMed] [Google Scholar]
- 21. Fetics S. K., Guterres H., Kearney B. M., Buhrman G., Ma B., Nussinov R., and Mattos C. (2015) Allosteric effects of the oncogenic RasQ61L mutant on Raf-RBD. Structure 23, 505–516 [DOI] [PMC free article] [PubMed] [Google Scholar]
- 22. Boriack-Sjodin P. A., Margarit S. M., Bar-Sagi D., and Kuriyan J. (1998) The structural basis of the activation of Ras by Sos. Nature 394, 337–343 [DOI] [PubMed] [Google Scholar]
- 23. Scheffzek K., Ahmadian M. R., Kabsch W., Wiesmüller L., Lautwein A., Schmitz F., and Wittinghofer A. (1997) The Ras-RasGAP complex: structural basis for GTPase activation and its loss in oncogenic Ras mutants. Science 277, 333–338 [DOI] [PubMed] [Google Scholar]
- 24. Trahey M., and McCormick F. (1987) A cytoplasmic protein stimulates normal N-Ras p21 GTPase, but does not affect oncogenic mutants. Science 238, 542–545 [DOI] [PubMed] [Google Scholar]
- 25. Thapar R., Williams J. G., and Campbell S. L. (2004) NMR characterization of full-length farnesylated and non-farnesylated H-Ras and its implications for Raf activation. J. Mol. Biol. 343, 1391–1408 [DOI] [PubMed] [Google Scholar]
- 26. Holzapfel G., Buhrman G., and Mattos C. (2012) Shift in the equilibrium between on and off states of the allosteric switch in Ras-GppNHp affected by small molecules and bulk solvent composition. Biochemistry 51, 6114–6126 [DOI] [PubMed] [Google Scholar]
- 27. Kearney B. M., Johnson C. W., Roberts D. M., Swartz P., and Mattos C. (2014) DRoP: a water analysis program identifies Ras-GTP-specific pathway of communication between membrane-interacting regions and the active site. J. Mol. Biol. 426, 611–629 [DOI] [PubMed] [Google Scholar]
- 28. Smith M. J., and Ikura M. (2014) Integrated RAS signaling defined by parallel NMR detection of effectors and regulators. Nat. Chem. Biol. 10, 223–230 [DOI] [PubMed] [Google Scholar]
- 29. Scheffler J. E., Waugh D. S., Bekesi E., Kiefer S. E., LoSardo J. E., Neri A., Prinzo K. M., Tsao K. L., Wegrzynski B., and Emerson S. D. (1994) Characterization of a 78-residue fragment of c-Raf-1 that comprises a minimal binding domain for the interaction with Ras-GTP. J. Biol. Chem. 269, 22340–22346 [PubMed] [Google Scholar]
- 30. Marcus K., and Mattos C. (2015) Direct attack on RAS: intramolecular communication and mutation-specific effects. Clin. Cancer Res. 21, 1810–1818 [DOI] [PubMed] [Google Scholar]
- 31. John J., Frech M., and Wittinghofer A. (1988) Biochemical properties of Ha-ras encoded p21 mutants and mechanism of the autophosphorylation reaction. J. Biol. Chem. 263, 11792–11799 [PubMed] [Google Scholar]
- 32. Neal S. E., Eccleston J. F., Hall A., and Webb M. R. (1988) Kinetic analysis of the hydrolysis of GTP by p21N-ras. The basal GTPase mechanism. J. biol. Chem. 263, 19718–19722 [PubMed] [Google Scholar]
- 33. Grant B. J., Gorfe A. A., and McCammon J. A. (2009) Ras conformational switching: simulating nucleotide-dependent conformational transitions with accelerated molecular dynamics. PLoS Comput. Biol. 5, e1000325. [DOI] [PMC free article] [PubMed] [Google Scholar]
- 34. Kapoor A., and Travesset A. (2015) Differential dynamics of RAS isoforms in GDP- and GTP-bound states. Proteins 83, 1091–1106 [DOI] [PubMed] [Google Scholar]
- 35. Ting P. Y., Johnson C. W., Fang C., Cao X., Graeber T. G., Mattos C., and Colicelli J. (2015) Tyrosine phosphorylation of RAS by ABL allosterically enhances effector binding. FASEB J. 29, 3750–3761 [DOI] [PMC free article] [PubMed] [Google Scholar]
- 36. Bollag G., and McCormick F. (1995) Intrinsic and GTPase-activating protein-stimulated Ras GTPase assays. Methods Enzymol. 255, 161–170 [DOI] [PubMed] [Google Scholar]
- 37. Shacter E. (1984) Organic extraction of Pi with isobutanol/toluene. Anal. Biochem. 138, 416–420 [DOI] [PubMed] [Google Scholar]
- 38. Beechem J. M. (1992) Global analysis of biochemical and biophysical data. Methods Enzymol. 210, 37–54 [DOI] [PubMed] [Google Scholar]
- 39. Kuzmic P. (1996) Program DYNAFIT for the analysis of enzyme kinetic data: application to HIV proteinase. Anal. Biochem. 237, 260–273 [DOI] [PubMed] [Google Scholar]
- 40. Kuzmic P. (2009) DynaFit–a software package for enzymology. Methods Enzymol. 467, 247–280 [DOI] [PubMed] [Google Scholar]
- 41. Watts D. G. (1994) Parameter estimates from nonlinear models. Methods Enzymol. 240, 23–36 [DOI] [PubMed] [Google Scholar]
- 42. Bates D. M., and Watts D. G. (1988) Nonlinear Regression Analysis and Its Applications, pp. 1–102, John Wiley & Sons, Inc., New York [Google Scholar]
- 43. John J., Rensland H., Schlichting I., Vetter I., Borasio G. D., Goody R. S., and Wittinghofer A. (1993) Kinetic and structural analysis of the Mg2+-binding site of the guanine nucleotide-binding protein p21H-ras. J. Biol. Chem. 268, 923–929 [PubMed] [Google Scholar]
- 44. Ford B., Hornak V., Kleinman H., and Nassar N. (2006) Structure of a transient intermediate for GTP hydrolysis by ras. Structure 14, 427–436 [DOI] [PubMed] [Google Scholar]
- 45. Rudolph M. G., Linnemann T., Grunewald P., Wittinghofer A., Vetter I. R., and Herrmann C. (2001) Thermodynamics of Ras/effector and Cdc42/effector interactions probed by isothermal titration calorimetry. J. Biol. Chem. 276, 23914–23921 [DOI] [PubMed] [Google Scholar]
- 46. Rojas A. M., Fuentes G., Rausell A., and Valencia A. (2012) The Ras protein superfamily: evolutionary tree and role of conserved amino acids. J. Cell Biol. 196, 189–201 [DOI] [PMC free article] [PubMed] [Google Scholar]
- 47. Berman H. M., Westbrook J., Feng Z., Gilliland G., Bhat T. N., Weissig H., Shindyalov I. N., and Bourne P. E. (2000) The Protein Data Bank. Nucleic Acids Res. 28, 235–242 [DOI] [PMC free article] [PubMed] [Google Scholar]
- 48. Scheidig A. J., Burmester C., and Goody R. S. (1999) The pre-hydrolysis state of p21ras in complex with GTP: new insights into the role of water molecules in the GTP hydrolysis reaction of ras-like proteins. Structure 7, 1311–1324 [DOI] [PubMed] [Google Scholar]
- 49. Ahmadian M. R., Hoffmann U., Goody R. S., and Wittinghofer A. (1997) Individual rate constants for the interaction of Ras proteins with GTPase-activating proteins determined by fluorescence spectroscopy. Biochemistry 36, 4535–4541 [DOI] [PubMed] [Google Scholar]
- 50. Allin C., Ahmadian M. R., Wittinghofer A., and Gerwert K. (2001) Monitoring the GAP catalyzed H-Ras GTPase reaction at atomic resolution in real time. Proc. Natl. Acad. Sci. U.S.A. 98, 7754–7759 [DOI] [PMC free article] [PubMed] [Google Scholar]
- 51. Allin C., and Gerwert K. (2001) Ras catalyzes GTP hydrolysis by shifting negative charges from γ- to β-phosphate as revealed by time-resolved FTIR difference spectroscopy. Biochemistry 40, 3037–3046 [DOI] [PubMed] [Google Scholar]
- 52. Eccleston J. F., Moore K. J., Morgan L., Skinner R. H., and Lowe P. N. (1993) Kinetics of interaction between normal and proline 12 Ras and the GTPase-activating proteins, p120-GAP and neurofibromin. J. Biol. Chem. 268, 27012–27019 [PubMed] [Google Scholar]
- 53. Feuerstein J., Goody R. S., and Wittinghofer A. (1987) Preparation and characterization of nucleotide-free and metal ion-free p21 “apoprotein”. J. Biol. Chem. 262, 8455–8458 [PubMed] [Google Scholar]
- 54. John J., Schlichting I., Schiltz E., Rösch P., and Wittinghofer A. (1989) C-terminal truncation of p21H preserves crucial kinetic and structural properties. J. Biol. Chem. 264, 13086–13092 [PubMed] [Google Scholar]
- 55. Kötting C., Kallenbach A., Suveyzdis Y., Wittinghofer A., and Gerwert K. (2008) The GAP arginine finger movement into the catalytic site of Ras increases the activation entropy. Proc. Natl. Acad. Sci. U.S.A. 105, 6260–6265 [DOI] [PMC free article] [PubMed] [Google Scholar]
- 56. Lowe P. N., Page M. J., Bradley S., Rhodes S., Sydenham M., Paterson H., and Skinner R. H. (1991) Characterization of recombinant human Kirsten-ras (4B) p21 produced at high levels in Escherichia coli and insect baculovirus expression systems. J. Biol. Chem. 266, 1672–1678 [PubMed] [Google Scholar]
- 57. Mazhab-Jafari M. T., Marshall C. B., Smith M., Gasmi-Seabrook G. M., Stambolic V., Rottapel R., Neel B. G., and Ikura M. (2010) Real-time NMR study of three small GTPases reveals that fluorescent 2′(3′)-O-(N-methylanthraniloyl)-tagged nucleotides alter hydrolysis and exchange kinetics. J. Biol. Chem. 285, 5132–5136 [DOI] [PMC free article] [PubMed] [Google Scholar]
- 58. Moore K. J., Webb M. R., and Eccleston J. F. (1993) Mechanism of GTP hydrolysis by p21N-ras catalyzed by GAP: studies with a fluorescent GTP analogue. Biochemistry 32, 7451–7459 [DOI] [PubMed] [Google Scholar]
- 59. Neal S. E., Eccleston J. F., and Webb M. R. (1990) Hydrolysis of GTP by p21NRAS, the NRAS protooncogene product, is accompanied by a conformational change in the wild-type protein: use of a single fluorescent probe at the catalytic site. Proc. Natl. Acad. Sci. U.S.A. 87, 3562–3565 [DOI] [PMC free article] [PubMed] [Google Scholar]
- 60. Nixon A. E., Brune M., Lowe P. N., and Webb M. R. (1995) Kinetics of inorganic phosphate release during the interaction of p21ras with the GTPase-activating proteins, p120-GAP and neurofibromin. Biochemistry 34, 15592–15598 [DOI] [PubMed] [Google Scholar]
- 61. Smith M. J., Neel B. G., and Ikura M. (2013) NMR-based functional profiling of RASopathies and oncogenic RAS mutations. Proc. Natl. Acad. Sci. U.S.A. 110, 4574–4579 [DOI] [PMC free article] [PubMed] [Google Scholar]
- 62. Webb M. R., and Hunter J. L. (1992) Interaction of GTPase-activating protein with p21ras, measured using a continuous assay for inorganic phosphate release. Biochem. J. 287, 555–559 [DOI] [PMC free article] [PubMed] [Google Scholar]
- 63. John J., Sohmen R., Feuerstein J., Linke R., Wittinghofer A., and Goody R. S. (1990) Kinetics of interaction of nucleotides with nucleotide-free H-ras p21. Biochemistry 29, 6058–6065 [DOI] [PubMed] [Google Scholar]
- 64. Shutes A., and Der C. J. (2006) in Methods in Enzymology: Regulators and effectors of small GTPases: Ras family (Balch W. E., Der C. J., and Hall A., eds) pp. 9–21, Academic Press, Inc., San Diego: [DOI] [PubMed] [Google Scholar]
- 65. Shutes A., Phillips R. A., Corrie J. E., and Webb M. R. (2002) Role of magnesium in nucleotide exchange on the small G protein rac investigated using novel fluorescent guanine nucleotide analogues. Biochemistry 41, 3828–3835 [DOI] [PubMed] [Google Scholar]
- 66. Cornish-Bowden A. (2012) Fundamentals of Enzyme Kinetics, 4th Ed., pp. 1–510, Wiley-Blackwell, Hoboken, NJ [Google Scholar]
- 67. Leupold C. M., Goody R. S., and Wittinghofer A. (1983) Stereochemistry of the elongation factor Tu X GTP complex. Eur. J. Biochem. 135, 237–241 [DOI] [PubMed] [Google Scholar]
- 68. Sayyed-Ahmad A., Prakash P., and Gorfe A. A. (2017) Distinct dynamics and interaction patterns in H- and K-Ras oncogenic P-loop mutants. Proteins 10.1002/prot.25317 [DOI] [PMC free article] [PubMed] [Google Scholar]
- 69. Ito Y., Yamasaki K., Iwahara J., Terada T., Kamiya A., Shirouzu M., Muto Y., Kawai G., Yokoyama S., Laue E. D., Wälchli M., Shibata T., Nishimura S., and Miyazawa T. (1997) Regional polysterism in the GTP-bound form of the human c-Ha-Ras protein. Biochemistry 36, 9109–9119 [DOI] [PubMed] [Google Scholar]
- 70. O'Connor C., and Kovrigin E. L. (2008) Global conformational dynamics in Ras. Biochemistry 47, 10244–10246 [DOI] [PubMed] [Google Scholar]
- 71. Vatansever S., Gümüş Z. H., and Erman B. (2016) Intrinsic K-Ras dynamics: a novel molecular dynamics data analysis method shows causality between residue pair motions. Sci. Rep. 6, 37012. [DOI] [PMC free article] [PubMed] [Google Scholar]
- 72. Güldenhaupt J., Rudack T., Bachler P., Mann D., Triola G., Waldmann H., Kötting C., and Gerwert K. (2012) N-Ras forms dimers at POPC membranes. Biophys. J. 103, 1585–1593 [DOI] [PMC free article] [PubMed] [Google Scholar]
- 73. Newlaczyl A. U., Hood F. E., Coulson J. M., and Prior I. A. (2014) Decoding RAS isoform and codon-specific signalling. Biochem. Soc. Trans. 42, 742–746 [DOI] [PMC free article] [PubMed] [Google Scholar]
- 74. Jang H., Banerjee A., Chavan T. S., Lu S., Zhang J., Gaponenko V., and Nussinov R. (2016) The higher level of complexity of K-Ras4B activation at the membrane. FASEB J. 30, 1643–1655 [DOI] [PMC free article] [PubMed] [Google Scholar]
- 75. Wellbrock C., and Arozarena I. (2016) The complexity of the ERK/MAP-kinase pathway and the treatment of melanoma skin cancer. Front. Cell Dev. Biol. 4, 33. [DOI] [PMC free article] [PubMed] [Google Scholar]
- 76. Prior I. A., Lewis P. D., and Mattos C. (2012) A comprehensive survey of Ras mutations in cancer. Cancer Res. 72, 2457–2467 [DOI] [PMC free article] [PubMed] [Google Scholar]
- 77. Johnson C. W., Buhrman G., Ting P. Y., Colicelli J., and Mattos C. (2016) Expression, purification, crystallization and X-ray data collection for RAS and its mutants. Data Brief 6, 423–427 [DOI] [PMC free article] [PubMed] [Google Scholar]
- 78. Tucker J., Sczakiel G., Feuerstein J., John J., Goody R. S., and Wittinghofer A. (1986) Expression pf p21 proteins in Escherichia coli and stereochemistry of the nucleotide-binding site. EMBO J. 5, 1351–1358 [DOI] [PMC free article] [PubMed] [Google Scholar]
- 79. Bradford M. M. (1976) A rapid and sensitive method for the quantitation of microgram quantities of protein utilizing the principle of protein-dye binding. Anal. Biochem. 72, 248–254 [DOI] [PubMed] [Google Scholar]
- 80. Otwinowski Z., and Minor W. (1997) Processing of X-ray diffraction data collected in oscillation mode. Methods Enzymol. 276, 307–326 [DOI] [PubMed] [Google Scholar]
- 81. Adams P. D., Afonine P. V., Bunkóczi G., Chen V. B., Davis I. W., Echols N., Headd J. J., Hung L. W., Kapral G. J., Grosse-Kunstleve R. W., McCoy A. J., Moriarty N. W., Oeffner R., Read R. J., Richardson D. C., et al. (2010) PHENIX: a comprehensive Python-based system for macromolecular structure solution. Acta Crystallogr. D Biol. Crystallogr. 66, 213–221 [DOI] [PMC free article] [PubMed] [Google Scholar]
Associated Data
This section collects any data citations, data availability statements, or supplementary materials included in this article.