

Abstract
Methylmercury (MeHg) is one of the most toxic mercury species, which can cause many systemic damages, but little is known about its effect in the salivary glands. This study aimed to analyze the mercury levels, oxidative stress, and proteomic profile in parotid, submandibular, and sublingual salivary glands of rats, after chronic MeHg intoxication. Two groups of twenty male Wistar rats (90 days of age) were used on the experiment. MeHg group was intoxicated by intragastric gavage with MeHg at a dose of 0.04 mg/kg/day for 60 days, while the control group received only oil. After the period of intoxication, the glands were collected for evaluation of total mercury levels, proteomic profile, and oxidative balance by analyzing the antioxidant capacity against peroxyl radicals (ACAP), lipid peroxidation (LPO), and nitrite levels. Our results have showed that mercury levels were significant in all three glands compared to the respective control. It also showed lower levels of ACAP, as well as higher LPO and nitrite levels. The proteomic profile presented impairments on structural components of cytoskeleton, metabolic pathways, and oxidative biochemistry. Thus, the exposure to MeHg was able to generate oxidative stress that could be associated with changes in the proteomic profile of salivary glands.
1. Introduction
Mercury is a high toxic metal with a wide distribution on nature and has been considered as an important health concern [1, 2]. Mercury occurs naturally in the environment on organic and inorganic forms, in which methylmercury (MeHg) and mercury chloride (HgCl2) are the most toxic forms, respectively. MeHg is an alkylmercury compound that is derived from the methylation of Hg+2 by methanogenic and sulfate-reducing bacteria on aquatic ecosystems and some soils [3–5].
The anthropogenic action leads to higher concentrations on biosphere and may expose animals of aquatic food chain to damage [5]. Many researches have reported that fishes and other seafood are the main sources of human contamination by low daily doses, in which about 90% of Hg is present on its organic form, leading to higher bioaccumulation and biomagnification [6, 7].
Hg also has been described as a huge pollutant able to accumulate and induce cellular impairments in organs related to metabolism and excretion, as the liver and kidneys [8–11]. Few studies [12–14] have demonstrated the effects of HgCl2 in salivary glands, and there is no evidence of MeHg effects. In this way, it is important to describe the MeHg-induced alteration in salivary glands to elucidate the consequences of this metal exposure.
The parotid, submandibular, and sublingual are the main salivary glands, representing about 90% of the total salivary human production. Salivary glands are important organs on the maintenance of oral cavity homeostasis; their major function is salivary secretion that is responsible for balancing the microbiota, pH, and carbohydrates catalysis in the mouth [15, 16]. Moreover, studies of metal toxicological effects on salivary glands are still rare, especially about MeHg. The aim of this study was to evaluate whether the chronic exposure to low doses of MeHg is able to impair biochemical parameters and the proteomic profile, which could be related to dysfunctions in the organs.
2. Materials and Methods
2.1. Animals and Experimental Groups
A total of 40 male Wistar rats were obtained from the Federal University of Pará (UFPA, Belém, Brazil), under the BIO 225-14 CEPAE – UFPA, following the NIH Guide for the Care and Use of Laboratory Animals. The animals were maintained in collective cages with 5 animals each and were kept in a climate-controlled room on a 12 h light/dark cycle with water and food ad libitum. Corn oil or MeHg with a daily dose of 0.04 mg/kg was orally administered by gavage over a period of 60 days of exposure according to an adapted protocol from Kong et al. [17]. To regulate the administered dose in animals, they were weekly weighted for adjustment of MeHg concentration and determination of the body mass curve.
2.2. Samples Collection
After 24 hours of the last administration, the animals were euthanized by cervical dislocation and had their three pairs of salivary glands (parotid, submandibular, and sublingual) collected and frozen in liquid nitrogen and posteriorly stored in ultrafreezer −80°C until further analysis. One gland from each animal was saved to the assays of oxidative biochemistry, proteomic analysis, and measurement of total mercury deposits.
2.3. Mercury Deposits
Total mercury content in the samples was quantified by wet digestion, reduction, and cold vapor atomic absorption spectrometry with gold amalgamation system Mercury Analyzer: SP3D (Nippon Corporation). The estimations were conducted following the protocol previously mentioned by Suzuki et al. [18], in which consists by converting the Hg into elementary Hg vapor in order to quantify in parts per million (ppm) by an absorption cell. The analyses were performed preparing duplicates of each sample of groups, and the values were tabulated to further inferential statistical analysis.
2.4. Oxidative Biochemistry Analysis
The samples were first thawed and homogenized in 700 μL Tris-HCl buffer (20 mM, pH 7.4). A volume of 200 μL from the total homogenate was used to perform the measurement of antioxidant capacity against peroxyl radicals (ACAP), whereas 300 μL was used to measure nitrite levels and 100 μL to lipid peroxidation assay (LPO).
First, ACAP was measured as previously described by Amado et al. [19]. The supernatant of each sample after centrifugation was, in triplicate, exposed to a peroxyl radical generator, the 2,2′-azobis 2 methylpropionamidine dihydrochloride (ABAP; 4 mM; Aldrich), and, in another triplicate, they received only ultrapure water in a 96-well microplate. After reaction, the fluorescence generated was measured in a fluorimeter (Victor X3, Perkin Elmer) at 35°C. After the first reading for determination of background fluorescence values, a total of 10 μl of 2′,7′ (H2DCF-DA) 40 nM was added to the microplate, with a reading in every 5 minutes during 60 minutes [19, 20]. The results were expressed according to the difference between areas below the curves created by total fluorescence production of samples with and without ABAP after application to a second order polynomial function, being named as a relative area. High-relative areas mean low antioxidant activity, once the sample had low capacity to neutralize the peroxyl radicals. Results were expressed as percentages of control group.
The remaining homogenate was centrifuged at 21.000g for 20 minutes, and the supernatant was used to perform the assays. The concentration of nitrite was determined following the protocol previously adapted by Fagundes et al. [21], which is based on a reaction with Griess reagent (0.1% N-(1-naphthyl) ethylenediaminedihydrochloride; 1% sulfanilamide in 5% phosphoric acid; 1 : 1) proceeding the absorbance measurement on a spectrophotometer at 550 nm, and compared to standard solutions of sodium nitrite.
The level of LPO was established by measurement of malonaldehyde (MDA) levels based on Esterbauer and Cheeseman [22] method adapted by Fagundes et al. [21]. An aliquot of the supernatant was processed as described by the Bioxytech LPO-568 kit (Cayman Chemical). This kit is a chromogenic reagent that reacts with MDA at 45°C. The absorbance measurement on spectrophotometers was performed at 586 m wavelength.
The total protein content in the supernatants (20 μL) was analyzed by Bradford [23] method. After the correction for protein concentration, results of lipid peroxidation and nitrite levels were expressed in percentages of control groups.
2.5. Proteomic
The frozen salivary glands were homogenized in a cryogenic mill (model 6770, Spex, Metuchen, NJ, EUA). For protein extraction, gland homogenate was incubated in lysis buffer (7 M urea, 2 M thiourea, 4% CHAPS, 1% IPG buffer pH 3–10, and 40 mM DTT) for 1 hour at 4°C with continuous shaking. In order to recovery the soluble proteins and the supernatant, the homogenate was centrifuged at 15.000 rpm for 30 minutes at 4°C. The proteins were precipitated using the kit PlusOne 2D Cleanup (GE Healthcare, Uppsala, Sweden), as recommended by the manufacturer. Pellets were resuspended in rehydration buffer (7 M urea, 2 M thiourea, 0.5% CHAPS, 0.5% IPG buffer pH 3–10, 18 mM DTT, and 0.002% bromophenol blue). Twenty-five μL of salivary gland proteins from each animal of the same group was combined to constitute a pool that was centrifuged for clarification. To each pool, 50 mM AMBIC containing 3 M urea was added. Each sample was filtered twice in 3 kDa AMICON (Millipore, St. Charles, MO, USA). The protein content was measured in the pooled samples by Bradford protein assay [23]. To each sample (50 μg of total protein for each pool in a volume of 50 μL), 10 μL of 50 mM AMBIC was added. In sequence, 25 μL of 0.2% RapiGEST™ (Waters Co., Manchester, UK) was added and incubated at 80°C for 15 min. Following, 2.5 μL of 100 mM DTT was added and incubated at 60°C for 30 min. Also, 2.5 μL of 300 mM IAA was added and incubated for 30 min at room temperature (under dark). Then, 10 μL of trypsin (100 ng; Trypsin Gold Mass Spectrometry, Promega, Madison, USA) was added and digestion occurred for 14 h at 37°C. After digestion, 10 μl of 5% TFA was added, incubated for 90 min at 37°C, and the sample was centrifuged (14,000 rpm for 30 min). The supernatant was collected, and 5 μL of ADH (1 pmol/μL) plus 85 μL 3% ACN was added.
After protein extraction is completed, separation and identification of peptides were performed on a nanoAcquity UPLC-Xevo QTof MS system (Waters, Manchester, UK). The difference in expression among the groups was obtained using PLGS software, considering p < 0.05 for downregulated proteins and p > 0.95 for upregulated proteins. The bioinformatics analysis was performed using Uniprot protein ID accession numbers to map their associated encoding Uniprot gene entries for the comparison of control × MeHg. Gene ontology (GO) annotation of biological process was performed using Cytoscape v3.0 software, with the Cluego v2.0.7 plugin. Uniprot IDs were uploaded to the software and analyzed with default parameters, which specify an enrichment (right-sided hypergeometric test) correction method using Bonferroni step down, analysis mode “Function” and load gene cluster list for Rattus novergicus, evidence codes “All,” set networking specificity “medium” (GO levels 3 to 8), and KappaScoreThreshold 0.4. The protein-protein interaction (ppi) network was built by ClusterMarker, another Cytoscape plugin. After the network creation, we edited nodes and edge colors according to each group.
2.6. Statistical Analysis
Statistical comparison of body weight gains between control and MeHg groups was performed using one-way analysis of variance (ANOVA).
All values obtained from the biochemical and total mercury quantification analysis were plotted on GraphPad Prism 5.0 software (San Diego, CA, USA) and were expressed, respectively, as percentage of control and mean ± SEM. All data were compared using Student's t-test with a level of significance of p < 0.05.
3. Results
3.1. Body Weight Measurement and Deposits of Total Hg in Salivary Glands
Although a normal increase on body mass over the 60 days of MeHg exposure was observed, no difference was observed at the final weight (Figure 1(a)). The MeHg chronic exposure was able to promote Hg deposits (ppm) on salivary glands (Figure 1(b)). Our results showed, after the 60th day of MeHg exposure, a significantly Hg deposit in all three types of rat glands compared to the control groups. We also showed a higher deposit on parotid, suggesting a major tropism than submandibular and sublingual glands.
Figure 1.

(a) Effects of MeHg chronic exposure at a dose of 0.04 mg/kg/day during 60 days on body mass gain of rats. The results are expressed as mean ± SEM (n = 20 animals per group) with one-way ANOVA with repeated measures followed by Tukey test. (b) Total mercury deposits on salivary glands of rats exposed to MeHg for 60 days. The values are expressed as mean ± SEM of Hg concentrations. ∗p < 0.05 compared to control group and # compared to others glands (one-way ANOVA and Tukey posttest).
3.2. Chronic Exposure of MeHg Impairs the Oxidative Biochemistry
In order to analyze the possible involvement of cellular stress, we performed oxidative/nitrosative biochemistry assay. Our data suggest that MeHg is able to induce impairment at the antioxidant defense system by reducing the total antioxidant capacity. Results showed lower ACAP levels in submandibular (Figure 2(c)) showing 36.92% ± 14.51 more RNS than in control group, whereas sublingual (Figure 2(b)) showed 58.24% ± 12.26 and parotid (Figure 2(a)) 59.67% ± 7.32 more than control, respectively.
Figure 2.

Levels of antioxidant capacity against peroxyl radical parotid (a), submandibular (b), and sublingual salivary glands (c) of animals exposed chronically to methylmercury. The values are expressed as percentage of control ± SEM. ∗p < 0.05 (Student's t-test).
Our result showed that nitrite concentrations are higher at all three types of rat salivary gland than at the control group. The results showed higher levels in parotid (Figure 3(a)) showing 86.89% ± 15.71 more RNS than in control group, whereas submandibular (Figure 3(b)) showed 56.42% ± 11.65 and sublingual (Figure 3(c)) 50.45% ± 8.09 more than the control, respectively.
Figure 3.

Levels of nitrite concentration in parotid (a), submandibular (b), and sublingual salivary glands (c) of animals exposed chronically to methylmercury. The values are expressed as percentage of control ± SEM. ∗p < 0.05 (Student's t-test).
We further showed that MeHg is able to induce lipid peroxidation, by the yields of MDA (Figure 4), on salivary glands of MeHg group. The results showed higher levels of MDA in all three major glands. All glands of MeHg group showed 100% more damaged than those of the control animals. The parotid (Figure 4(a)) showed about 121.16% ± 18.2 higher, submandibular (Figure 4(b)) about 141.94% ± 27.18 higher, and sublingual (Figure 4(c)) about 106.59% ± 29.38 more when compared to the control.
Figure 4.

Levels of lipid peroxidation in parotid (a), submandibular (b), and sublingual (c) glands of animals exposed chronically to methylmercury. The values are expressed as percentage of control ± SEM. ∗p < 0.05 (Student's t-test).
3.3. MeHg Changes the Proteomic Profile of Rat Salivary Glands
This exposure model revealed a total of 15 proteins downregulated and 22 proteins upregulated on parotid glands (Table 1); 6 proteins downregulated and 7 upregulated on submandibular glands (Table 2); and 7 proteins downregulated and 2 upregulated on sublingual glands (Table 3). The proteomic analysis of the three salivary glands also revealed several proteins that were only found in one of the groups, being absent in the other (Supplementary Tables available online at https://doi.org/10.1155/2017/5653291).
Table 1.
Identified proteins with expression significantly altered in rat parotid glands of group exposed to Mehg (Hg).
| aAccess number | Protein name description | PLGS score | Fold change |
|---|---|---|---|
| Hg | |||
| P68136 | Actin, alpha skeletal muscle | 1873.1 | −0.9 |
| P62738 | Actin, aortic smooth muscle | 1713.4 | −0.9 |
| P63269 | Actin, gamma-enteric smooth muscle | 1713.4 | −0.9 |
| F1LP05 | ATP synthase subunit alpha | 548.16 | −0.8 |
| P10719 | ATP synthase subunit beta, mitochondrial | 353.85 | −0.8 |
| P21704 | Deoxyribonuclease-1 | 268.66 | −0.6 |
| D3ZXS6 | Elongation factor 1-alpha | 327 | 2.4 |
| M0R757 | Elongation factor 1-alpha | 343.66 | 2.5 |
| P62630 | Elongation factor 1-alpha 1 | 343.66 | 2.5 |
| P62632 | Elongation factor 1-alpha 2 | 327 | 2.5 |
| D4A4S3 | Heat shock cognate 71 kDa protein | 151.3 | −0.7 |
| M0R8M9 | Heat shock cognate 71 kDa protein | 739.22 | −0.8 |
| P01946 | Hemoglobin subunit alpha-1/2 | 1975.8 | 1.2 |
| P02091 | Hemoglobin subunit beta-1 | 1841.8 | 1.8 |
| D3ZWE0 | Histone H2A | 764.11 | 2.0 |
| P02262 | Histone H2A type 1 | 764.11 | 1.9 |
| P0C169 | Histone H2A type 1-C | 764.11 | 1.8 |
| P0C170 | Histone H2A type 1-E | 764.11 | 2.0 |
| Q64598 | Histone H2A type 1-F | 764.11 | 1.9 |
| P0CC09 | Histone H2A type 2-A | 764.11 | 1.8 |
| Q4FZT6 | Histone H2A type 3 | 764.11 | 1.8 |
| Q00728 | Histone H2A type 4 | 764.11 | 1.7 |
| A9UMV8 | Histone H2A.J | 764.11 | 1.9 |
| P0C0S7 | Histone H2A.Z | 764.11 | 1.9 |
| D3ZK97 | Histone H3 | 258.66 | 1.2 |
| P62804 | Histone H4 | 2231.9 | 1.3 |
| Q10758 | Keratin, type II cytoskeletal 8 | 863.19 | −0.8 |
| D3ZUQ1 | Lipase | 396.87 | 1.3 |
| G3V812 | Prolactin induced protein, isoform CRA_d | 7686.8 | −0.9 |
| O70417 | Prolactin-inducible protein homolog | 7084.7 | −0.9 |
| F1LRA1 | Protein ERGIC-53 | 400.1 | 1.2 |
| F1M6C2 | Protein LOC103691939 | 343.66 | 2.5 |
| F1LZI1 | Protein LOC680121 | 538.95 | −0.7 |
| P02770 | Serum albumin | 489.45 | 1.3 |
| B4F7C2 | Tubulin beta-4 | 455.5 | −0.7 |
| Q6P9T8 | Tubulin beta-4B chain | 455.5 | −0.7 |
| M0RCB1 | Uncharacterized protein | 769.68 | −0.8 |
The identified proteins are organized according to the alphabetical order. Relative differential expression is indicated by positive value, when the protein is upregulated, and by negative values (−), when the protein is downregulated in the comparison between groups. aIdentification is based on protein ID from UniProt protein database (http://www.uniprot.org/).
Table 2.
Identified proteins with expression significantly altered in rats' submandibular glands of group exposed to Mehg (Hg).
| aAccess number | Protein name description | PLGS score | Fold change |
|---|---|---|---|
| Hg | |||
| Q08163 | Adenylyl cyclase-associated protein 1 | 148.55 | −0.2 |
| P15999 | ATP synthase subunit alpha, mitochondrial | 560.23 | −0.6 |
| M0R757 | Elongation factor 1-alpha | 225.49 | 1.6 |
| P62630 | Elongation factor 1-alpha 1 | 225.49 | 1.6 |
| P62632 | Elongation factor 1-alpha 2 | 188.54 | 1.8 |
| O88752 | Epsilon 1 globin | 2060.91 | −0.3 |
| P11517 | Hemoglobin subunit beta-2 | 2099.64 | −0.3 |
| D3ZNH4 | Histone H2B | 3909.79 | −0.7 |
| F1LQ08 | Protein Car6 | 439.43 | 1.4 |
| F1M6C2 | Protein LOC103691939 | 193.93 | 1.7 |
| E9PTY1 | Protein Prol1 | 325.88 | 2.0 |
| P08462 | Submandibular gland secretory Glx-rich protein CB | 944.25 | 1.3 |
| D4A5P1 | Uncharacterized protein | 364.33 | −0.6 |
The identified proteins are organized according to the alphabetical order. Relative differential expression is indicated by positive value, when the protein is upregulated, and by negative values (−), when the protein is downregulated in the comparison between groups. aIdentification is based on protein ID from UniProt protein database (http://www.uniprot.org/).
Table 3.
Identified proteins with expression significantly altered in the rats' sublingual glands of group exposed to MeHg (Hg).
| aAccess number | Protein name description | PLGS score | Fold change |
|---|---|---|---|
| Hg | |||
| E9PSQ1 | Alpha-amylase | 2696.09 | −0.3 |
| F1LPK5 | Acidic mammalian chitinase | 1384.72 | −0.2 |
| G3V812 | Prolactin induced protein, isoform CRA_d | 6144.39 | −0.2 |
| G3V844 | Alpha-amylase | 344.21 | −0.3 |
| M0R7K9 | Protein Csap1 | 1852.75 | −0.3 |
| O70417 | Prolactin-inducible protein homolog | 5900.39 | −0.2 |
| P00689 | Pancreatic alpha-amylase | 344.21 | 1.7 |
| P02770 | Serum albumin | 600.4 | −0.6 |
| P12020 | Cysteine-rich secretory protein 1 | 221.34 | 2.5 |
The identified proteins are organized according to the alphabetical order. Relative differential expression is indicated by positive value, when the protein is upregulated, and by negative values (−), when the protein is downregulated in the comparison between groups. aIdentification is based on protein ID from UniProt protein database (http://www.uniprot.org/).
In parotid gland, MeHg was able to change 20 categories of proteins classified by Cytoscape according to GO (Figure 5(a)). Our data showed that they are related to the following biological processes: nucleosome (20.31%), aerobic respiration process (7.81%), NAD binding (7.81%), mesenchyme migration (6.65%), hydrolyase activity (6.25%), oxygen binding (4.69%), and response to mercury ion (4.69%). Regulation of cellular respiration, protein transmembrane transport, melanosome, nucleosomal DNA binding, retina homeostasis, benzaldehyde dehydrogenase (NAD+) activity, myelin sheath, intermediate filament, pigment granule, mRNA 5′-UTR biding, cellular response to epidermal growth factor stimulus, and cellular response to gamma radiation corresponded to 3.13% each.
Figure 5.

Functional distribution of proteins identified with differential expression (a) in rat parotid glands exposed to MeHg versus control group. Categories of proteins based on GO annotation biological process, molecular function, and cellular component. Terms significant (Kappa = 0.4) and distribution according to percentage of number of genes association. And subnetwork (b) created by ClusterMarker app to establish the interaction among identified proteins of parotid glands with differentiated expression on exposed group when compared to the control group. The node colors indicate the differential expression of respective protein named with its accession ID. Red and dark green indicate proteins found in the control and exposed groups, respectively. Light green and pink indicate upregulated and downregulated proteins, respectively. Gray nodes represent those proteins that were not identified on this study, but they interacted on the network. The access identification number in nodes corresponds to P17046: lysosome-associated membrane glycoprotein 2, P82995: heat shock protein HSP 90-alpha, P34058: heat shock protein HSP 90-beta, P21708: mitogen-activated protein kinase 3, P10719: synaptic vesicle membrane protein VAT-1 homolog, Q3MIE4: protein ERGIC-53, Q62902: protein ERGIC-53, P13471: 40S ribosomal protein S14, P38983: 40S ribosomal protein SA, B2RZD1: protein Sec61b, P07632: superoxide dismutase (cu-Zn), Q5XIF6: tubulin alpha-4A chain, Q64428: trifunctional enzyme subunit alpha, mitochondrial, and P62632: elongation factor 1-alpha 2.
The ppi network of parotid gland (Figure 5(b)) showed a central protein (mitogen-activated protein kinase 3; P21708), which interacts with proteins related to stress response (heat shock protein HSP 90-alpha, P82995; heat shock protein HSP 90-beta, P34058), molecular function proteins (synaptic vesicle membrane protein VAT-1 homolog, Q3MIE4; protein ERGIC-53, Q62902; 40S ribosomal protein S14, P13471; 40S ribosomal protein AS, P38983; Sec61 beta subunit, B2RZD1; elongation factor 1-alpha 2, P62632), oxidative stress enzymes (superoxide dismutase (Cu-Zn), P07632), microtubule component (tubulin alpha-4A chain, Q5XIF6), and energetic metabolism process (trifunctional enzyme subunit alpha, mitochondrial, Q64428; ATP synthase subunit beta, mitochondrial, P10719).
As for the submandibular gland, our results showed that 10 categories of proteins classified by Cytoscape, according to GO, were significantly altered upon chronic exposure to MeHg (Figure 6(a)). The myelin sheath proteins correspond to 31.43%; the structural constituent of cytoskeleton and the substance nigra development represent 11.43%, each. Moreover, the nuclear nucleosome represents 8.57% and regulation of sodium ion transmembrane transporter activity symbolizes 8.57% of the proteins with alterations. Adenylate cyclase binding, mitochondrial proton-transporting ATP synthase complex, catalytic core F (1), phosphoserine binding, bHLH transcription factor binding, and eukaryotic translation elongation factor 1 complex corresponded to 3.13% each.
Figure 6.

Functional distribution of proteins (a) identified with differential expression in rat submandibular glands exposed to MeHg versus control group. Categories of proteins based on GO annotation biological process, molecular function, and cellular component. Terms significant (Kappa = 0.4) and distribution according to percentage of number of gene association. Subnetwork (b) created by ClusterMarker app to establish the interaction among identified proteins of submandibular glands with differentiated expression on exposed group when compared to control group. The node colors indicate the differential expression of respective protein named with its accession ID. Red and dark green indicate proteins found in control and exposed groups, respectively. Light green and pink indicate upregulated and downregulated proteins, respectively. Gray nodes represent those proteins that were not identified on this study, but they interacted on the network. The access identification number in nodes corresponds to P52555: endoplasmic reticulum resident protein 29, P06761: 78 kDa glucose-regulated protein, P14659: heat shock-related 70 kDa protein 2, P15999: ATP synthase subunit alpha, mitochondrial, Q09073: ADP/ATP translocase 2, Q6P9V9: tubulin alpha-1B chain, P62632: elongation factor 1-alpha 2, P35434: ATP synthase subunit delta, mitochondrial, F1M446 protein RGD1306148, P68255: 14-3-3 protein theta, Q8VHF5: citrate synthase, mitochondrial, and P62632: elongation factor 1-alpha 2.
Similarly to what was found for the parotid gland, most of the proteins with altered expression in the submandibular gland interacted with mitogen-activated protein kinase 3 (P21708), which was found in the center of the ppi network. The interacting proteins were those related to stress response (P14659), energetic metabolic process (ATP synthase subunit alpha, mitochondrial, P15999; ADP/ATP translocase 2, Q09073; ATP synthase subunit delta, mitochondrial, P35434 and citrate synthase, mitochondrial, Q8VHF5), microtubule constituent (tubulin alpha-1B chain, Q6P9V9), molecular functions (elongation factor 1-alpha 2, P62632; uncharacterized protein, F1M446; 14-3-3 protein theta, P68255; elongation factor 1-alpha 2, P62632), and cellular component (endoplasmic reticulum resident protein 29, P52555; 78 kDa glucose-regulated protein, P06761) (Figure 6(b)).
Sublingual glands presented the lower number of protein groups identified on Cytoscape, following ClueGO app GO classification (Figure 7(a)). Each of the 6 groups of proteins is represented by myelin sheath (33.33%), unfolded protein binding (19.05%), retina homeostasis (14.29%), structural constituent of cytoskeleton (14.29%), detection of chemical stimulus involved in sensory perception of bitter taste (9.52%), and alpha-amylase activity (9.52%).
Figure 7.
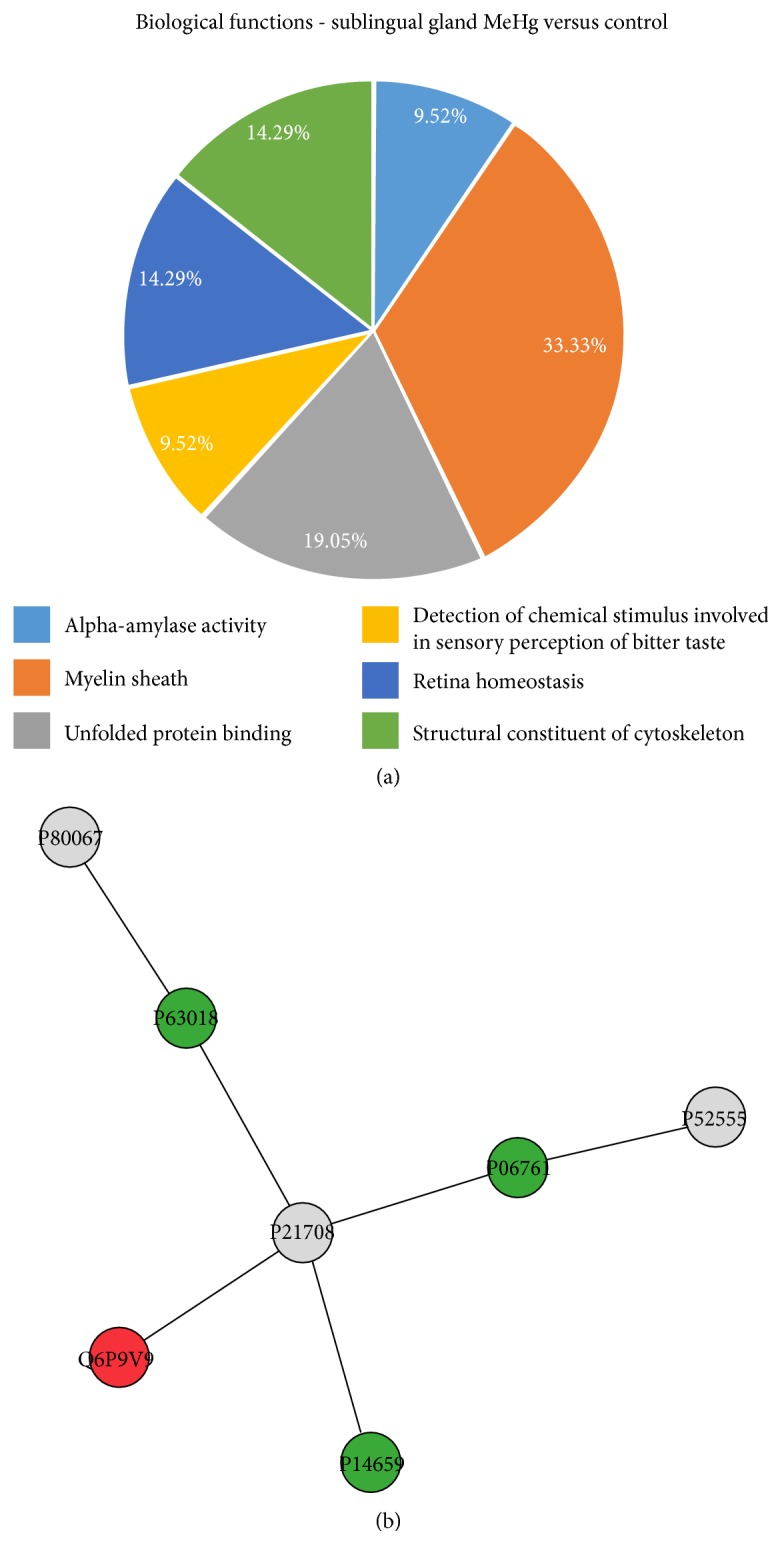
Functional distribution of proteins (a) identified with differential expression in rat submandibular glands exposed to MeHg versus control group. Categories of proteins based on GO annotation biological process, molecular function, and cellular component. Terms significant (Kappa = 0.4) and distribution according to percentage of number of gene association. Subnetwork (b) created by ClusterMarker app to establish the interaction among identified proteins of sublingual glands with differentiated expression on exposed group when compared to control group. The node colors indicate the differential expression of respective protein named with its accession ID. Red and dark green indicate proteins found in control and exposed groups, respectively. Light green and pink indicate upregulated and downregulated proteins, respectively. Gray nodes represent those proteins which were not identified on this study, but they interacted on the network. The access identification number in nodes corresponds to P80067: dipeptidyl peptidase 1, P63018: heat shock cognate 71 kDa protein, P21708: mitogen-activated protein kinase 3, Q6P9V9: tubulin alpha-1B chain, P14659: heat shock-related 70 kDa protein 2, P06761: 78 kDa glucose-regulated protein, P52555: endoplasmic reticulum resident protein 29.
The ppi network of the sublingual gland (Figure 7(b)) showed the same protein in the center of the network (mitogen-activated protein kinase 3; P21708), which the proteins with altered expression interacted. The interaction proteins were related mainly to biological processes, such as mitosis and cytoskeletal rearrangements. In addition, proteins associated to stress response (heat shock cognate 71 kDa protein, P63018 and heat shock-related 70 kDa protein 2, P14659) and microtubule constituent (tubulin alpha-1B chain, Q6P9V9) were clustered by ClusterMarker app.
4. Discussion
In this study, we showed for the first time that MeHg, in a chronic period, causes damage to the salivary gland proteomic profile and oxidative stress. A significant total Hg deposit in the gland tissue structure was verified, as well as a membrane cell damage by higher LPO levels, nitrogen species formation due to oxidative stress, and low antioxidant capacity against peroxyl radicals. In addition, the novelty of the toxicological evaluation on the proteomic profile of rat glands after MeHg exposure brings the association with differences in expression at important proteins of metabolic pathways, oxidative biochemistry, and mainly in the composition of cytoarchitecture.
Most of the studies about MeHg toxicity are under acute exposures and with high MeHg concentrations, even though the reality faced by the population of endemic regions of this metal intoxication is different. Recent studies showed that long-term intoxication includes other effects such as cardiovascular diseases and genotoxicity [24–27]. This latter one includes oxidative stress and alterations of cytoskeleton proteins as main causes for these effects. The known effects of MeHg are mainly given by chronic exposures, thus, the model proposed by Kong et al. [17], in which we based our study, mimics a daily and continuous exposure in low doses. The exposure time of our study brings the possibility to find interesting results on an oxidative biochemistry and proteomic profiles at rat glands, showing that even at low doses, a chronic MeHg exposure is able to induce molecular and cellular damages in living organisms.
For understanding, the nomination of low dose used in this researcher is important to consider other anatomic regions and the toxic effects. The lowest observed adverse effect level (LOAEL) for neurotoxic effects such as paresthesia is 50 ppm of mercury in hair [28]. This level in hair corresponds approximately to 1 ppm of mercury in brain, according to the proportion of 250 : 50 : 1 for hair : brain : whole blood contents (reviewed by Branco et al. [29]).
The mercury content in brains of rats exposed to the dose used in our work (0.04 mg/kg per day for 8 weeks) is about a half of that level, that is, about 0.5 ppm [17, 30], characterizing a low exposure. Moreover, animals exposed to this low level of methylmercury did not develop neurotoxic effects such as alterations of forelimb grip strength, running wheel performance, or hind limb cross [30], supporting that this mercury level in the brain is not sufficient to cause deleterious neurobehavioral consequences.
Looking at Figure 1, an interesting fact is that salivary glands accumulated about 10 times less mercury than 0.5 ppm. However, our results show for the first time that this low dose is sufficient to cause significant oxidative stress and alterations of protein regulation in salivary glands, revealing the high susceptibility of this tissue to the toxic effects of methylmercury.
The main form of MeHg intoxication is the oral through food [6], so the preferential site of absorption is in the intestinal lumen by enterocytes. The experimental model of intragastric gavage, used in this work, illustrates the MeHg intake by food consumption. MeHg is formed by a methyl group attached to the Hg atom (CH3Hg), and this allows a greater affinity with thiol groups, mainly of protein components [31].
The MeHg gains systemic circulation from the efflux through the basolateral membrane of enterocytes and on this part of membrane surface. There are multidrug resistance-associated proteins (MRPs), neutral amino acid transporters, as LAT2, and organic anions transporter (OAT) [32]; then, it is suggested that these proteins' action is related to MeHg efflux. Moreover, some MRPs need GSH as cosubstrate for their effectiveness, so MeHg may also undergo efflux to systemic blood circulation. According to Martinez-Madrigal and Micheau [33], blood vessels as external carotid, sublingual, submental, and facial supply all glands, suggesting that vascularization is the main path by which Hg forms deposits by intragastric gavage intoxication.
In this work, we found significant Hg concentration (ppm) in the three main salivary glands in comparison to the control group. Studies about the proteomic profile of salivary glands have suggested that parotid is responsible to produce the major part of the protein components of saliva [34–36], and this could be the reason to a higher absorption to this gland showed by our group, once this metal has an affinity to structures present in many proteins.
Studies appoint that MeHg induces multiple effects within cell homeostasis. MeHg is able to induce cell death [37], impairment on cell proliferation and differentiation [38], disorganization of cytoskeleton [39, 40], DNA mutation [41], impairments on transcriptome [42], and proteome [43]. In addition, according to the literature, these damages on biological processes and structures could be associated with oxidative/nitrosative biochemistry misbalance due to oxidative stress.
Cellular membranes are crucial targets of MeHg-induced toxicity, and due to its constitution of unsaturated lipids, the products MDA and 4-HNE are the most mutagenic and toxic products of LPO (for review see Ayala et al. [44]); in addition, organelle membranes also may suffer due to LPO [45]. In this study, we showed an increase on MDA levels in rat salivary glands after MeHg exposure, suggesting a high susceptibility of glandular tissue to oxidative/nitrosative stress.
The protein peroxidation products, that is, peroxyl radical, are highly harmful to cell membranes. Beyond the importance of stress in the glandular homeostasis after MeHg exposure, the production of peroxyl radical seems to be an important linkage between lipid peroxidation and protein oxidation, once peroxyl could be an initiator factor of LPO [46–48]. This way, our results suggest that MeHg chronic exposure can decrease the ACAP in salivary glands and lead the glandular stress, seen by nitrite and MDA levels, which may lead to damage at membrane lipid and to cellular proteins.
It is well known that oxidative/nitrosative stress is able to impair gene expression [49] and protein translation [50] driving to oxidized and nonfunctional proteins. In this way, we further characterized for the first time the proteomic changes under oxidative stress after MeHg exposure on salivary rat glands. The global proteomic results of proteins up- and downregulated in parotid, submandibular, and sublingual glands are described in Tables 1, 2, and 3, respectively.
The literature has pointed that the imbalance in oxidative stress may lead to disorders on cellular pathways of energetic metabolism, such as the heat shock class of proteins [51–53]. We showed that in parotid glands, MeHg was able to induce downexpression of heat shock cognate 71 proteins (D4A4S3 and M0R8M9) and induce exclusively the expression of heat shock proteins (HSP) 90 (P82995 and P34058) in MeHg group. In submandibular, we also found heat shock proteins (M0R660 and P14659) that were unique in MeHg group, while in the sublingual gland, we found the exclusive expression of heat shock cognate 71 (P63018) and heat shock-related 70 (P14659) and expression of heat shock protein beta-6 (P97541) only in the control group. HSPs have been already proposed as new therapeutic tools for some disorders as cancer and cardiovascular diseases, with a protective role especially for HSP90 [54]. The results of the present study support a main role for this protein also in methylmercury intoxication.
In addition, glutathione S-transferase P (P04906) and components of cytochrome (Q62737 and Q68FY0) were exclusively expressed in parotid control group, suggesting an important association on protein changes and MeHg-induced oxidative stress.
The metabolic pathway class of proteins was also changed after MeHg exposure. In parotid, the proteins ATP synthase subunit alpha (F1LP05) and ATP synthase subunit beta, mitocondrial (P10719), were downregulated and malate dehydrogenase, cytoplasmic (O88989), and aconitate hydratase (G3V6S2) were unique in the control group. In submandibular, ATP synthase subunit alpha, mitochondrial (P15999), was downregulated, while ADP/ATP translocase 2 (Q09073), ATP synthase subunit delta, mitochondrial (P35434), citrate synthase (G3V936), citrate synthase, and mitochondrial (Q8VHF5) were present only in the control glands. Our results corroborate with metabolic pathway disorders established in others experimental models [17, 55].
MeHg treatment also impaired negatively the proteins of cellular components, such as cytoskeleton, from the main constituents of salivary glands. We have showed that the proteins related to muscle cell contraction (actin, alpha skeletal muscle, P68136; actin, aortic smooth muscle, P62738; and actin, gamma-enteric smooth muscle, P63269), in parotid glands were downregulated after MeHg exposure, which may suggest possible damages in myoepithelial cells present in the glands. We also showed downregulation of keratin, type II cytoskeletal 8 (Q10758) that is an important component of conjunctive tissue.
Concerning to microtubule constitution, we showed here that tubulin beta chain (B4F7C2) and tubulin beta-4B chain (Q6P9T8) were downregulated, corroborating with the literature, which suggests that microtubule depolymerization is one of the mechanisms of Hg damage on living cells [25, 56, 57].
A collagen chain protein (collagen alpha-1(I) chain, P02454), cytokeratins (keratin, type I cytoskeletal 10, Q6IFW6; keratin, type I cytoskeletal 14, Q6IFV1; keratin, type I cytoskeletal 15, Q6IFV3; keratin, type I cytoskeletal 17, Q6IFU8; keratin, type I cytoskeletal 24, Q6IFX1; keratin, type I cytoskeletal 42, Q6IFU7; and keratin, type II cytoskeletal 7, Q6IG12), and tubulin chains (tubulin beta chain, Q4QQV0 and tubulin alpha-4A chain, Q5XIF6) were found exclusively in control parotid glands. In sublingual glands, we also found conjunctive constituent (collagen alpha-2(I) chain, P02466), cytoskeleton (Q5BJY9) and microtubule (tubulin alpha-1A chain, P68370; tubulin alpha-1B chain, Q6P9V9; and tubulin alpha-1C chain, Q6AYZ1) components uniquely in the nonexposed group.
As previously mentioned, salivary glands are responsible for salivary formation and flow; this way, the acinar and tubular constituents have great importance in physiology. In the proteomic analysis, downregulation of alpha-amylase (E9PSQ1) was observed, as well as prolactin-induced protein, isoform CRA_d (G3V812), and prolactin-inducible protein homolog (O70417) in the parotid. An interesting protein related to biomineralization (submandibular gland secretory Glx-rich protein CB, P08462) was upregulated in the submandibular of the exposed group. Salivary flow is first derived by ionic exchanges by sodium/potassium bombs in acini and intercalated portions of secretory duct system [58], and in this study, we noticed that sodium/potassium-transporting ATPase subunit alpha-1 (P06685) was exclusive of control group in sublingual gland, similarly to sodium channel subunit beta-3 (Q9JK00) and sodium/potassium-transporting ATPase subunit alpha-2 (P06686) that were unique of submandibular gland of animals not submitted to MeHg exposure.
The proteomic profile changes shown by this work suggest that MeHg exposure leads to salivary gland damage, since several proteins were shown to be affected, compromising essential biological functions and components that under normal circumstances are fundamental do cell and tissue viability.
5. Conclusion
The proteomic profile verified after MeHg exposure in this study allowed us to see what is underlying the oxidative stress effects in salivary glands. Our findings have showed that salivary glands are also targets for MeHg in systemic intoxication, at low doses and chronic exposure, being able of triggering imbalance in oxidative biochemistry and, consequently, the modulation of proteomic profile of the glands.
Supplementary Material
Supplementary Table 1. Proteins exclusively present in rat parotid glands in MeHg (Hg) group. Supplementary Table 2. Proteins exclusively present in rat parotid glands control group. Supplementary Table 3. Proteins exclusively present in rats submandibular glands in Hg (MeHg) group. Supplementary Table 4. Proteins exclusively present in rats submandibular glands in control group. Supplementary Table 5. Proteins exclusively present in rats sublingual glands in Hg (MeHg) group. Supplementary Table 6. Proteins exclusively present in rats sublingual glands in control group.
Acknowledgments
This work was supported by the Brazilian National Council for Scientific and Technological Development (CNPq), Fundação de Amparo a Pesquisa do Estado do Pará (FAPESPA), and Pró-Reitoria de Pesquisa e Pós-Graduação da UFPA (PROPESP, UFPA, Brazil). Rafael R. Lima is an investigator from CNPq (Edital MCTI/CNPQ/Universal 14/2014). Leonardo O. Bittencourt's scholarship is supported by the Brazilian National Council for Scientific and Technological Development (CNPq).
Conflicts of Interest
The authors declare that there is no conflict of interest regarding the publication of this paper.
References
- 1.Dorea J. G., Marques R. C. Mercury levels and human health in the Amazon Basin. Annals of Human Biology. 2016;43(4):349–359. doi: 10.1080/03014460.2016.1192682. [DOI] [PubMed] [Google Scholar]
- 2.Ynalvez R., Gutierrez J., Gonzalez-Cantu H. Mini-review: toxicity of mercury as a consequence of enzyme alteration. Biometals. 2016;29(5):781–788. doi: 10.1007/s10534-016-9967-8. [DOI] [PubMed] [Google Scholar]
- 3.Compeau G. C., Bartha R. Sulfate-reducing bacteria: principal methylators of mercury in anoxic estuarine sediment. Applied and Environmental Microbiology. 1985;50(2):498–502. doi: 10.1128/aem.50.2.498-502.1985. [DOI] [PMC free article] [PubMed] [Google Scholar]
- 4.Bisinoti M. C., Jardim W. F. O comportamento do metilmercúrio (metilHg) no ambiente. Química Nova. 2004;27:593–600. doi: 10.1590/S0100-40422004000400014. [DOI] [Google Scholar]
- 5.Berzas Nevado J. J., Rodríguez Martín-Doimeadios R. C., Guzmán Bernardo F. J., et al. Mercury in the Tapajos River basin, Brazilian Amazon: a review. Environment International. 2010;36(6):593–608. doi: 10.1016/j.envint.2010.03.011. [DOI] [PubMed] [Google Scholar]
- 6.Hong Y. S., Kim Y. M., Lee K. E. Methylmercury exposure and health effects. Journal of Preventive Medicine and Public Health. 2012;45(6):353–363. doi: 10.3961/jpmph.2012.45.6.353. [DOI] [PMC free article] [PubMed] [Google Scholar]
- 7.Rodríguez Martín-Doimeadios R. C., Berzas Nevado J. J., Guzmán Bernardo F. J., et al. Comparative study of mercury speciation in commercial fishes of the Brazilian Amazon. Environmental Science and Pollution Research. 2014;21(12):7466–7479. doi: 10.1007/s11356-014-2680-7. [DOI] [PubMed] [Google Scholar]
- 8.Squadrone S., Chiaravalle E., Gavinelli S., Monaco G., Rizzi M., Abete M. C. Analysis of mercury and methylmercury concentrations, and selenium: mercury molar ratios for a toxicological assessment of sperm whales (Physeter macrocephalus) in the most recent stranding event along the Adriatic coast (Southern Italy, Mediterranean Sea) Chemosphere. 2015;138:633–641. doi: 10.1016/j.chemosphere.2015.07.047. [DOI] [PubMed] [Google Scholar]
- 9.Feng C., Pedrero Z., Gentès S., et al. Specific pathways of dietary methylmercury and inorganic mercury determined by mercury speciation and isotopic composition in zebrafish (Danio rerio) Environmental Science & Technology. 2015;49(21):12984–12993. doi: 10.1021/acs.est.5b03587. [DOI] [PubMed] [Google Scholar]
- 10.Garcia M. S., Constantino D. H., Silva A. P., Perobelli J. E. Fish pollutants MeHg and Aroclor cause permanent structural damage in male gonads and kidneys after prepubertal exposure. International Journal of Experimental Pathology. 2016;97(5):360–368. doi: 10.1111/iep.12200. [DOI] [PMC free article] [PubMed] [Google Scholar]
- 11.Ruelas-Inzunza J., Kohen-Sandoval C. K., Ramos-Osuna M. A., et al. Total mercury concentrations in white and striped mullet (Mugil curema and M. cephalus) from a coastal lagoon in the SE Gulf of California. Journal of Environmental Science and Health. Part A, Toxic/Hazardous Substances & Environmental Engineering. 2017;52(5):459–465. doi: 10.1080/10934529.2016.1271670. [DOI] [PubMed] [Google Scholar]
- 12.Bratt P., Johansson I., Linder J., Ericson T. Function of the rat salivary glands after exposure to inorganic mercury. The Science of the Total Environment. 1995;172(1):47–55. doi: 10.1016/0048-9697(95)04716-6. [DOI] [PubMed] [Google Scholar]
- 13.Warfvinge G., Warfvinge K., Larsson A. Histochemical visualization of mercury in the oral mucosa, salivary and lacrimal glands of BN rats with HgCl2-induced autoimmunity. Experimental and Toxicologic Pathology. 1994;46(4-5):329–334. doi: 10.1016/S0940-2993(11)80112-0. [DOI] [PubMed] [Google Scholar]
- 14.Schmid K., Sassen A., Staudenmaier R., et al. Mercuric dichloride induces DNA damage in human salivary gland tissue cells and lymphocytes. Archives of Toxicology. 2007;81(11):759–767. doi: 10.1007/s00204-007-0208-3. [DOI] [PubMed] [Google Scholar]
- 15.Peyrot des Gachons C., Breslin P. A. Salivary amylase: digestion and metabolic syndrome. Current Diabetes Reports. 2016;16(10):p. 102. doi: 10.1007/s11892-016-0794-7. [DOI] [PMC free article] [PubMed] [Google Scholar]
- 16.de Paula F., Teshima T. H. N., Hsieh R., Souza M. M., Nico M. M. S., Lourenco S. V. Overview of human salivary glands: highlights of morphology and developing processes. The Anatomical Record. 2017;300(7):1180–1188. doi: 10.1002/ar.23569. [DOI] [PubMed] [Google Scholar]
- 17.Kong H. K., Wong M. H., Chan H. M., Lo S. C. Chronic exposure of adult rats to low doses of methylmercury induced a state of metabolic deficit in the somatosensory cortex. Journal of Proteome Research. 2013;12(11):5233–5245. doi: 10.1021/pr400356v. [DOI] [PubMed] [Google Scholar]
- 18.Suzuki T., Akagi H., Arimura K., et al. Mercury Analysis Manual. Japan: Ministry of the Environment; 2004. [DOI] [Google Scholar]
- 19.Amado L. L., Garcia M. L., Ramos P. B., et al. A method to measure total antioxidant capacity against peroxyl radicals in aquatic organisms: application to evaluate microcystins toxicity. The Science of the Total Environment. 2009;407(6):2115–2123. doi: 10.1016/j.scitotenv.2008.11.038. [DOI] [PubMed] [Google Scholar]
- 20.Ferreira-Cravo M., Piedras F. R., Moraes T. B., et al. Antioxidant responses and reactive oxygen species generation in different body regions of the estuarine polychaeta Laeonereis Acuta (Nereididae) Chemosphere. 2007;66(7):1367–1374. doi: 10.1016/j.chemosphere.2006.06.050. [DOI] [PubMed] [Google Scholar]
- 21.Fagundes N. C., Fernandes L. M., Paraense R. S., et al. Binge drinking of ethanol during adolescence induces oxidative damage and morphological changes in salivary glands of female rats. Oxidative Medicine and Cellular Longevity. 2016;2016:11. doi: 10.1155/2016/7323627.7323627 [DOI] [PMC free article] [PubMed] [Google Scholar]
- 22.Esterbauer H., Cheeseman K. H. Determination of aldehydic lipid peroxidation products: malonaldehyde and 4-hydroxynonenal. Methods in Enzymology. 1990;186:407–421. doi: 10.1016/0076-6879(90)86134-h. [DOI] [PubMed] [Google Scholar]
- 23.Bradford M. M. A rapid and sensitive method for the quantitation of microgram quantities of protein utilizing the principle of protein-dye binding. Analytical Biochemistry. 1976;72:248–254. doi: 10.1016/0003-2697(76)90527-3. [DOI] [PubMed] [Google Scholar]
- 24.Genchi G., Sinicropi M. S., Carocci A., Lauria G., Catalano A. Mercury exposure and heart diseases. International Journal of Environmental Research and Public Health. 2017;14(1) doi: 10.3390/ijerph14010074. [DOI] [PMC free article] [PubMed] [Google Scholar]
- 25.Crespo-Lopez M. E., Macêdo G. L., Pereira S. I., et al. Mercury and human genotoxicity: critical considerations and possible molecular mechanisms. Pharmacological Research. 2009;60(4):212–220. doi: 10.1016/j.phrs.2009.02.011. [DOI] [PubMed] [Google Scholar]
- 26.Crespo-Lopez M. E., Macêdo G. L., Arrifano G. P., Pinheiro Mda C., do Nascimento J. L., Herculano A. M. Genotoxicity of mercury: contributing for the analysis of Amazonian populations. Environment International. 2011;37(1):136–141. doi: 10.1016/j.envint.2010.08.009. [DOI] [PubMed] [Google Scholar]
- 27.Crespo-Lopez M. E., Costa-Malaquias A., Oliveira E. H., et al. Is low non-lethal concentration of methylmercury really safe? A report on genotoxicity with delayed cell proliferation. PloS One. 2016;11(9, article e0162822) doi: 10.1371/journal.pone.0162822. [DOI] [PMC free article] [PubMed] [Google Scholar]
- 28.Clarkson T. W., Magos L. The toxicology of mercury and its chemical compounds. Critical Reviews in Toxicology. 2006;36(8):609–662. doi: 10.1080/10408440600845619. [DOI] [PubMed] [Google Scholar]
- 29.Branco V., Caito S., Farina M., Teixeira da Rocha J., Aschner M., Carvalho C. Biomarkers of mercury toxicity: past, present, and future trends. Journal of Toxicology and Environmental Health. Part B, Critical Reviews. 2017;20(3):119–154. doi: 10.1080/10937404.2017.1289834. [DOI] [PMC free article] [PubMed] [Google Scholar]
- 30.Day J. J., Reed M. N., Newland M. C. Neuromotor deficits and mercury concentrations in rats exposed to methyl mercury and fish oil. Neurotoxicology and Teratology. 2005;27(4):629–641. doi: 10.1016/j.ntt.2005.03.011. [DOI] [PubMed] [Google Scholar]
- 31.Bridges C. C., Zalups R. K. Mechanisms involved in the transport of mercuric ions in target tissues. Archives of Toxicology. 2017;91(1):63–81. doi: 10.1007/s00204-016-1803-y. [DOI] [PMC free article] [PubMed] [Google Scholar]
- 32.Bradley M. A., Barst B. D., Basu N. A review of mercury bioavailability in humans and fish. International Journal of Environmental Research and Public Health. 2017;14(2) doi: 10.3390/ijerph14020169. [DOI] [PMC free article] [PubMed] [Google Scholar]
- 33.Martinez-Madrigal F., Micheau C. Histology of the major salivary glands. The American Journal of Surgical Pathology. 1989;13(10):879–899. doi: 10.1097/00000478-198910000-00008. [DOI] [PubMed] [Google Scholar]
- 34.Walz A., Stühler K., Wattenberg A., et al. Proteome analysis of glandular parotid and submandibular-sublingual saliva in comparison to whole human saliva by two-dimensional gel electrophoresis. Proteomics. 2006;6(5):1631–1639. doi: 10.1002/pmic.200500125. [DOI] [PubMed] [Google Scholar]
- 35.Denny P., Hagen F. K., Hardt M., et al. The proteomes of human parotid and submandibular/sublingual gland salivas collected as the ductal secretions. Journal of Proteome Research. 2008;7(5):1994–2006. doi: 10.1021/pr700764j. [DOI] [PMC free article] [PubMed] [Google Scholar]
- 36.Rosa N., Correia M. J., Arrais J. P., et al. From the salivary proteome to the OralOme: comprehensive molecular oral biology. Archives of Oral Biology. 2012;57(7):853–864. doi: 10.1016/j.archoralbio.2011.12.010. [DOI] [PubMed] [Google Scholar]
- 37.Morcillo P., Romero D., Meseguer J., Esteban M. Á., Cuesta A. Cytotoxicity and alterations at transcriptional level caused by metals on fish erythrocytes in vitro. Environmental Science and Pollution Research International. 2016;23(12):12312–12322. doi: 10.1007/s11356-016-6445-3. [DOI] [PubMed] [Google Scholar]
- 38.Ferreira F. F., Ammar D., Bourckhardt G. F., Kobus-Bianchini K., Müller Y. M., Nazari E. M. MeHg developing exposure causes DNA double-strand breaks and elicits cell cycle arrest in spinal cord cells. Journal of Toxicology. 2015;2015:10. doi: 10.1155/2015/532691.532691 [DOI] [PMC free article] [PubMed] [Google Scholar]
- 39.Sager P. R. Selectivity of methyl mercury effects on cytoskeleton and mitotic progression in cultured cells. Toxicology and Applied Pharmacology. 1988;94(3):473–486. doi: 10.1016/0041-008X(88)90288-8. [DOI] [PubMed] [Google Scholar]
- 40.Thier R., Bonacker D., Stoiber T., et al. Interaction of metal salts with cytoskeletal motor protein systems. Toxicology Letters. 2003;140-141:75–81. doi: 10.1016/S0378-4274(02)00502-7. [DOI] [PubMed] [Google Scholar]
- 41.Wang X., Yan M., Zhao L., et al. Low-dose methylmercury-induced apoptosis and mitochondrial DNA mutation in human embryonic neural progenitor cells. Oxidative Medicine and Cellular Longevity. 2016;2016:10. doi: 10.1155/2016/5137042.5137042 [DOI] [PMC free article] [PubMed] [Google Scholar]
- 42.Waldmann T., Grinberg M., König A., et al. Stem cell transcriptome responses and corresponding biomarkers that indicate the transition from adaptive responses to cytotoxicity. Chemical Research in Toxicology. 2017;30(4):905–922. doi: 10.1021/acs.chemrestox.6b00259. [DOI] [PubMed] [Google Scholar]
- 43.de Oliveira Souza V. C., de Marco K. C., Laure H. J., Rosa J. C., Barbosa F., Jr. A brain proteome profile in rats exposed to methylmercury or thimerosal (ethylmercury) Journal of Toxicology and Environmental Health. Part A. 2016;79(12):502–512. doi: 10.1080/15287394.2016.1182003. [DOI] [PubMed] [Google Scholar]
- 44.Ayala A., Munoz M. F., Arguelles S. Lipid peroxidation: production, metabolism, and signaling mechanisms of malondialdehyde and 4-hydroxy-2-nonenal. Oxidative Medicine and Cellular Longevity. 2014;2014:31. doi: 10.1155/2014/360438.360438 [DOI] [PMC free article] [PubMed] [Google Scholar]
- 45.Dare E., Li W., Zhivotovsky B., Yuan X., Ceccatelli S. Methylmercury and H2O2 provoke lysosomal damage in human astrocytoma D384 cells followed by apoptosis. Free Radical Biology and Medicine. 2001;30(12):1347–1356. doi: 10.1016/S0891-5849(01)00526-3. [DOI] [PubMed] [Google Scholar]
- 46.Duggan S., Rait C., Platt A., Gieseg S. Protein and thiol oxidation in cells exposed to peroxyl radicals is inhibited by the macrophage synthesised pterin 7,8-dihydroneopterin. Biochimica et Biophysica Acta (BBA) - Molecular Cell Research. 2002;1591(1–3):139–145. doi: 10.1016/S0167-4889(02)00272-0. [DOI] [PubMed] [Google Scholar]
- 47.Gieseg S. P., Pearson J., Firth C. A. Protein hydroperoxides are a major product of low density lipoprotein oxidation during copper, peroxyl radical and macrophage-mediated oxidation. Free Radical Research. 2003;37(9):983–991. doi: 10.1080/10715760310001603612. [DOI] [PubMed] [Google Scholar]
- 48.Gieseg S., Duggan S., Gebicki J. M. Peroxidation of proteins before lipids in U937 cells exposed to peroxyl radicals. The Biochemical Journal. 2000;350(Part 1):215–218. doi: 10.1042/bj3500215. [DOI] [PMC free article] [PubMed] [Google Scholar]
- 49.de Nadal E., Ammerer G., Posas F. Controlling gene expression in response to stress. Nature Reviews Genetics. 2011;12(12):833–845. doi: 10.1038/nrg3055. [DOI] [PubMed] [Google Scholar]
- 50.Vogel C., Silva G. M., Marcotte E. M. Protein expression regulation under oxidative stress. Molecular & Cellular Proteomics. 2011;10(12) doi: 10.1074/mcp.M111.009217. [DOI] [PMC free article] [PubMed] [Google Scholar]
- 51.Tretter L., Adam-Vizi V. Inhibition of Krebs cycle enzymes by hydrogen peroxide: a key role of [alpha]-ketoglutarate dehydrogenase in limiting NADH production under oxidative stress. The Journal of Neuroscience. 2000;20(24):8972–8979. doi: 10.1523/JNEUROSCI.20-24-08972.2000. [DOI] [PMC free article] [PubMed] [Google Scholar]
- 52.Frisard M., Ravussin E. Energy metabolism and oxidative stress: impact on the metabolic syndrome and the aging process. Endocrine. 2006;29(1):27–32. doi: 10.1385/ENDO:29:1:27. [DOI] [PubMed] [Google Scholar]
- 53.Satapati S., Kucejova B., Duarte J. A., et al. Mitochondrial metabolism mediates oxidative stress and inflammation in fatty liver. The Journal of Clinical Investigation. 2016;126(4):p. 1605. doi: 10.1172/JCI86695. [DOI] [PMC free article] [PubMed] [Google Scholar]
- 54.Almeida M. B., do Nascimento J. L., Herculano A. M., Crespo-López M. E. Molecular chaperones: toward new therapeutic tools. Biomedicine & Pharmacotherapy. 2011;65(4):239–243. doi: 10.1016/j.biopha.2011.04.025. [DOI] [PubMed] [Google Scholar]
- 55.Shao Y., Yamamoto M., Figeys D., Ning Z., Chan H. M. Proteomic analysis of cerebellum in common marmoset exposed to methylmercury. Toxicological Sciences. 2015;146(1):43–51. doi: 10.1093/toxsci/kfv069. [DOI] [PubMed] [Google Scholar]
- 56.Vogel D. G., Margolis R. L., Mottet N. K. Analysis of methyl mercury binding sites on tubulin subunits and microtubules. Pharmacology & Toxicology. 1989;64(2):196–201. doi: 10.1111/j.1600-0773.1989.tb00630.x. [DOI] [PubMed] [Google Scholar]
- 57.Miura K., Inokawa M., Imura N. Effects of methylmercury and some metal ions on microtubule networks in mouse glioma cells and in vitro tubulin polymerization. Toxicology and Applied Pharmacology. 1984;73(2):218–231. doi: 10.1016/0041-008X(84)90327-2. [DOI] [PubMed] [Google Scholar]
- 58.Melvin J. E., Yule D., Shuttleworth T., Begenisich T. Regulation of fluid and electrolyte secretion in salivary gland acinar cells. Annual Review of Physiology. 2005;67:445–469. doi: 10.1146/annurev.physiol.67.041703.084745. [DOI] [PubMed] [Google Scholar]
Associated Data
This section collects any data citations, data availability statements, or supplementary materials included in this article.
Supplementary Materials
Supplementary Table 1. Proteins exclusively present in rat parotid glands in MeHg (Hg) group. Supplementary Table 2. Proteins exclusively present in rat parotid glands control group. Supplementary Table 3. Proteins exclusively present in rats submandibular glands in Hg (MeHg) group. Supplementary Table 4. Proteins exclusively present in rats submandibular glands in control group. Supplementary Table 5. Proteins exclusively present in rats sublingual glands in Hg (MeHg) group. Supplementary Table 6. Proteins exclusively present in rats sublingual glands in control group.