

Abstract
Here, we used RNA-sequencing to study and characterize the long non-coding RNA (lncRNA) transcriptome in lesional skin from psoriasis patients before (PP) and after treatment (PT) with adalimumab and in normal skin from healthy individuals (NN). To this end we sequenced total RNA from 18 psoriasis patients and 16 healthy controls. We merged three long non-coding RNA reference data sets to create a single combined reference of 67,157 lncRNA transcripts with no overlaps. We identified differential expression of 971 lncRNAs between PP and NN, 157 between PP and PT, and 377 between PT and NN. Using differentially expressed (DE) lncRNAs between PP and NN, we identified a molecular lncRNA signature that distinguishes psoriatic skin from healthy skin. Furthermore, we performed an unsupervised hierarchical analysis that revealed distinct clustering of PP samples from NN. A coding non-coding (CNC) network analysis revealed a large network of highly correlated lncRNA and protein coding transcripts that provided insight into the potential functions of un-annotated lncRNAs. To our knowledge, this is the first study that describes both polyadenylated as well as non-polyadenylated lncRNA transcripts in psoriasis. Our findings highlight the potential importance of lncRNAs in the biology of psoriasis and response to treatment.
Introduction
Psoriasis is a common, immune-mediated inflammatory disease of the skin, affecting 1–3% of the world’s population. It is a complex, multifactorial disorder that is influenced by both genetic and environmental factors. Transcriptome analysis using RNA seq has revealed approximately 3500 protein coding genes that are differentially expressed in lesional skin (Li et al., 2014).
The sequencing of the human genome showed that there are only 20,000–25,000 protein coding genes, which represent less than 2% of total genomic sequence (International Human Genome Sequencing 2004). Furthermore, it was shown that transcription is not limited to protein-coding regions, but is instead pervasive throughout the mammalian genome (The Encode Project 2007) and many novel non-protein coding transcripts were identified. Recently, it was also shown that approximately 80% of genome is transcribed from one or both strands (Bernstein et al., 2012), indicating that this could result in a large number of overlapping transcripts that includes thousands of long RNAs with little or no protein coding potential.
Long non-coding RNAs (lncRNA) are defined as sequences longer than 200 nucleotides and are among the most highly transcribed of the non-coding RNAs (Mattick and Makunin 2006). While the function of many of these lncRNAs remains to be identified, an increasing number of targeted functional studies suggest that they have diverse and important biological roles ranging from regulation of development and differentiation to regulation of epigenetic processes by guiding chromatin-modifying enzymes to their sites of action and/or by acting as scaffolds for chromosomal organization, and playing a role in RNA modification, evolution and inheritance.
However, little is known about lncRNAs in psoriasis. Sonkoly et al in 2005 (Sonkoly et al., 2005) identified and characterized a cDNA, PRINS (Psoriasis susceptibility related RNA gene Induced by Stress) with unknown function. This cDNA was predicted to function as a ncRNA based on an in-silico approach. In a recently published study (Tsoi et al., 2015), 1214 lncRNAs (709 annotated and 505 novel) were found to be differentially expressed in PP vs NN skin. However, this study focused on polyadenylated lncRNAs and did not examine non-polyadenylated lncRNAs.
To decipher the role of lncRNAs in psoriasis we first used a candidate approach to screen 90 common lncRNA in psoriasis lesional skin (PP, n=9) and normal skin from healthy controls (NN, n=11) using RT-qPCR. After quality control and filtering, relative expression of 33 LncRNAs was analyzed using GAPDH as a reference gene (supplementary table S1). We identified ST7OT, LOC285194, and Car Intergenic 10 as showing significantly decreased expression in psoriasis patients (p<0.05). Meg9 and NEAT1 showed a trend towards decreased expression, but the results were not statistically significant (p>0.05, supplementary figure S1).
Encouraged by these initial findings, we decided to perform an in-depth analysis of expression of lncRNAs in psoriasis skin. For this, we used the sensitive and robust RNA seq approach to comprehensively examine the expression of lncRNAs in lesional skin of psoriasis patients before (PP) and after treatment (PT) with a systemic TNF-alpha inhibitor, as well as in the skin of healthy controls (NN). For this analysis we used total RNA to detect both polyadenylated as well as non-polyadenylated lncRNA. Here we report the identification of a large number of lncRNAs that are differentially expressed in psoriatic skin compared to healthy skin. We also observed differential expression of lncRNAs in PP versus PT post-treatment psoriatic skin. We were able to validate our findings through qPCR and by re-analyzing recently published RNA-seq data on psoriasis skin. We further performed co-expression analysis of our lncRNA data with mRNA data to help infer the functions of unannotated lncRNAs.
Results
Differential expression of lncRNAs in pre-treatment lesional skin in comparison to healthy controls
To profile differentially expressed lncRNAs in PP (psoriatic plaque skin) and NN (normal skin of healthy controls), we performed RNA-Seq on 18 psoriasis lesional samples and 16 healthy control samples using total RNA. We used an Illumina HiSeq 2500 for sequencing and obtained an average of 52 million 101 bp paired-end reads per sample. Using the RefSeq database for non-coding transcripts, we identified 263 differentially expressed lncRNAs with a q value or false discovery rate (FDR) <0.05. Of these, 109 were overexpressed and 154 were under expressed in PP relative to NN. However, as the RefSeq database does not comprehensively annotate lncRNAs, we utilized two additional reference datasets, Gencode v19 and Hangauer et al 2013(Hangauer et al., 2013), to annotate lncRNAs from our data. Using these reference databases, we created a combined reference set of 67,157 lncRNAs using the three individual reference sets (see methods). Using the combined reference, we observed 62,826 expressed lncRNAs (FPKM>0.2) in our samples. In the PP vs NN comparison, 971 lncRNAs were differentially expressed (q value < 0.05). Of these 971 lncRNAs, 572 were overexpressed while 399 were under expressed in PP. Figure 1 shows a heatmap of 971 differentially expressed lncRNA transcripts between PP and NN skin. This revealed distinct separation of PP vs NN samples based on lncRNA expression only, with only one outlier. Table 1a and 1b show the top 30 upregulated and top 30 downregulated lncRNAs observed using the combined reference. A detailed list of all differentially expressed transcripts is provided in supplementary table S2. Our results demonstrate that a large number of lncRNAs are differentially expressed in psoriatic skin compared to healthy skin and that these DE lncRNAs form a genomic signature that can distinguish psoriatic from healthy skin.
Figure 1. Heatmap of differentially expressed transcripts between PP and NN skin.
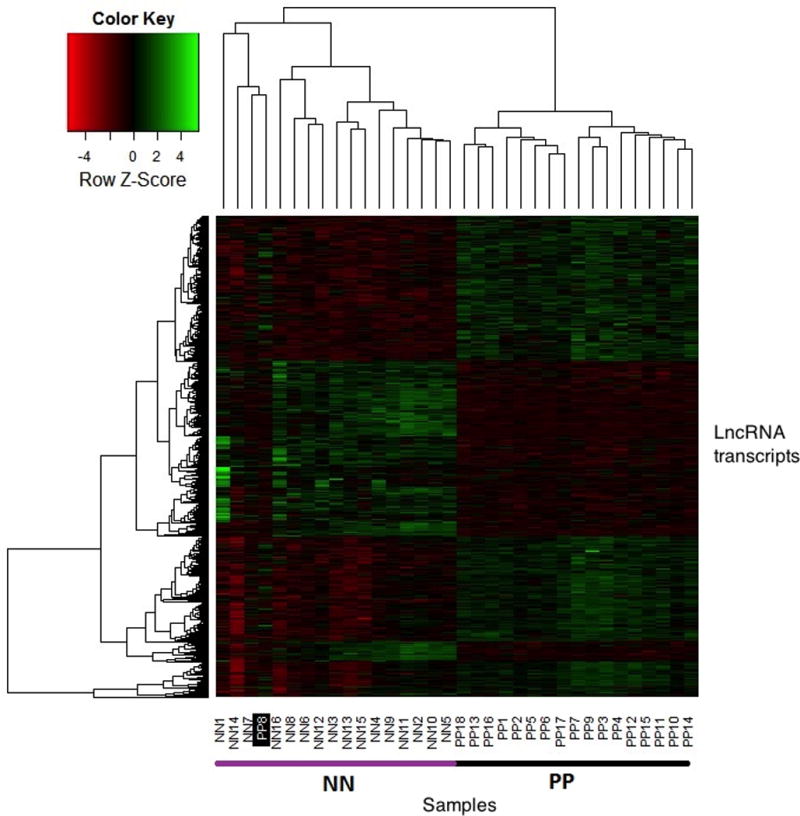
Differentially regulated transcripts between PP and NN skin (n=971) are shown in a heatmap image. The green color indicates high expression levels whereas red indicates low expression levels. The black bar above the heatmap indicates NN skin and the purple bar above the heatmap indicates PP skin. Note that the number of upregulated transcripts is more than the number of downregulated transcripts in PP.
Table 1.
| a: Top 30 over expressed lncRNAs in PP skin | |||||||
|---|---|---|---|---|---|---|---|
| LncRNA | locus | value _PP |
value _NN |
linear fold change |
p_value | q_value | DE Genes around 1Mb |
| FPKM1_group_3643_transcript_2_1 | chr10:81078466-81078774 | 12.18 | 0.12 | 99.14 | 5.00E-05 | 1.19E-03 | ZMIZ1;EIF5AL1;PPIF |
| SPRR2C | chr1:153112593-153113969 | 114.94 | 3.96 | 28.99 | 5.00E-05 | 1.19E-03 | PGLYRP3;PGLYRP4;SPRR4;KPRP;SPRR2E;SPRR2D;SPRR2G;SPRR2F;SPRR2A;SPRR2B;SPRR1A;SPRR1B;S100A3;S100A2;C1orf68;LCE1F;LCE1D;LCE1E;LCE1B;LCE1C;LCE1A;LCE2C;LCE2B;LCE2A;LCE2D;S100A13;S100A12;S100A14;S100A16;IVL;S100A7A;PRR9;S100A4;LCE6A |
| ENSG00000253187.2/HOXA-AS4 | chr7:27202056-27219880 | 20.36 | 1.03 | 19.79 | 5.00E-05 | 1.19E-03 | HOXA5;HOXA9;HIBADH;HOXA10 |
| FPKM1_group_12840_transcript_2_1 | chr17:31207487-31208110 | 14.29 | 0.74 | 19.43 | 5.00E-05 | 1.19E-03 | PSMD11;CDK5R1 |
| FPKM1_group_1446_transcript_2_1 | chr1:145396583-145397363 | 8.22 | 0.44 | 18.58 | 5.00E-05 | 1.19E-03 | ANKRD35;HFE2;PDE4DIP;PDZK1;SEC22B |
| ENSG00000225886.1/RP11-288L9.4 | chr1:27995978-27996787 | 14.08 | 0.87 | 16.26 | 5.00E-05 | 1.19E-03 | CD164L2;MAP3K6;STX12;PTAFR;IFI6;EYA3;AHDC1 |
| CASP5 | chr11:104864966-104893895 | 13.06 | 0.94 | 13.89 | 5.00E-05 | 1.19E-03 | CASP4;CARD18;CARD16;CASP5;CASP1 |
| ENSG00000233101.6/HOXB-AS3 | chr17:46620912-46683776 | 4.48 | 0.32 | 13.86 | 5.00E-05 | 1.19E-03 | HOXB3;HOXB2;HOXB7;SNF8 |
| FPKM1_group_27969_transcript_1_1 | chr6:27198176-27198434 | 159.35 | 12.08 | 13.19 | 5.00E-05 | 1.19E-03 | HIST1H2AH;HIST1H2AG;HIST1H2BK;HIST1H2BJ |
| KRT16P2 | chr17:16733796-16736147 | 29.24 | 2.42 | 12.1 | 5.00E-05 | 1.19E-03 | CCDC144A;CENPV |
| HOXA10-HOXA9 | chr7:27202056-27219880 | 42.16 | 3.7 | 11.39 | 5.00E-05 | 1.19E-03 | HOXA5;HOXA9;HIBADH;HOXA10 |
| FPKM1_group_21620_transcript_1_1 | chr3:56726906-56727929 | 8.07 | 0.71 | 11.36 | 5.00E-05 | 1.19E-03 | IL17RD |
| FPKM1_group_5248_transcript_2_1 | chr11:93849929-93850252 | 62.82 | 5.56 | 11.3 | 5.00E-05 | 1.19E-03 | MED17;HEPHL1 |
| EPGN | chr4:75174186-75182520 | 152.09 | 13.68 | 11.11 | 5.00E-05 | 1.19E-03 | BTC;EPGN;EREG;CXCL1;CXCL3;CXCL2;CXCL5;CXCL6 |
| ENSG00000248243.1/RP11-93K22.13 | chr3:129808275-129813147 | 4.29 | 0.4 | 10.68 | 5.00E-05 | 1.19E-03 | COL6A6 |
| VNN3 | chr6:133043925-133055904 | 48.48 | 4.71 | 10.29 | 5.00E-05 | 1.19E-03 | SLC18B1;VNN3;VNN1;RPS12 |
| ENSG00000260673.1/RP4-529N6.2 | chr6:4599520-4602654 | 103.98 | 10.16 | 10.23 | 5.00E-05 | 1.19E-03 | RPP40;CDYL;ECI2 |
| FPKM1_group_29421_transcript_3_1 | chr6:161726548-161729593 | 2.71 | 0.28 | 9.77 | 5.00E-05 | 1.19E-03 | |
| ENSG00000258689.1/RP6-65G23.1 | chr14:71165414-71178870 | 5.61 | 0.6 | 9.38 | 5.00E-05 | 1.19E-03 | MED6;TTC9;MAP3K9 |
| ENKUR | chr10:25270907-25305085 | 11.28 | 1.22 | 9.28 | 5.00E-05 | 1.19E-03 | ENKUR |
| CYP4Z2P | chr1:47308766-47366147 | 10.67 | 1.2 | 8.89 | 5.00E-05 | 1.19E-03 | NSUN4;CYP4B1;PDZK1IP1;STIL;CYP4X1 |
| FPKM1_group_32292_transcript_1_1 | chr8:82201234-82201898 | 83.53 | 9.59 | 8.71 | 5.00E-05 | 1.19E-03 | PMP2;FABP5 |
| FPKM1_group_5248_transcript_1_1 | chr11:93849161-93849752 | 16.92 | 1.98 | 8.56 | 5.00E-05 | 1.19E-03 | MED17;HEPHL1 |
| ENSG00000228318.1/AP001610.5 | chr21:42813320-42814669 | 112.57 | 13.55 | 8.31 | 5.00E-05 | 1.19E-03 | TMPRSS2;FAM3B;MX2;C2CD2;PLAC4;MX1;RIPK4 |
| PSG7 | chr19:43428283-43441330 | 11.9 | 1.49 | 7.98 | 5.00E-05 | 1.19E-03 | CEACAM1;PSG4;PSG7;CD177 |
| CMPK2 | chr2:6988439-7006766 | 85.73 | 10.86 | 7.89 | 5.00E-05 | 1.19E-03 | RSAD2;CMPK2 |
| GBAP1 | chr1:155183615-155197325 | 10.94 | 1.47 | 7.44 | 5.00E-05 | 1.19E-03 | SLC50A1;MUC1;GBA;ASH1L;PMVK;HCN3;SHC1;KCNN3;PKLR;EFNA1;FDPS |
| ENSG00000176075.6/LINC00302 | chr1:152627952-152629280 | 84.73 | 12.36 | 6.86 | 5.00E-05 | 1.19E-03 | SPRR4;KPRP;SPRR2E;SPRR2D;SPRR2G;SPRR2F;SPRR2A;SPRR2B;SPRR1A;SPRR1B;RPTN;C1orf68;LCE1F;LCE1D;LCE1E;LCE1B;LCE1C;HRNR;LCE1A;LCE2C;LCE2B;LCE2A;LCE2D;IVL;LCE3D;LCE3E;LCE3A;LCE3C;CRCT1;CRNN;LCE6A |
| FPKM1_group_29417_transcript_5_1 | chr6:161707105-161709329 | 2.55 | 0.38 | 6.63 | 5.00E-05 | 1.19E-03 | |
| AZGP1P1 | chr7:99578384-99581860 | 46.17 | 7.15 | 6.46 | 5.00E-05 | 1.19E-03 | MCM7;CYP3A4 |
| b: Top 30 under expressed lncRNAs in PP skin | |||||||
|---|---|---|---|---|---|---|---|
| LncRNA | locus | value _PP |
value _NN |
Linear Fold Change |
p_value | q_value | DE Genes around 1Mb |
| FPKM1_group_28120_transcript_1_1 | chr6:39924108-39924571 | 0 | 5.56 | NA | 5.00E-05 | 1.19E-03 | MOCS1 |
| FPKM1_group_29557_transcript_1_1 | chr6:170470792-170471262 | 0 | 5.96 | NA | 5.00E-05 | 1.19E-03 | PSMB1;DLL1 |
| FPKM1_group_31749_transcript_1_1 | chr8:29452887-29454061 | 0 | 5.64 | NA | 5.00E-05 | 1.19E-03 | DUSP4 |
| LPO | chr17:56315786-56345879 | 0.01 | 4.83 | 716.29 | 5.00E-05 | 1.19E-03 | SUPT4H1;MRPS23 |
| ENSG00000253745.1/RP11-350F16.1 | chr8:47834182-47840454 | 0.17 | 72.96 | 418.38 | 5.00E-05 | 1.19E-03 | |
| ENSG00000272736.1/RP11-799N11.1 | chr17:10286448-10527203 | 0.06 | 11.04 | 195.07 | 5.00E-05 | 1.19E-03 | MYH3;MYH1 |
| ENSG00000259283.2/RP11-26L20.3 | chr16:55293880-55367500 | 0.29 | 53.7 | 183.56 | 5.00E-05 | 1.19E-03 | IRX6;SLC6A2;MMP2 |
| FPKM1_group_5050_transcript_1_1 | chr11:75445099-75445801 | 0.02 | 4.05 | 172.93 | 5.00E-05 | 1.19E-03 | DGAT2;MOGAT2;ARRB1;RPS3;MAP6;WNT11 |
| FPKM1_group_27961_transcript_1_1 | chr6:27029407-27029711 | 0.09 | 9.96 | 116.08 | 5.00E-05 | 1.19E-03 | HIST1H2AH;HIST1H2AG;HIST1H2BK;HIST1H2BJ |
| ENSG00000249365.1/RP11-508M8.1 | chr5:124443896-124485622 | 0.16 | 15.4 | 96.38 | 5.00E-05 | 1.19E-03 | ZNF608 |
| FPKM1_group_31738_transcript_1_1 | chr8:29162690-29163092 | 0.12 | 10.56 | 89.7 | 5.00E-05 | 1.19E-03 | DUSP4;HMBOX1 |
| ENSG00000224525.2/RP11-561I11.3 | chr1:242310815-242374129 | 0.08 | 6.55 | 84.81 | 5.00E-05 | 1.19E-03 | EXO1 |
| ENSG00000186526.8/CYP4F8 | chr19:15726028-15741448 | 2.05 | 156.94 | 76.67 | 5.00E-05 | 1.19E-03 | CYP4F2;CYP4F3;NOTCH3;CYP4F8;EPHX3 |
| FPKM1_group_31750_transcript_1_1 | chr8:29460151-29461688 | 0.17 | 12.57 | 71.85 | 5.00E-05 | 1.19E-03 | DUSP4 |
| SLC30A10 | chr1:220046618-220292777 | 0.11 | 7.82 | 71.83 | 5.00E-05 | 1.19E-03 | |
| FPKM1_group_18703_transcript_2_1 | chr2:223577752-223581956 | 0.2 | 14.06 | 68.74 | 5.00E-05 | 1.19E-03 | MOGAT1;PAX3;ACSL3;SGPP2 |
| ENSG00000266413.2/RP11-88L24.4 | chr2:179641652-179644690 | 0.63 | 43.33 | 68.33 | 5.00E-05 | 1.19E-03 | |
| ENSG00000250266.1/RP11-789C1.1 | chr4:171195069-171204230 | 1.24 | 70.12 | 56.44 | 5.00E-05 | 1.19E-03 | MFAP3L |
| ENSG00000223342.2/RP3-429O6.1 | chr6:6901254-6918948 | 0.32 | 17.24 | 53.04 | 5.00E-05 | 1.19E-03 | RREB1 |
| FPKM1_group_18703_transcript_1_1 | chr2:223575934-223577593 | 0.32 | 15.94 | 49.79 | 5.00E-05 | 1.19E-03 | MOGAT1;PAX3;ACSL3;SGPP2 |
| ENSG00000261788.1/RP11-480G7.1 | chr16:46737280-46737937 | 0.51 | 24.75 | 48.4 | 5.00E-05 | 1.19E-03 | MYLK3;DNAJA2;ORC6 |
| ENSG00000253844.1/RP11-546K22.1 | chr8:52874017-52935534 | 0.12 | 5.44 | 45.66 | 5.00E-05 | 1.19E-03 | PCMTD1 |
| MYPN | chr10:69865873-69971773 | 0.26 | 10.19 | 39.26 | 5.00E-05 | 1.19E-03 | DNA2;CTNNA3;DNAJC12;TET1;MYPN |
| ENSG00000223351.1/ZNF385D-AS2 | chr3:21984057-22021320 | 0.24 | 9.3 | 38.82 | 5.00E-05 | 1.19E-03 | ZNF385D |
| ENSG00000181123.4/RP4-539M6.14 | chr22:30879340-30888791 | 0.17 | 6.24 | 37.81 | 5.00E-05 | 1.19E-03 | SEC14L6;PES1;SEC14L4;SLC35E4;LIF |
| ENSG00000237560.1/AC004562.1 | chr17:67957847-67979679 | 0.16 | 6 | 36.46 | 5.00E-05 | 1.19E-03 | KCNJ2 |
| ENSG00000257514.1/RP11-755O11.2 | chr12:102040497-102053748 | 0.42 | 15.08 | 35.79 | 5.00E-05 | 1.19E-03 | NUP37;PARPBP;MYBPC1;SLC5A8;CHPT1 |
| FPKM1_group_14990_transcript_1_1 | chr19:33173072-33173778 | 0.43 | 15.14 | 34.84 | 5.00E-05 | 1.19E-03 | RHPN2;ANKRD27;RGS9BP;PDCD5 |
| ENSG00000236924.1/RP11-390F4.6 | chr9:6645955-6670635 | 0.2 | 6.25 | 31.52 | 5.00E-05 | 1.19E-03 | IL33;GLDC |
| ENSG00000243961.2/RP5-839B4.8 | chr20:9966735-9987764 | 0.51 | 15.82 | 31.17 | 5.00E-05 | 1.19E-03 | |
Validation of differentially expressed lncRNAs
To validate our RNA-seq findings we performed reverse transcription qPCR on RNA derived from 17 PP and 14 NN skin biopsies. We chose four DE Refseq lncRNAs (TRHDE-AS1, CYP4Z2P, HINT1 and RPSAP58) in PP vs NN skin for validation. Our qPCR results showed that 3 out of the 4 tested lncRNAs (TRHDE-AS1, CYP4Z2P and HINT1) were DE in psoriasis lesional skin in the same direction as observed in our RNA-seq data (supplementary figure S2).
To further validate our findings, we performed re-analysis of a previously published psoriasis RNA-seq data set (Li et al., 2014). Although Li et al. originally only reported mRNA expression of protein coding genes in their study, we re-analyzed their raw data, aligning reads to the human genome (hg19) and examining lncRNA differential expression of psoriasis and healthy skin using our combined lncRNA reference. We observed that of the top 30 overexpressed lncRNAs in our data set (supplementary table S3a), 28 were present in Li et al. data. Of these 28, 26 showed overexpression and 20 were statistically significant with p < 0.05; moreover, 5 were overexpressed but no p-value was calculated by the CuffDiff program due to less than 10 reads being present. Of the top 30 underexpressed lncRNAs from our data (supplementary table S3b), 27 were present in Li et al. and all 27 of them showed underexpression, with 12 having a p-value < 0.05 and 15 having no p-value calculated due to less than 10 reads being present.
Unsupervised hierarchical clustering of lncRNAs distinguishes psoriatic skin from healthy skin
Although heatmap analysis (Fig 1) showed that lncRNA expression is different in PP and NN skin and that lncRNAs show a distinct molecular signature in psoriasis, we further asked if we could observe similar separation of samples using the whole lncRNA dataset (DE or not). For this, we performed unsupervised hierarchical clustering of all the lncRNAs expressed (n=61991) in PP and NN and observed a near complete separation of PP samples from NN with some minor overlaps (Figure 2). Two controls (NN14, NN15) clustered separately from the other controls and one of the PP samples (PP8) clustered with the NN samples. All other samples showed complete separation based on disease status. These results indicate that as a whole, lncRNA expression in PP skin differs markedly from that of NN skin.
Figure 2. Unsupervised hierarchical clustering of transcripts expressed in PP and NN skin.

Differential expression of lncRNAs in psoriatic skin before and after anti-TNF treatment
We also compared differential expression of lncRNAs in 18 pairs of psoriatic skin before (PP) and after one month of treatment (PT) with adalimumab, a humanized monoclonal antibody against tumor necrosis factor alpha. The number of differentially expressed lncRNAs between PP and PT samples was 157 for the combined lncRNA. We also assessed whether PT samples showed differential lncRNA expression compared to NN samples. A large number of lncRNAs were found to be differentially expressed and the number of differentially expressed lncRNAs between PT and NN (377 transcripts) was higher than between PP and PT (157 transcripts) (Figure 3a). Supplementary table S4 shows a paired analysis of lncRNAs between PP and PT samples using EdgeR. Furthermore, we calculated a lncRNA molecular distance to health (MDTH) metric for PP and PT patients using gene expression data from NN patients as baseline expression. This approach involves computation of a score that represents the 'molecular distance' of a given sample relative to a baseline (for example, healthy controls) (see methods for details). We observed PT patients to be closer to the baseline than the PP patients (Figure 3b).
Figure 3.

a: Number of differentially expressed lncRNA transcripts in three comparisons, PP vs NN, PP vs PT and PT vs NN.
b: LncRNA molecular distance to health analysis of PP and PT using NN as baseline. Molecular distance to health (MDTH) for PP and PT is shown. Expression levels of NN were used as baseline. Note that PP skin has higher MDTH than PT.
Correlation of lncRNA expression with mRNA expression
To assess the biological functions of expressed lncRNAs we first performed gene ontology (GO) enrichment analysis of the 971 DE lncRNAs. Of these 971 lncRNAs, only 188 lncRNAs were annotated in the GO database. Analysis for molecular functions of these 188 lncRNAs revealed the following three GO terms to be significantly enriched: “molecular functions,” “protein binding,” and “binding”. As the majority of lncRNAs were not annotated, we used a different method to assess potential functions of these lncRNAs. As previous studies have indicated that genes with similar co-expression patterns also show similar functions, we used coding non-coding (CNC) network analysis to correlate lncRNA expression with that of protein coding genes in our data set. For this analysis we used Gencode lncRNAs and compared their expression with Refseq mRNA transcripts. After filtering (see methods), we observed 933 lncRNAs to show high correlation (correlation coefficient >= 0.95 and p value <= 0.05) with 1143 protein coding genes. Of these 933 lncRNAs, 11 were differentially expressed in our data set. Supplementary figure S3a shows a network of the candidate genes associated with those 11 lncRNAs. Supplementary table S5a shows FPKM, fold change, correlations and q values of lncRNA-mRNA pair shown in this figure. GO term enrichment analysis of the protein coding genes associated with those 11 lncRNAs revealed sensory perception of smell (p=1.77E-06), sensory perception of chemical stimulus (p=1.04E-05) and G-protein coupled receptor signaling pathway (p=5.58E-03) as some of the significant biological processes. Furthermore, we asked whether any of the top 100 DE protein-coding genes were also present in our lncRNA-mRNA association matrix. We identified seven protein-coding genes in our lncRNA-mRNA association matrix. Supplementary figure S3b shows these seven protein coding genes with their corresponding associated lncRNAs. Supplementary table S5b shows FPKM, fold change, correlations and q values of lncRNA-mRNA pair shown in this figure.
Proximity of lncRNAs to genome-wide association study (GWAS) signals in psoriasis
Next, we examined whether differentially expressed lncRNAs were located near known psoriasis GWAS loci. For this we used 36 known and newly identified psoriasis loci as reported in Tsoi et al., 2012(Tsoi et al., 2012). We observed CARD14 lncRNA (location: chr17:78143790-78183130) to overlap with CARD14 (chr17:78,161,599-78,172,723), a gene involved in the activation of NF-kB and known to be genetically associated with both common and autosomal dominant forms of psoriasis(Jordan et al., 2012). The CARD14 lncRNA can be distinguished from the CARD14 mRNA by the presence of an additional 5’ transcribed exon. It was observed that CARD14 lncRNA was overexpressed in psoriatic lesional skin compared to healthy control (FDR=0.001, 2.9 fold increase). Although we were not able to confirm this using qPCR, most likely because of very low expression, we were able to see the alignment of reads specific for CARD14 lncRNA compared to CARD14 mRNA in Integrated Genomics Viewer (IGV) for PP and NN skin (Supplementary Figure S4).). Additionally, we found that the CARD14 lncRNA was present in 84% of the psoriasis and healthy controls samples in the Li et al, 2014 data set, and that CARD14 lncRNA was significantly overexpressed in psoriatic lesional skin compared to healthy skin (FDR=0.003, 2.3 fold increase), thus replicating our results. Previous studies have shown that mutations in CARD14 genes are associated with susceptibility to psoriasis. Thus, we used a web-based program RNAsnp to predict the effect of all the reported CARD14 SNPs associated with psoriasis on CARD14 lncRNA secondary structure. The program predicted that SNP rs9902358 can cause significant changes in secondary structure of the CARD14 lncRNA (Supplementary Figure S5).
The other two differentially expressed lncRNAs that were found to be located closely to psoriasis GWAS signal were LINC00302 and IL12RB2, located less than 50 kb to SNPs rs6677595 (LCE3B, LCE3C) and rs9988642 (IL23R), respectively.
Discussion
The pathogenesis of psoriasis has been linked to pathways affecting innate and adaptive immunity, as well as epidermal differentiation. Microarray studies have reported that a large number of genes are differentially expressed in psoriatic versus healthy control skin (Oestreicher et al., 2001)(Bowcock et al., 2001; Zhou et al., 2003; Haider et al., 2006; Zaba et al., 2009; Suarez-Farinas et al., 2010; Swindell et al., 2013). More recently RNA-seq, a technique that involves direct sequencing RNA/cDNA using high through put next generation sequencing technologies, has been used to analyze psoriasis transcriptome (Joyce et al., 2011; Jabbari et al., 2012; Li et al., 2014). In one such study, the authors performed RNA-seq analysis of skin biopsies from 174 individuals and observed that over 80% of genes identified by microarray were also identified by RNA seq but only 22% of genes identified by RNA seq were identified by microarray. These studies show that RNA seq is capable of capturing the full dynamic range of the psoriasis transcriptome and can better assist in identifying key genes involved in pathogenesis of psoriasis. Furthermore, RNA seq can also help in finding novel transcripts, which cannot be identified using microarray.
Previous studies on lncRNAs have indicated that lncRNAs can be polyadenylated as well as non-polyadenylated. In view of this, we undertook this study to examine both polyA and non-polyA lncRNA profiles in psoriatic skin using ribosomally-depleted total RNA. Furthermore, there currently exist different lncRNA reference datasets with different annotations. Previous studies on lncRNA profiling in various diseases have mostly used one or two datasets. This practice limits the identification of all the lncRNAs and as a result many lncRNAs remain unidentified. Here, we assembled and combined three different lncRNA reference sets, Refseq, Gencode and Hangauer et al (Hangauer et al., 2013) see methods), to create a more comprehensive reference dataset for annotation. Using this combined reference, we observed 971 lncRNAs to be differentially expressed in PP vs NN skin. This number is likely to be a conservative estimate of the true number of DE lncRNAs in psoriasis as we applied a heavy FDR correction to our results based on over 60,000 lncRNA transcripts. When we created a heatmap of those 971 transcripts, we observed a distinct molecular signature of psoriasis based on lncRNAs alone. Furthermore, hierarchical clustering analysis using the entire lncRNA data also revealed that the lncRNA expression profile of PP skin was distinct from NN skin.
We validated our findings using qPCR and through reproduction of our findings using an independent RNA-seq dataset (Li et al., 2014). We observed significant congruence between our top DE lncRNAs and the same transcripts in their dataset, with the slight differences primarily due to lower transcript abundance in several of the lncRNAs examined in their data resulting in the absence of a p-value calculation.
In an effort to understand if any of the lncRNAs observed in our study are related in expression with the protein coding genes, we generated a CNC network. For this we generated a correlation matrix of lncRNAs with that of protein coding transcripts. Of the 933 lncRNAs present in the matrix, we found 11 to be differentially expressed in PP vs NN skin. We observed these 11 lncRNAs to be co-expressed along with many protein-coding genes. A functional analysis of functions of those protein-coding genes showed perception to smell and G-protein coupled receptor signaling pathway as some of the significant processes.
We also analyzed expression of lncRNAs in skin derived from patients treated with TNF-alpha inhibitor, adalimumab. A comparison of DE lncRNAs in in PP vs PT and PT vs NN revealed that the number of differentially expressed lncRNAs in PP vs NN was higher than that observed in PP vs PT. Furthermore, a molecular distance to health analysis revealed that molecular distance of lncRNAs expressed in PT was closer to healthy controls than PP. As TNF-α plays an important role in the inflammatory process and has been found in elevated levels in psoriasis patients, the targeting and inhibition of TNF-α has become a key approach to treating psoriasis. It has been shown that treatment with adalimumab causes a decrease in expression of various cytokines and transcription factors, eg., IL17, beta-defensins in psoriatic skin (Hendriks et al. 2013). Our results indicated that lncRNA profile of post-treated skin was significantly different from pre-treated skin and was closer to normal skin.
In the present study, we identified three differentially expressed lncRNAs in proximity to known psoriasis susceptibility loci at CARD14, LCE3B/LCE3C, and IL23R. Whether these lncRNAs potentially regulate the function of these psoriasis genes is an intriguing question that will require additional investigation.
Overall, this study has identified a large number of lncRNAs present in human skin (>60,000) of which approximately 1,000 are differentially expressed in psoriasis. Many of these DE lncRNAs are novel, and future studies will be aimed at deciphering the function of these important biological mediators.
Materials and Methods
Patient enrollment and library preparation
We recruited eighteen adult subjects (N=18) with chronic, plaque psoriasis with affected body surface area > 10% and not on systemic medications at the time of enrollment at the UCSF Psoriasis and Skin Treatment Center. The mean baseline Psoriasis Area and Severity Index (PASI) of the patients was 14.6 (standard deviation 3.9). Punch biopsies (5 mm) were taken from the edge of a psoriatic plaque before treatment and after one month of treatment with adalimumab. The mean improvement in the PASI over this time period was 53.1%. We obtained sixteen normal skin samples (N=16) from healthy control surgical discard specimens. We obtained written, informed consent for study participation from all the subjects under the approval of the local Institutional Review Boards. We extracted total RNA from biopsies using Qiagen RNeasy mini kit. After ribosomal RNA depletion, we prepared RNA seq libraries using ScriptSeq complete kits from Epicenter.
RNASeq Workflow
We obtained an average of 52.3 million 101 bp paired end reads per sample (minimum of 37.1 million reads, maximum of 89.4 million reads). Quality was validated using FastQC (version 0.11.1). Quality and adapter trimming was performed with Trimmomatic (version 0.3). Reads were aligned to the human genome (hg19) using Tophat2 (version 2.0.9). An average of 34.8 million paired end reads were aligned for each library (minimum of 25.3 million, maximum of 61.4 million). For differential gene expression, the RefSeq gene set (downloaded from the UCSC genome browser January, 2013), Gencode lncRNA set (gencode v19), and the Hangauer et al 2013 lncRNA set (Dataset_S3) were used for annotation. The above-mentioned RNA seq data have been deposited in NCBI's Gene Expression Omnibus and the GEO accession number is GSE74697. To create a combined lncRNA reference, a script was used to extract RefSeq entries that were noncoding and > 200 bp (parameters for lncRNAs) and then merge Gencode transcripts, RefSeq lncRNAs transcripts, and Hangauer et al 2013 transcripts that were non-overlapping. After annotation, expression levels were first normalized by estimating the fragments per kilobase per million reads mapped (FPKM) values for each gene. FPKM is calculated as follows:
where Xi is the count of gene i, is the effective transcript length of gene i, and N, is the number of reads sequenced (Trapnell et al., 2013). Cuffdiff (version 2.1.1), a program from the Cufflinks package, was used to calculate differential gene expression between each of the two conditions, and was run with default parameters. Cuffdiff employs a simple T test as follows:
where y is the ratio of the normalized counts between conditions.
Validation of findings using Li et al data (GSE54456)
We obtained the . sra files from the Li et al study and converted each .sra file into a .fastq file using sratoolkit (version 2.4.2). Reads were aligned to the human genome (hg19) using Tophat2 (version 2.0.9). Samples were split into Psoriasis and Controls based on the provided sraruntable from the study. Cuffdiff (version 2.1.1), a program from the Cufflinks package, was used to calculate the differential gene expression between the two conditions, and was run with default parameters. RefSeq (from January 2013) and the combined lncRNA dataset were used as references.
Coding Non-coding network analysis
Cufflinks (v2.0.2) was used to calculate the refseq gene expression. The FPKM of protein coding genes were extracted using a Perl script. CNC analysis was done using R software (v 2.10.0). The results were filtered using following criteria: correlation coefficient ≥ |0.95|and p value ≤ 0.005. CNC analysis was done on PP and NN groups separately and then we filtered the candidate genes in the control group from the PP group. KEGG pathway information of the candidate protein coding genes was then obtained using perl scripts. Finally, Cytoscape (v 3.1.1) was used to visualize the network of lncRNAs and genes.
Molecular distance to health
We performed MDTH analysis (see (Pankla et al., 2009) for detail) on all the DE lncRNAs on PP vs NN comparison. Briefly, we first established the baseline by calculating average expression level and standard deviation of each gene for the healthy skin group. Next, we calculated the 'distance' of an individual gene from the baseline, which is the difference in raw expression level from the baseline average of a gene for a given sample, and then we calculated the number of standard deviations from baseline levels that the difference in expression represents. In step 3 we applied filters to establish qualify genes. The qualifying genes must differ from the average baseline expression by at least 200 and 2 standard deviations. In step 4 we calculated a global distance from baseline, which is total of the number of standard deviations for all qualifying genes.
Supplementary Material
Acknowledgments
This work was supported in part by grants from the National Institutes of Health: R01AR065174 and K08AR057763 to W.L
Abbreviations
- lncRNA
long non-coding RNA
- qPCR
quantitative PCR
- DE
differentially expressed
- cDNA
complementary DNA
Footnotes
City, state and country in which the work was done: San Francisco, California, USA
Conflict of Interest
The authors state no conflict of interest.
References
- Bernstein BE, Birney E, Dunham I, et al. An integrated encyclopedia of DNA elements in the human genome. Nature. 2012;489:57–74. doi: 10.1038/nature11247. [DOI] [PMC free article] [PubMed] [Google Scholar]
- Bowcock AM, Shannon W, Du F, et al. Insights into psoriasis and other inflammatory diseases from large-scale gene expression studies. Hum Mol Genet. 2001;10:1793–805. doi: 10.1093/hmg/10.17.1793. [DOI] [PubMed] [Google Scholar]
- Haider AS, Peters SB, Kaporis H, et al. Genomic analysis defines a cancer-specific gene expression signature for human squamous cell carcinoma and distinguishes malignant hyperproliferation from benign hyperplasia. J Invest Dermatol. 2006;126:869–81. doi: 10.1038/sj.jid.5700157. [DOI] [PubMed] [Google Scholar]
- Hangauer MJ, Vaughn IW, McManus MT. Pervasive Transcription of the Human Genome Produces Thousands of Previously Unidentified Long Intergenic Noncoding RNAs. PLoS Genet. 2013;9 doi: 10.1371/journal.pgen.1003569. [DOI] [PMC free article] [PubMed] [Google Scholar]
- Hendriks AGM, van der Velden HMJ, Wolberink EAW, et al. The effect of adalimumab on key-drivers in the pathogenesis of psoriasis. Br J Dermatol. 2013:571–80. doi: 10.1111/bjd.12705. [DOI] [PubMed] [Google Scholar]
- International Human Genome Sequencing Consortium. Finishing the euchromatic sequence of the human genome. Nature. 2004;431:931–45. doi: 10.1038/nature03001. [DOI] [PubMed] [Google Scholar]
- Jabbari A, Suárez-Fariñas M, Dewell S, et al. Transcriptional profiling of psoriasis using RNA-seq reveals previously unidentified differentially expressed genes. J Invest Dermatol. 2012;132:246–9. doi: 10.1038/jid.2011.267. [DOI] [PMC free article] [PubMed] [Google Scholar]
- Jordan CT, Cao L, Roberson EDO, et al. PSORS2 is due to mutations in CARD14. Am J Hum Genet. 2012;90:784–95. doi: 10.1016/j.ajhg.2012.03.012. [DOI] [PMC free article] [PubMed] [Google Scholar]
- Joyce CE, Zhou X, Xia J, et al. Deep sequencing of small RNAs from human skin reveals major alterations in the psoriasis miRNAome. Hum Mol Genet. 2011;20:4025–40. doi: 10.1093/hmg/ddr331. [DOI] [PMC free article] [PubMed] [Google Scholar]
- Li B, Tsoi LC, Swindell WR, et al. Transcriptome Analysis of Psoriasis in a Large Case-Control Sample: RNA-Seq Provides Insights into Disease Mechanisms. J Invest Dermatol. 2014;134:1828–38. doi: 10.1038/jid.2014.28. [DOI] [PMC free article] [PubMed] [Google Scholar]
- Mattick JS, Makunin IV. Non-coding RNA. Hum Mol Genet. 2006;15(Spec No):R17–29. doi: 10.1093/hmg/ddl046. [DOI] [PubMed] [Google Scholar]
- Oestreicher JL, Walters IB, Kikuchi T, et al. Molecular classification of psoriasis disease-associated genes through pharmacogenomic expression profiling. Pharmacogenomics J. 2001;1:272–87. doi: 10.1038/sj.tpj.6500067. [DOI] [PubMed] [Google Scholar]
- Pankla R, Buddhisa S, Berry M, et al. Genomic transcriptional profiling identifies a candidate blood biomarker signature for the diagnosis of septicemic melioidosis. Genome Biol. 2009;10:R127. doi: 10.1186/gb-2009-10-11-r127. [DOI] [PMC free article] [PubMed] [Google Scholar]
- Sonkoly E, Bata-Csorgo Z, Pivarcsi A, et al. Identification and characterization of a novel, psoriasis susceptibility-related noncoding RNA gene, PRINS. J Biol Chem. 2005;280:24159–67. doi: 10.1074/jbc.M501704200. [DOI] [PubMed] [Google Scholar]
- Suarez-Farinas M, Lowes MA, Zaba LC, et al. Evaluation of the psoriasis transcriptome across different studies by gene set enrichment analysis (GSEA) PLoS One. 2010;5:e10247. doi: 10.1371/journal.pone.0010247. [DOI] [PMC free article] [PubMed] [Google Scholar]
- Swindell WR, Johnston A, Voorhees JJ, et al. Dissecting the psoriasis transcriptome: inflammatory- and cytokine-driven gene expression in lesions from 163 patients. BMC Genomics. 2013;14:527. doi: 10.1186/1471-2164-14-527. [DOI] [PMC free article] [PubMed] [Google Scholar]
- The Encode Project Consortium. Identification and analysis of functional elements in 1% of the human genome by the ENCODE pilot project. Nature. 2007;447:799–816. doi: 10.1038/nature05874. [DOI] [PMC free article] [PubMed] [Google Scholar]
- Trapnell C, Hendrickson DG, Sauvageau M, et al. Differential analysis of gene regulation at transcript resolution with RNA-seq. Nat Biotechnol. 2013;31:46–53. doi: 10.1038/nbt.2450. [DOI] [PMC free article] [PubMed] [Google Scholar]
- Tsoi LC, Iyer MK, Stuart PE, et al. Analysis of long non-coding RNAs highlights tissue-specific expression patterns and epigenetic profiles in normal and psoriatic skin. 2015:1–15. doi: 10.1186/s13059-014-0570-4. [DOI] [PMC free article] [PubMed] [Google Scholar]
- Tsoi LC, Spain SL, Knight J, et al. Identification of 15 new psoriasis susceptibility loci highlights the role of innate immunity. Nat Genet. 2012;44:1341–8. doi: 10.1038/ng.2467. [DOI] [PMC free article] [PubMed] [Google Scholar]
- Zaba LC, Suarez-Farinas M, Fuentes-Duculan J, et al. Effective treatment of psoriasis with etanercept is linked to suppression of IL-17 signaling, not immediate response TNF genes. J Allergy Clin Immunol. 2009;124:1022–395. doi: 10.1016/j.jaci.2009.08.046. [DOI] [PMC free article] [PubMed] [Google Scholar]
- Zhou X, Krueger JG, Kao MC, et al. Novel mechanisms of T-cell and dendritic cell activation revealed by profiling of psoriasis on the 63,100-element oligonucleotide array. Physiol Genomics. 2003;13:69–78. doi: 10.1152/physiolgenomics.00157.2002. [DOI] [PubMed] [Google Scholar]
Associated Data
This section collects any data citations, data availability statements, or supplementary materials included in this article.