

Abstract
Angelman syndrome (AS) is a debilitating neurodevelopmental disorder caused by loss of function of the maternally inherited UBE3A allele. It is currently unclear how the consequences of this genetic insult unfold to impair neurodevelopment. We reasoned that by elucidating the basis of microcephaly in AS, a highly penetrant syndromic feature with early postnatal onset, we would gain new insights into the mechanisms by which maternal UBE3A loss derails neurotypical brain growth and function. Detailed anatomical analysis of both male and female maternal Ube3a-null mice reveals that microcephaly in the AS mouse model is primarily driven by deficits in the growth of white matter tracts, which by adulthood are characterized by densely packed axons of disproportionately small caliber. Our results implicate impaired axon growth in the pathogenesis of AS and identify noninvasive structural neuroimaging as a potentially valuable tool for gauging therapeutic efficacy in the disorder.
SIGNIFICANCE STATEMENT People who maternally inherit a deletion or nonfunctional copy of the UBE3A gene develop Angelman syndrome (AS), a severe neurodevelopmental disorder. To better understand how loss of maternal UBE3A function derails brain development, we analyzed brain structure in a maternal Ube3a knock-out mouse model of AS. We report that the volume of white matter (WM) is disproportionately reduced in AS mice, indicating that deficits in WM development are a major factor underlying impaired brain growth and microcephaly in the disorder. Notably, we find that axons within the WM pathways of AS model mice are abnormally small in caliber. This defect is associated with slowed nerve conduction, which could contribute to behavioral deficits in AS, including motor dysfunction.
Keywords: Angelman, axon, E6-AP, microcephaly, UBE3A, white matter
Introduction
Maternally inherited deletions or mutations of UBE3A cause Angelman syndrome (AS), a severe neurodevelopmental disorder (Kishino et al., 1997; Matsuura et al., 1997; Sutcliffe et al., 1997). Individuals with AS suffer from profound developmental delay, impaired motor function, absence of speech, and other highly penetrant phenotypes including electroencephalographic abnormalities, epilepsy, and microcephaly (Mabb et al., 2011; Margolis et al., 2015). These features of AS begin to manifest during the first year of life (Fryburg et al., 1991; Dagli et al., 2012), indicating an early deviation from the typical course of neurodevelopment.
Not all brain cells express UBE3A equally, lending traction to efforts geared toward deciphering altered neurodevelopmental trajectories in AS. Due to cell-type-specific epigenetic mechanisms, neuronal expression of UBE3A from the paternal allele is silenced during early phases of cellular differentiation and maturation (Rougeulle et al., 1997; Yamasaki et al., 2003), thereby rendering neurons especially vulnerable to the maternal UBE3A loss that defines AS. In contrast, paternal UBE3A expression is spared in neural stem cells and in glia, which biallelically express the gene (Yamasaki et al., 2003; Judson et al., 2014). Neurons are therefore an obvious focal point for AS research, but due to the spatiotemporal ubiquity of UBE3A expression throughout development (Judson et al., 2014; Burette et al., 2017), virtually any neuron or neural circuit could contribute to AS pathogenesis through a variety of primary deficits in neuronal physiology—a daunting possibility.
UBE3A (also called E6-AP) is the founding member of the HECT (homologous to the E6-AP C terminus) domain family of E3 ubiquitin ligases, which can catalyze the polyubiquitination of substrate proteins, targeting them for proteasomal degradation (Mabb and Ehlers, 2010; Mabb et al., 2011). UBE3A can also act as a transcriptional coactivator (Nawaz et al., 1999; Reid et al., 2003; El Hokayem and Nawaz, 2014), but mutations that inhibit its ubiquitin ligase activity selectively are sufficient to cause AS (Cooper et al., 2004), implying that improper substrate regulation in neurons is the primary pathogenic basis of the disorder. Candidate UBE3A substrates and other UBE3A-interacting proteins in neurons continue to be identified, but clear and direct links to specific phenotypes remain elusive (Sell and Margolis, 2015).
Here, we sought to elucidate the anatomical underpinnings of microcephaly in AS, reasoning that better understanding the causes of impaired brain growth in the disorder would yield new insights into the neurodevelopmental consequences of maternal UBE3A loss in neurons. We brought the complementary approaches of structural neuroimaging, light and electron microscopy, and electrophysiology to bear in AS model mice. We conclude that deficits in brain growth consequent to maternal UBE3A loss are likely the product of disproportionate reductions in white matter (WM) volume, rooted in the failure of projection neurons to develop axons of appropriate caliber.
Materials and Methods
Animals
We raised all mice on a 12:12 light:dark cycle with ad libitum access to food and water and performed all experiments in strict compliance with animal protocols approved by the Institutional Animal Care and Use Committees of the University of North Carolina at Chapel Hill (UNC). We used both male and female littermates at equivalent genotypic ratios, with the exception of brain and body weight measures (see Fig. 1), for which we analyzed only female mice at postnatal day 28 (P28), and P90, to control for the sexual dimorphism in body weight. Mice carrying the Ube3a knock-out allele were originally generated in the laboratory of A. Beaudet (Jiang et al., 1998) and back-crossed to a congenic C57BL/6J background (RRID:IMSR_JAX:016590). We generated maternal Ube3a-deficient mice (Ube3am−/p+) by crossing congenic C57BL/6 wild-type males to paternal Ube3a-deficient females (Ube3am+/p−), which themselves are phenotypically normal (Jiang et al., 1998; Mulherkar and Jana, 2010). To generate mice for the analysis of cortical area patterning (see below), we crossed Ube3am+/p− females to male homozygous Ai9, tdTomato Cre-reporter mice (Madisen et al., 2010), which were also maintained on a congenic C57BL/6 background (RRID:IMSR_JAX:007909).
Figure 1.

Ube3am−/p+ mice exhibit microcephaly with postnatal onset. A, Representative image of P28 Ube3am+/p+ and Ube3am−/p+ littermate brains after transcardial fixation and gross dissection. B, Cross-sectional analysis of postperfusion brain weights from littermate Ube3am+/p+ and Ube3am−/p+ mice. C, Cross-sectional analysis of premortem body weights from littermate Ube3am+/p+ and Ube3am−/p+ mice (P0: Ube3am+/p+ n = 7, Ube3am−/p+ n = 6; P6: Ube3am+/p+ n = 6, Ube3am−/p+ n = 13; P7: Ube3am+/p+ n = 8, Ube3am−/p+ n = 11; P8: Ube3am+/p+ n = 10, Ube3am−/p+ n = 7; P14: Ube3am+/p+ n = 8, Ube3am−/p+ n = 6; P16: Ube3am+/p+ n = 7, Ube3am−/p+ n = 10; P28: Ube3am+/p+ n = 7, Ube3am−/p+ n = 5; P90: Ube3am+/p+ n = 5, Ube3am−/p+ n = 6). Each dataset was fit with a single exponential. Data represent mean ± SEM, ***p ≤ 0.001, ****p ≤ 0.0001.
Diffusion tensor imaging (DTI) and analysis
Tissue preparation.
We deeply anesthetized P90 mice with sodium pentobarbital (60 mg/kg, i.p.) before transcardially perfusing them with heparinized saline (0.9% NaCl, 10 IU heparin/ml), immediately followed by phosphate-buffered 4% paraformaldehyde, pH 7.3, at a rate of 9 ml/min. After delivering 50 ml of fixative, we decapitated mice, postfixed their heads overnight at 4°C, and rinsed and stored them in PBS at 4°C before imaging.
Image acquisition and processing.
We acquired diffusion-weighted images (24 directions; b-value = 1600; FOV = 200 × 256 × 128; voxel resolution = 0.12 × 0.12 × 0.12 mm3; TE = 22.75 ms; TR = 700 ms; scan time = 15 h) using a 9.4 T scanner at the UNC Small Animal Imaging Facility (BioSpec 9.4/30 USR; Bruker Biospin). We processed images using an in-house pipeline developed by our laboratory at UNC, which uses unbiased, atlas-based, regional segmentation (Budin et al., 2013). First, we rigidly registered the images to the C57 Brookhaven atlas (Ma et al., 2005) to align them in a common space. We then skull-stripped the images and performed histogram matching and affine registration, creating a population average image using AtlasWerks (Joshi et al., 2004). We diffeomorphically registered a parcellation of brain regions (based on the Brookhaven Atlas) to the population average image using ANTS (Avants et al., 2008), allowing us to propagate the population average segmentation to the individual case images and generate regional statistics. A single anatomical expert, blind to sex and genotype, checked each case visually for quality control.
Volumetric segmentation.
We performed WM volumetric segmentations on the RD image of each individual case in ITK-SNAP (RRID:SCR_002010) (Yushkevich et al., 2006) according to the following parameters: corpus callosum segmented in four contiguous sagittal slices at the midline (defined by the presence of the superior sagittal sinus; internal capsule segmented primarily in the coronal plane with an anterior boundary at the body of the anterior commissure and a posterior boundary at the ascending limb of the stria terminalis; anterior commissure segmented primarily in the horizontal plane with an anterior boundary for the anterior limbs at the genu of the corpus callosum and a posterior boundary at the optic chiasm; fimbria segmented in its entirety, primarily in the coronal plane; fornix segmented primarily in the coronal plane with the boundary for the precommissural fornix two slices anterior to the body of the anterior commissure and the boundary for the postcommissural fornix three slices anterior to the mammillary bodies.
We segmented the cerebral cortex using the propagated atlas parcellation. Cortical segmentations were automatically eroded by one voxel to eliminate the partial voluming of voxels between the outer pial surface of cortex and the subarachnoid space. An anatomical expert blind to sex and genotype visually inspected each case and edited the cortical segmentation manually using ITK-Snap.
DTI data processing and tractography.
We processed DTI data according to procedures that provide consistent parameterization between subjects (Goodlett et al., 2009), generating a final average tensor atlas of all Ube3am−/p+ and littermate control brains. Working from this average atlas, we performed tractography for each tract of interest through seed label mapping in 3D Slicer (RRID:SCR_002579), with ITK-SNAP-generated segmentations serving as seed labels. We edited the resultant tractography-computed tracts in 3D Slicer and in FiberViewerLight, eliminating spurious and partial fibers before parameterization and the generation of subject-specific, tract-based statistics using DTIAtlasFiberAnalyzer (Verde et al., 2014). Finally, we performed a functional analysis of the tract-based statistics, or Functional Analysis of Diffusion Tensor Tracts Statistics (FADTTS) (Zhu et al., 2011), using the FADTTSter tool and controlling for imaging cohort as a covariate. All of the open-source tools constituting this DTI processing pipeline are available publically through the UNC-Utah NA-MIC DTI fiber tract analysis framework (www.nitrc.org/projects/namicdtifiber).
Electrophysiology
For nerve conduction recordings, we anesthetized mice with sodium pentobarbital (60 mg/kg) and decapitated them before acutely dissecting the tibial branch of the sciatic nerve. Following previously described methods (Pillai et al., 2009), we used a Ag/AgCl suction electrode in a dual-compartment ex vivo recording chamber to deliver rectangular wave pulses (10 μs in duration) to the proximal portion of the nerve, adjusting the stimulus amplitude (10–30 V) to ensure a near-maximal response of the large-caliber Aαβ fiber component. We calculated maximum conduction velocity by dividing the distance between the stimulating and recording electrodes (20 mm) by the conduction latency (ms from stimulus artifact to Aαβ deflection).
Light microscopy and analysis
Tissue preparation.
We anesthetized mice with sodium pentobarbital (60 mg/kg) before transcardial perfusion with PBS, immediately followed by phosphate-buffered 4% paraformaldehyde, pH 7.3. We removed perfused brains from their skulls and postfixed them overnight at 4°C before sequential 12 h incubations in 10%, 20%, and 30% sucrose in PBS, pH 7.5, for cryoprotection. We then froze cryoprotected brains on dry ice and cut them into 40-μm-thick sections with a sliding microtome (Thermo Fisher Scientific). We stored sections at −20°C in a cryopreservative solution (by volume: 45% PBS, 30% ethylene glycol, 25% glycerol) until performing free-floating immunohistochemistry.
Immunohistochemistry.
We rinsed sections several times in PBS before blocking in PBS plus 5% normal goat serum and 0.2% Triton X-100 (NGST) for 1 h at room temperature. We subsequently incubated blocked tissue sections in primary antibodies diluted in NGST for 48 h at 4°C. We then rinsed them several times in PBS containing 0.2% Triton X-100 (PBST) before incubation in secondary antibodies (also diluted in NGST) for 1 h at room temperature. In most experiments, we also added 4′,6-diamidino-2-phenylindole (DAPI; Thermo Fisher Scientific, catalog #D1306) at a concentration of 700 ng/ml for nuclear counterstaining. Primary antibodies and dilutions used included 1:500 mouse anti-NeuN (Millipore catalog #MAB377, RRID:AB_10048713), 1:500 rabbit anti-CUX1 (Santa Cruz Biotechnology catalog #sc-13024, RRID:AB_2261231), and 1:1000 CTIP2 (Abcam catalog #ab18465, RRID:AB_2064130). We used secondary antibodies (Thermo Fisher Scientific) at a 1:500 dilution, including Alexa Fluor-647 goat anti-mouse IgG1 (catalog #A21240, RRID:AB_10565021), Alexa Fluor-488 goat anti-rabbit IgG (catalog #A11008, RRID:AB_10563748), and Alexa Fluor-568 goat anti-rat IgG (catalog #A11077, RRID:AB_10562719). We stained all brain sections for quantitative analysis within the same experiment under identical conditions.
Imaging.
We acquired images of immunofluorescently labeled brain sections with a Zeiss LSM 710 confocal microscope equipped with ZEN imaging Software (Zeiss, RRID:SCR_013672). We collected images for quantitative comparison during the same imaging session using identical acquisition parameters.
Analysis of cortical area patterning.
We generated sensory area maps for Scnn1a-Cre::Ai9::Ube3am−/p+ and littermate control (Scnn1a-Cre::Ai9::Ube3am+/p+) mice; Scnn1a-Cre is expressed by L4 neurons within primary sensory areas of neocortex; the Ai9 allele harbors a floxed STOP cassette preventing tdTomato expression from the Gt(ROSA)26Sor locus before Cre-mediated recombination (Madisen et al., 2010). After transcardial perfusion with 2% paraformaldehyde, pH 7.3, and removal of the hippocampus and subcortical structures, we flattened the cortical hemispheres from each mouse between weighted glass slides. Subsequently, we cut hemispheres to a thickness of 40 μm and imaged four to six consecutive sections (15 μm optical thickness) per hemisphere to capture the entirety of TdTomato fluorescence in L4 sensory cortex, the boundaries of which we traced and measured using ImageJ software (RRID:SCR_003070) (Schneider et al., 2012).
Analysis of cortical laminar patterning.
We measured the percentage of primary somatosensory cortical thickness stained for CUX1 (layers 1–4; L1–4) and CTIP2 (L5–6) within 100-μm-wide sampling strips. We averaged the results from four strips per mouse, one +0.14 mm and one −0.94 mm relative to bregma, for each hemisphere.
Analysis of cortical cell density.
We acquired all images for cortical cell density analyses using thin (1.4-μm-thick) optical sectioning. For each animal, we sampled four 100-μm-wide strips of primary somatosensory cortex: one +0.14 mm and one −0.94 mm relative to bregma per hemisphere. We averaged counts of both NEUN+/DAPI+ (neurons) and NEUN-/DAPI+ (glia), which we made using the cell counter plug-in in ImageJ. We used CUX1 and CTIP2 counterstaining to reliably subdivide L1–4 and L5–6 laminae within each strip.
Electron microscopy and analysis
Tissue preparation.
We killed anesthetized mice (60 mg/kg sodium pentobarbital) by transcardial perfusion with 0.9% NaCl, followed immediately by fixative consisting of 2% glutaraldehyde (Electron Microscopy Science), 2% depolymerized paraformaldehyde, and 0.2% picric acid in 0.1 m phosphate buffer, pH 6.8. We immediately removed the perfused brains and dissected the sciatic nerves, postfixed them overnight at 4°C in the same fixative, and sectioned them the following day on a vibratome to a thickness of 50 μm. We postfixed sagittal brain sections and transverse sections of sciatic nerve in 1% osmium tetroxide in 0.1 m phosphate buffer for 1 h before incubation with 1% uranyl acetate in maleate buffer (0.1 m, pH 6.0) for 1 h. After dehydration, we infiltrated the sections with Spurr resin and flat-mounted them between sheets of ACLAR fluoropolymer within glass slides. We glued chips of corpus callosum or sciatic nerve onto plastic blocks, sectioned them en face at ∼60 nm, collected them on 300 mesh nickel grids coated with Coat-Quick G, and performed poststaining with uranyl acetate and Sato's lead.
Callosal imaging and analysis.
We performed electron microscopy on callosal material with a Tecnai 12 transmission electron microscope (Philips) at 80 kV, acquiring images at 4400× magnification. We measured both unmyelinated and myelinated axon caliber (specifically the axoplasmic cross-sectional area, excluding the myelin sheath) and total axon density from randomly sampled 120 μm2 photomontages (15–20 images, 400–507 unmyelinated and 1899–2939 myelinated axons analyzed per mouse). We extrapolated axon diameters from cross-sectional area measurements assuming a circular fit. To ensure that axons in wild-type and Ube3am−/p+ mice were equivalently circular, we analyzed the “round” and “circularity” shape descriptor parameters within ImageJ, finding no significant differences between groups. We calculated g-ratios (the ratio of the inner axonal diameter to the total outer diameter axonal diameter, including the myelin sheath) from randomly sampled 15 μm2 electron micrographs (15–20 images, 457–666 myelinated axons per mouse).
Sciatic nerve imaging and analysis
We acquired electron micrographs of the sciatic nerve with a Zeiss 910 transmission electron microscope at 80 kV, acquiring images at 1600× magnification. We measured myelinated axon caliber and g-ratios from randomly sampled ∼2500 μm2 micrographs (5–14 per mouse, totaling 404–1245 myelinated axons).
Figure production
We linearly adjusted the brightness and contrast of some images in figure plates using ImageJ software. All images meant for direct comparison within figures underwent identical manipulations. We prepared all figures using Adobe Illustrator software (RRID:SCR_010279).
Experimental design and statistical analysis
We performed and analyzed all experiments blind to genotype, estimating minimum sample sizes from previously published datasets with similar experimental parameters. For brain and body weight, neuroimaging, light microscopy, electron microscopy, and electrophysiology experiments, we drew measurements from mutant animals and their age-matched littermates and attempted to balance the number of animals drawn from each sex.
Sample sizes by experiment
Body and brain growth (see Fig. 1): P0, 7 Ube3am+/p+ (3 males, 4 females) and 6 Ube3am−/p+ (3 males, 3 females) mice; P6, 6 Ube3am+/p+ (4 males, 2 females) and 13 Ube3am−/p+ (7 males, 6 females) mice; P7, 8 Ube3am+/p+ (3 males, 5 females) and 11 Ube3am−/p+ (4 males, 7 females) mice; P8, 10 Ube3am+/p+ (6 males, 4 females) and 7 Ube3am−/p+ (3 males, 4 females) mice; P14, 8 Ube3am+/p+ (6 males, 2 females) and 6 Ube3am−/p+ (2 males, 4 females) mice; P16, 7 Ube3am+/p+ (6 males, 1 female) and 10 Ube3am−/p+ (3 males, 7 females) mice; P28, 7 female Ube3am+/p+ and 5 female Ube3am−/p+ mice; P90, 5 female Ube3am+/p+ and 6 female Ube3am−/p+ mice.
Cortical area mapping (see Fig. 2C): 5 Ube3am+/p+ (2 males, 3 females) and 3 Ube3am−/p+ (1 male, 2 females) mice.
Cortical lamination (see Fig. 2F): 3 Ube3am+/p+ (1 male, 2 females) and 3 Ube3am−/p+ (1 male, 2 females) mice.
WM volumetrics (see Table 1): 7 Ube3am+/p+ (4 males, 3 females) and 6 Ube3am−/p+ (3 males, 3 females) mice.
WM/GM ratios (see Figs. 3, 4): 7 Ube3am+/p+ (4 males, 3 females) and 5 Ube3am−/p+ (3 males, 2 females) mice.
DTI tractography (see Fig. 5, Table 2): 7 Ube3am+/p+ (4 males, 3 females) and 6 Ube3am−/p+ (3 males, 3 females) mice.
Callosal electron microscopy (see Figs. 6, 7, 8): 6 Ube3am+/p+ (2 males, 4 females) and 6 Ube3am−/p+ (2 males, 4 females) mice.
Cortical cell density (see Fig. 9): 3 Ube3am+/p+ (1 male, 2 females) and 3 Ube3am−/p+ (1 male, 2 females) mice.
Sciatic nerve electron microscopy (see Figs. 10A–C, 11): 6 Ube3am+/p+ (3 males, 3 females) and 6 Ube3am−/p+ (3 males, 3 females) mice.
Sciatic nerve conduction (see Fig. 10F–H): 6 Ube3am+/p+ (3 males, 3 females) and 6 Ube3am−/p+ (3 males, 3 females) mice.
Figure 2.
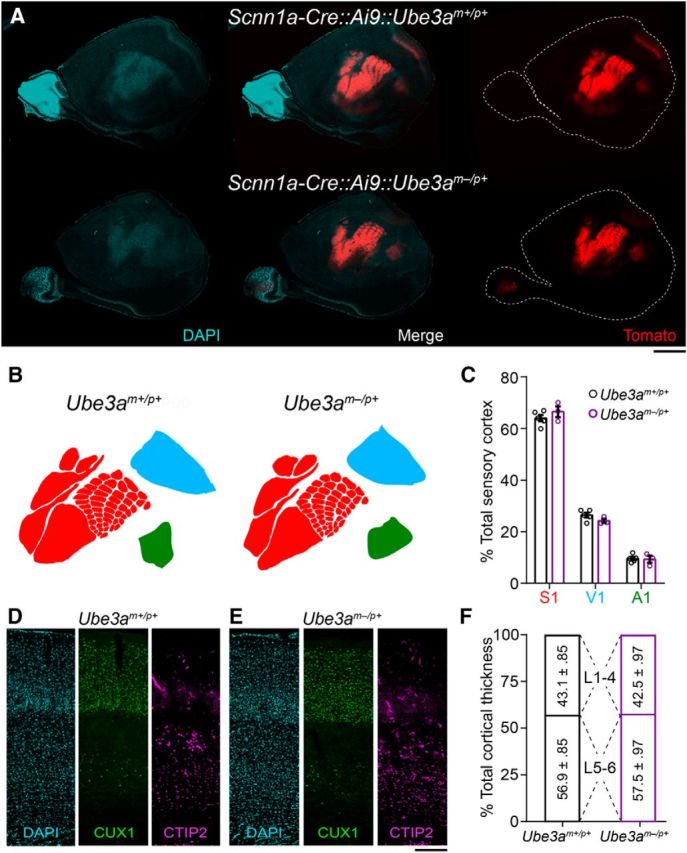
Cortical patterning is normal in adult Ube3am−/p+ mice. A, Images of DAPI-counterstained tangential cortical sections from ∼P90 wild-type (Scnn1a-Cre::Ai9::Ube3am+/p+) and Ube3am−/p+ (Scnn1a-Cre::Ai9::Ube3am−/p+) littermate mice expressing tdTomato in sensory cortices under the control of a L4-specific Cre driver. Scale bar, 1.8 mm. B, Representative sensory maps from Ube3am+/p+ and Ube3am−/p+ mice. C, Quantification of primary somatosensory (S1), visual (V1), and auditory (A1) cortical surface area as a percentage of total sensory cortical surface area (Ube3am+/p+ n = 5 mice, Ube3am−/p+ n = 3 mice). D, E, Immunostaining for the L2–4 marker CUX1 and the L5–6 marker CTIP2 with DAPI nuclear counterstaining in primary somatosensory cortex of ∼P90 Ube3am+/p+ (D) and Ube3am−/p+ (E) mice. Scale bar, 185 μm. F, Quantification of laminar contributions to cortical thickness (Ube3am+/p+ n = 3 mice, Ube3am−/p+ n = 3 mice). Data represent mean ± SEM.
Table 1.
Group comparisons of WM volume (mm3)
|
Ube3am+/p+ |
Ube3am−/p+ |
% Difference | MANCOVAa |
|||||
|---|---|---|---|---|---|---|---|---|
| EMM | SEM | EMM | SEM | F | p-value | Partial η2 | ||
| Corpus callosum | 0.29 | 0.005 | 0.25 | 0.006 | −13.5 ± 0.9 | 24.2 | 0.00061 | 0.708 |
| Internal capsule | 3.15 | 0.035 | 2.73 | 0.038 | −13.4 ± 1.0 | 69.3 | 0.00001 | 0.874 |
| Anterior commissure | 0.68 | 0.014 | 0.59 | 0.016 | −13.44 ± 1.7 | 19.4 | 0.00134 | 0.659 |
| Fornix | 0.67 | 0.018 | 0.59 | 0.020 | −11.34 ± 2.9 | 8.2 | 0.0169 | 0.452 |
| Fimbria | 1.77 | 0.041 | 1.56 | 0.044 | −11.39 ± 2.1 | 11.8 | 0.00639 | 0.541 |
aPost hoc testing of genotype effects for each tract after MANCOVA (Pillai's trace, p < 0.005; genotype as the fixed factor, imaging cohort as the covariate). Ube3am+/p+, n = 7; Ube3am−/p+, n = 6.
EMM, Estimated marginal mean.
Figure 3.

Corpus callosum and internal capsule volumes are disproportionately reduced in adult Ube3am−/p+ mice. A, B, Representative 3D volumetric renderings of cerebral cortex (magenta), corpus callosum (green), and internal capsule (cyan) from Ube3am+/p+ (A) and Ube3am−/p+ (B) mice. Insets illustrate color-coded segmentation labels in register with (left to right) horizontal, coronal, and sagittal RD image slices, which reflect the plane of view for corresponding 3D renderings (indicated by arrows). C, MRI-based quantification of total cerebral cortical volume, excluding underlying WM. D, E, Quantification of corpus callosum (D) and internal capsule (E) volume as a ratio of total cerebral cortical volume (Ube3am+/p+ n = 7 mice, Ube3am−/p+ n = 5 mice). Data represent mean ± SEM, *p ≤ 0.05, **p ≤ 0.01.
Figure 4.

Decreased ratios of WM volume to whole-brain and forebrain volumes in adult Ube3am−/p+ mice. A–E, Quantification of corpus callosum (A), internal capsule (B), anterior commissure (C), fornix (D), and fimbria (E) volumes as a ratio of both whole-brain volume and forebrain volume in Ube3am+/p+ (n = 7) and Ube3am−/p+ (n = 5) mice. Data represent mean ± SEM, *p ≤ 0.05, **p ≤ 0.01, ***p ≤ 0.001, ****p ≤ 0.0001.
Figure 5.

DTI tractography reveals deficits in callosal WM integrity in adult Ube3am−/p+ mice. A–C, Tractography-computed callosal tract (713 fibers) in register with coronal and sagittal views of the FA atlas, which was generated from the average DTI of all Ube3am+/p+ (n = 7) and Ube3am−/p+ (n = 6) mice. The isthmus of the callosum was not computed. Dorsal (A) and lateral views from right (B) and from left (C) are shown. Color scale corresponds to arc-length position for statistical sampling along the mediolateral aspect of the tract. D, Distribution of false discovery rate-corrected local p-values (−log10) for each diffusion parameter along the arc-length of the callosal tract. Dashed line indicates p = 0.05 significance threshold. E, Tract-based statistical summaries for each diffusion measure: AD, RD, MD, and FA. y-axis values for AD, RD, and MD are multiplied by 103. Data represent mean ± SEM.
Table 2.
Group comparisons of anisotropy and diffusivity
|
Ube3am+/p+ |
Ube3am−/p+ |
p-valuea | |||
|---|---|---|---|---|---|
| Mean | SEM | Mean | SEM | ||
| Corpus callosum AD | 0.62 | 0.023 | 0.54 | 0.019 | ≤0.001 |
| RD | 0.16 | 0.005 | 0.16 | 0.004 | 0.834 |
| MD | 0.31 | 0.011 | 0.28 | 0.009 | 0.005 |
| FA | 0.71 | 0.006 | 0.65 | 0.007 | ≤0.001 |
| Internal capsule AD | 0.54 | 0.008 | 0.51 | 0.009 | ≤0.001 |
| RD | 0.22 | 0.005 | 0.22 | 0.005 | 0.198 |
| MD | 0.33 | 0.006 | 0.31 | 0.006 | 0.009 |
| FA | 0.53 | 0.004 | 0.52 | 0.006 | 0.21 |
| Anterior commissure AD | 0.62 | 0.019 | 0.59 | 0.019 | 0.004 |
| RD | 0.18 | 0.003 | 0.18 | 0.002 | 0.416 |
| MD | 0.32 | 0.008 | 0.31 | 0.007 | 0.011 |
| FA | 0.65 | 0.004 | 0.65 | 0.008 | 0.056 |
| Precommissural fornix AD | 0.61 | 0.009 | 0.6 | 0.01 | 0.066 |
| RD | 0.24 | 0.004 | 0.23 | 0.005 | 0.013 |
| MD | 0.36 | 0.005 | 0.35 | 0.006 | 0.011 |
| FA | 0.55 | 0.006 | 0.55 | 0.006 | 0.611 |
| Postcommissural fornix AD | 0.66 | 0.02 | 0.62 | 0.021 | 0.002 |
| RD | 0.29 | 0.011 | 0.27 | 0.012 | 0.013 |
| MD | 0.42 | 0.014 | 0.39 | 0.015 | 0.007 |
| FA | 0.5 | 0.005 | 0.5 | 0.005 | 0.144 |
| Fimbria AD | 0.81 | 0.05 | 0.73 | 0.033 | 0.002 |
| RD | 0.2 | 0.013 | 0.18 | 0.009 | 0.01 |
| MD | 0.41 | 0.025 | 0.37 | 0.017 | 0.003 |
| FA | 0.73 | 0.007 | 0.73 | 0.003 | 0.794 |
aPost hoc testing of genotype effects using FADTTS (Zhu et al., 2011). Imaging cohort was set as the covariate. Global p-values are indicated. Ube3am+/p+, n = 7; Ube3am−/p+, n = 6.
Values for AD, RD, and MD are multiplied by 103.
Figure 6.
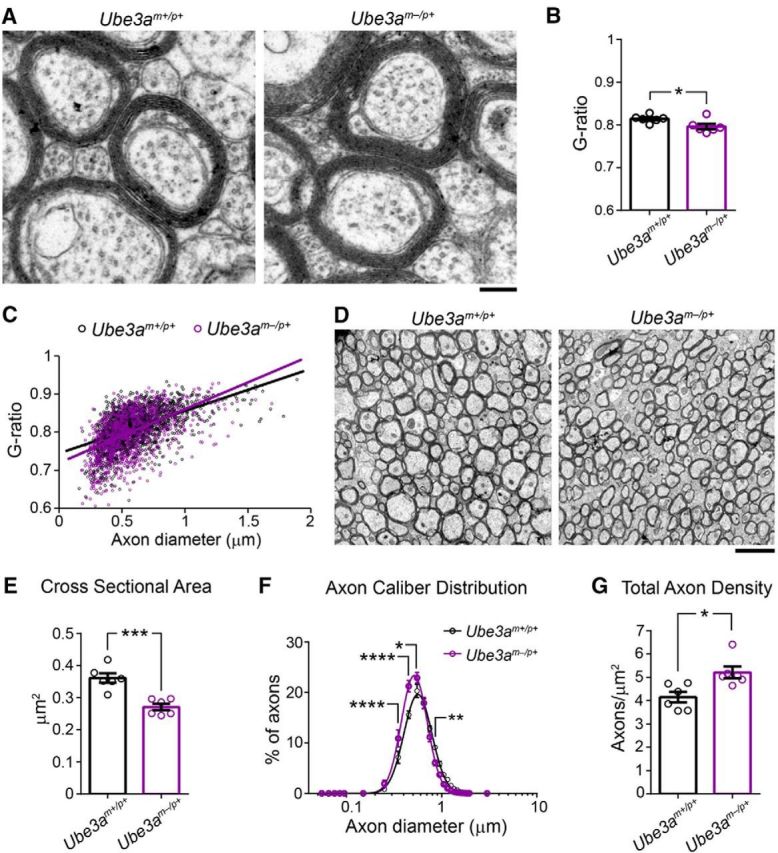
Callosal axons in adult Ube3am−/p+ mice display normal myelination but decreased caliber. A, Representative electron micrographs used to assess axon g-ratio in ∼P90 Ube3am+/p+ and Ube3am−/p+ mice. Scale bar, 0.18 μm. B, Quantification of mean axon g-ratio. C, Plots of axon g-ratio versus diameter fit with a linear function. D, Representative electron micrographic montages of the corpus callosum used to measure the cross-sectional area and packing density of myelinated axons in ∼P90 Ube3am+/p+ and Ube3am−/p+ mice. Scale bar, 2 μm. E, Quantification of the cross-sectional area of myelinated axons. F, Distribution of the diameters of myelinated axons (logarithmic scale). G, Quantification of total axon density. n = 6 mice for each genotypic group. Data represent mean ± SEM, *p ≤ 0.05, **p ≤ 0.01, ***p ≤ 0.001, ****p ≤ 0.0001.
Figure 7.
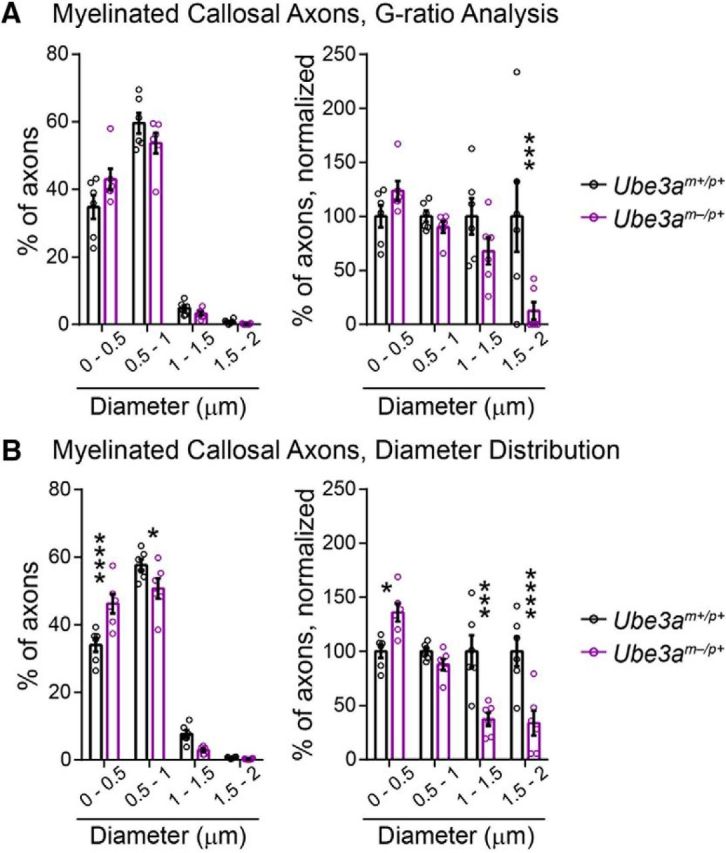
Myelinated callosal axon diameter (linear scale). A, B, Histograms of myelinated callosal axons analyzed in g-ratio (A, replotting of Fig. 6C diameter data) and axon caliber analyses (B, replotting of Fig. 6F diameter data). Left panels indicate the percentage of axons distributed among bins of the given diameter ranges. Right panels display the same data normalized to wild-type (Ube3am+/p+) values. n = 6 mice for each genotypic group. Data represent mean ± SEM, *p ≤ 0.05, **p ≤ 0.01, ***p ≤ 0.001, ****p ≤ 0.0001.
Figure 8.

Analysis of unmyelinated callosal axon caliber in adult Ube3am−/p+ mice. A, Quantification of the cross-sectional area of unmyelinated axons. B, Distribution of the diameters of unmyelinated axons (logarithmic scale). C, Left, Percentage of unmyelinated axons in the corpus callosum distributed among bins of the given diameter ranges. Right, Same data normalized to wild-type (Ube3am+/p+) values. n = 6 mice for each genotypic group. Data represent mean ± SEM.
Figure 9.

Packing density of cortical neurons is increased in adult Ube3am−/p+ mice. A, B, Immunostaining for the neuronal marker NEUN with DAPI nuclear counterstaining in primary somatosensory cortex of ∼P90 Ube3am+/p+ (A) and Ube3am−/p+ (B) mice. Scale bars, 200 μm for far-left panels, 175 μm for representative counting strips, and 18 μm for zoomed images of L5 and L2/3. C–G, Quantification of total neuronal density (C), L1–4 neuronal density (D), L5–6 neuronal density (E), glial density (F), and total cell density (G). n = 3 mice for each genotypic group. Data represent mean ± SEM, *p ≤ 0.05.
Figure 10.
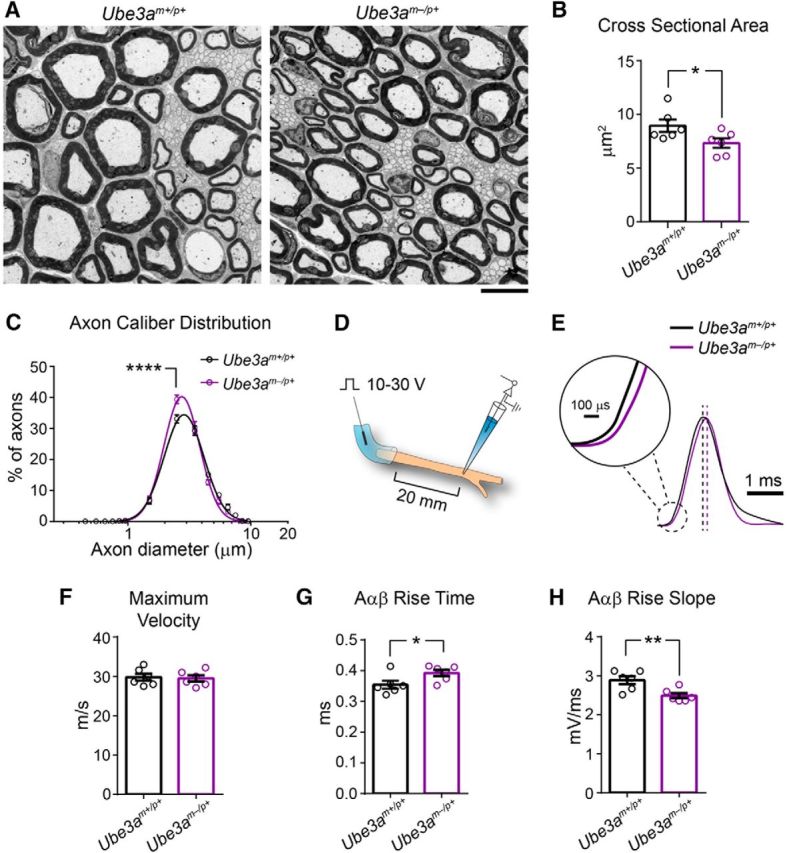
Reduced axon caliber correlates with deficits in sciatic nerve conduction in adult Ube3am−/p+ mice. A, Representative electron micrographs of the sciatic nerve from ∼P90 Ube3am+/p+ and Ube3am−/p+ mice. Scale bar, 6.4 μm. B, Quantification of the cross-sectional area of myelinated axons. C, Distribution of the diameters of myelinated axons (logarithmic scale). D, Schematic for ex vivo recording of sciatic nerve conduction. E, Averaged compound action potential for each genotypic group (amplitude-normalized). Dashed lines indicate peak of averaged compound action potentials. Scale bars, 1 ms and 100 μs (inset). F–H, Quantification of conduction velocity (F), rise time (G), and rise slope (H) for compound action potentials conducted by myelinated Aαβ fibers. n = 6 mice for each genotypic group. Data represent mean ± SEM, *p ≤ 0.05, **p ≤ 0.001, ****p ≤ 0.001.
Figure 11.

Analysis of g-ratio and diameter (linear scale) of myelinated axons in the sciatic nerve of adult Ube3am−/p+ mice. A, Quantification of mean axon g-ratio. B, Plots of axon g-ratio versus diameter, fit with a linear function. C, Axon diameter histograms, linear scale (replotting of Fig. 10C diameter data). Left panels indicate the percentage of axons distributed among bins of the given diameter ranges. Right panels display the same data normalized to wild-type (Ube3am+/p+) values. n = 6 mice for each genotypic group. Data represent mean ± SEM, **p ≤ 0.01.
We performed statistical analyses using GraphPad Prism version 6 software (RRID:SCR_002798), SPSS version 22 software (IBM, RRID:SCR_002865), and the FADTTSter tool (www.nitrc.org/projects/namicdtifiber).
Statistical analyses by experiment
Body and brain growth (see Fig. 1): two-way ANOVA, Sidak's post hoc test.
Cortical area mapping (see Fig. 2C): two-way ANOVA, Sidak's post hoc test.
Cortical lamination (see Fig. 2F): Unpaired two-tailed t test.
WM volumetrics (see Table 1): MANCOVA, setting imaging cohort as the covariate.
Callosal electron microscopy: Unpaired two-tailed t test (see Figs. 6B,E,G, 8A) and two-way repeated-measures ANOVA, Sidak's post hoc test (see Figs. 6F, 7A,B, 8B,C).
Cortical cell density (see Fig. 9C–G): Unpaired two-tailed t test.
Sciatic nerve electron microscopy: Unpaired two-tailed t test (see Figs. 10B, 11A) and two-way repeated-measures ANOVA, Sidak's post hoc test (see Figs. 10C, 11C).
Sciatic nerve conduction (see Fig. 10F–H): Unpaired two-tailed t test.
Results
Microcephaly in Ube3am−/p+ mice is associated with a disproportionate loss of WM volume
Individuals with AS are born with normal head circumference, but present with absolute microcephaly—decreased head circumference regardless of body size—within the first 8–12 months of life (Dagli et al., 2012). The emergence of microcephaly coincides with the manifestation of early neurological phenotypes, including truncal hypotonia and seizures (Fryburg et al., 1991; Dagli et al., 2012), suggesting a close link between deficits in early postnatal brain growth and AS pathophysiology. To determine whether mice lacking a functional maternal Ube3a copy (Ube3am−/p+, AS model mice) exhibit microcephaly according to a similar time course, we tracked brain weight cross-sectionally over postnatal development. Ube3am−/p+ brain growth appeared normal at birth through P8, but then the trajectory flattened relative to control, leading to statistically significant group deficits by P14 (Fig. 1A,B; two-way ANOVA for genotype × age interaction, F(7,106) = 4.38, p = 0.0003; post hoc unpaired t test with Sidak's multiple comparisons correction, t(106) = 5.11, p < 0.0001). In contrast, body weights in Ube3am−/p+ and control mice were similar up to P90, when Ube3am−/p+ mice showed evidence of adult-onset obesity (Fig. 1C; two-way ANOVA for genotype × age interaction, F(7,106) = 4.76, p = 0.0001; post hoc unpaired t test with Sidak's multiple comparisons correction, t(106) = 5.33, p < 0.0001), consistent with previous reports in mice and with clinical reports of adults with AS (van Woerden et al., 2007; Dagli et al., 2012; Huang et al., 2013; Margolis et al., 2015). Therefore, Ube3am−/p+ mice faithfully model absolute microcephaly with early postnatal onset, as is observed in AS.
Postnatally emergent microcephaly suggests a sparing of prenatal ontogenetic processes governing brain histogenesis. Accordingly, we found grossly normal cortical patterning in Ube3am−/p+ mice: sensory area maps (Fig. 2A–C; two-way ANOVA, F(2, 18 = 4.38, p = 0.1758) and lamination (Fig. 2D–F; L1–4 unpaired two-tailed t test, t(4) = 0.45, p = 0.68; L5–6 unpaired two-tailed t test, t(4) = 0.45, p = 0.68) were appropriately proportioned and indistinguishable from control. To uncover further clues as to how postnatal brain growth is affected by the loss of maternal Ube3a, we undertook a detailed MRI-based volumetric analysis of the Ube3am−/p+ brain. Brain structures comprising mostly gray matter were somewhat smaller in Ube3am−/p+ mice than in littermate controls at P90. In Ube3am−/p+ cerebral cortex, for example, volumes were reduced by an average of 7% (Fig. 3A–C; unpaired two-tailed t test, t(10) = 3.34, p = 0.008). However, we observed larger reductions in the volume of WM tracts within the Ube3am−/p+ brain. Each tract that we analyzed was at least 11% smaller than control: corpus callosum showed the greatest volumetric difference, −13.5% (Table 1). We subsequently verified that WM volume is disproportionately reduced in Ube3am−/p+ mice via ratiometric comparison of WM tract volumes with volumes for total cortex, forebrain, and whole brain in each animal (Figs. 3D,E, 4; unpaired two-tailed t tests: callosum: cortex, t(10) = 2.5, p = 0.03; callosum: forebrain, t(10) = 2.83, p = 0.02; callosum: whole brain, t(10) = 3.32, p = 0.008; capsule: cortex, t(10) = 3.93, p = 0.003; capsule: forebrain, t(10) = 4.87, p = 0.0007; capsule: whole brain, t(10) = 6.43, p < 0.0001; commissure: forebrain, t(10) = 2.78, p = 0.02; commissure: whole brain, t(10) = 3.03, p = 0.01; fornix: forebrain, t(10) = 1.3, p = 0.22; fornix: whole brain, t(10) = 1.56, p = 0.15; fimbria: forebrain, t(10) = 1.73, p = 0.11; fimbria: whole brain, t(10) = 1.96, p = 0.08).
WM integrity is globally compromised in the adult Ube3am−/p+ brain
We next investigated whether WM volumetric deficits were accompanied by microstructural abnormalities. DTI tractography of the corpus callosum (Fig. 5A–C) revealed a pronounced decrease in axial diffusivity (AD) along the entire mediolateral extent of the tract in Ube3am−/p+ mice compared with control, whereas radial diffusivity (RD) was unperturbed (Fig. 5D,E). Therefore, reductions in AD drove the decreases in mean diffusivity (MD) and fractional anisotropy (FA) that we observed for the corpus callosum (Fig. 5D,E). All tracts that we analyzed exhibited highly significant statistical effects for both AD and MD except the precommissural fornix, where decreases in AD only approached significance (Table 2). Unlike other tracts, the precomissural fornix, postcommissural fornix, and the fimbria consistently showed decreases in RD along with decreases in AD. This likely explains the lack of significant FA effects in these major efferent pathways of the hippocampus, because FA is sensitive to the disproportionality of AD and RD. We therefore conclude that compromised WM integrity—in particular, reduced AD—is a general feature of WM tracts in the adult Ube3am−/p+ brain.
Decreased axon caliber underlies altered WM microstructure in adult Ube3am−/p+ mice
A number of axonal abnormalities could lead to reduced AD within WM tracts (Mori and Zhang, 2006). We performed electron microscopy to determine factors that could explain AD deficits in Ube3am−/p+ mice. Focusing on the anterior midbody of the corpus callosum, myelination appeared grossly normal (Fig. 6A), consistent with a lack of RD deficits within this tract (Fig. 5E, Table 2) (Song et al., 2002; Song et al., 2005). Although average g-ratios for Ube3am−/p+ callosal axons were slightly decreased relative to control (Fig. 6B; unpaired two-tailed t test, t(10) = 2.47, p = 0.03), plots of axon diameter versus g-ratio suggested that this did not reflect enhanced myelination in Ube3am−/p+ mice (Fig. 6C), but rather an underrepresentation of large-caliber axons (Fig. 7A; two-way ANOVA for genotype × diameter interaction, F(3,30) = 4.43, p = 0.01; post hoc unpaired t test with Sidak's multiple comparisons correction, t(40) = 4.11, p = 0.0008), which tend to have higher g-ratios. Indeed, we found that the caliber of myelinated axons was markedly affected in the adult Ube3am−/p+ callosum: cross-sectional area was decreased by ∼25% on average (Fig. 6D,E; unpaired two-tailed t test, t(10) = 5.1, p = 0.0005) and we observed a leftward skew in the distribution of diameters (Fig. 6F; two-way repeated-measures ANOVA for genotype × diameter interaction, F(17,170) = 6.01, p < 0.0001; Fig. 7B; two-way repeated-measures ANOVA for genotype × diameter interaction, F(3,30) = 14.02, p < 0.0001), indicating reduced caliber in both large and small myelinated axons. Reductions in the caliber of unmyelinated callosal axons were much more modest and did not achieve statistical significance (Fig. 8A; unpaired two-tailed t test, t(10) = 2.09, p = 0.06; Fig. 8B; two-way repeated-measures ANOVA for genotype × diameter interaction, F(15,150) = 1.18, p = 0.3; Fig. 8C; two-way repeated-measures ANOVA for genotype × diameter interaction, F(4,40) = 1.1, p = 0.37), suggesting that loss of maternal Ube3a may affect the growth of myelinated axons preferentially.
Fewer axons or axon collaterals could also compromise WM integrity, but we found that axon-packing density was actually increased by ∼25% in the callosum of Ube3am−/p+ mice (Fig. 6G; unpaired two-tailed t test, t(10) = 3.15, p = 0.01). This finding was corroborated by evidence of increased neuronal packing in overlying neocortex (Fig. 9A–E), including in supragranular layers, which contribute the majority of axon projections that traverse the callosum en route to homotopic targets in the contralateral hemisphere (Fig. 9D; unpaired two-tailed t test, t(4) = 2.9, p = 0.04). In contrast to these differences in neuronal density, glial density was unchanged (Fig. 9F; unpaired two-tailed t test, t(4) = 0.64, p = 0.56), contributing to a statistically insignificant difference in total cell density between groups (Fig. 9G; unpaired two-tailed t test, t(4) = 1.95, p = 0.12).
Reductions in axon caliber reflect deficits in nerve conduction in adult Ube3am−/p+ mice
What is the functional significance of reduced axon caliber in Ube3am−/p+ mice? We sought to answer this question by measuring compound action potential conduction in the sciatic nerve (an easily accessible WM pathway in mice that is amenable to precise measurements of nerve conduction due to its length). First, we determined whether axon caliber deficits are generalizable to the Ube3am−/p+ sciatic nerve. We observed grossly normal myelination, but a significant reduction in mean axon caliber in sciatic nerves of Ube3am−/p+ mice compared with control (Fig. 10A,B; unpaired two-tailed t test, t(10) = 2.22, p = 0.05; Fig. 11A,B; unpaired two-tailed t test, t(10) = 0.5, p = 0.63), similar to what we had found in the corpus callosum (Fig. 6C). However, relative to callosum (Figs. 6F, 7A,B), the caliber of the largest sciatic nerve axons in Ube3am−/p+ mice was partially spared (Fig. 10C; two-way repeated-measures ANOVA for genotype × diameter interaction, F(14,140) = 3.33, p = 0.0001; Fig. 11C; two-way repeated-measures ANOVA for genotype × diameter interaction, F(3,30) = 3.8, p = 0.02; post hoc unpaired t test with Sidak's multiple comparisons correction, t(40) = 3.6, p = 0.003), perhaps because many of them arise from motor neurons in the ventral spinal cord, in which the imprinting of paternal Ube3a is relaxed (Huang et al., 2011). Accordingly, the maximum velocity of compound action potentials, a function of nerve conduction though the largest-caliber axons, was also spared in Ube3am−/p+ sciatic nerves (Fig. 10E,F; unpaired two-tailed t test, t(10) = 0.25, p = 0.81). Nevertheless, mean compound action potential rise kinetics were significantly slower in Ube3am−/p+ sciatic nerves (Fig. 10G; unpaired two-tailed t test, t(10) = 2.33, p = 0.04; Fig. 10H; unpaired two-tailed t test, t(10) = 2.46, p = 0.03), reflecting the deficit in mean axon caliber (Fig. 10B).
Discussion
The present findings indicate that Ube3am−/p+ mice closely model the microcephaly observed in AS individuals and suggest that a major factor contributing to this phenotype is globally impaired WM growth during early postnatal development. Our observations of decreased axon caliber in both the corpus callosum (Fig. 6D–F) and sciatic nerve (Fig. 10A–C) of adult Ube3am−/p+ mice lead us to speculate that the radial growth of axons may be especially perturbed by loss of maternal Ube3a.
Potential mechanisms underlying axon caliber deficits and microcephaly in Ube3am−/p+ mice
The caliber of the largest sciatic nerve axons in Ube3am−/p+ mice is relatively preserved (Fig. 10C), perhaps reflecting the persistence of paternal Ube3a expression in neurons of the ventral spinal cord (Huang et al., 2011). This is consistent with a neuron-specific role for UBE3A in regulating radial axon growth, though we cannot rule out potential effects of UBE3A haploinsufficiency in myelinating glia, which support radial axon growth subsequent to the initiation of myelination (Sánchez et al., 1996; Tomita et al., 2007; Sherman et al., 2012).
UBE3A interacts with the Armadillo repeat-containing C terminus of the abnormal spindle-like microcephaly (ASPM) protein (Singhmar and Kumar, 2011), which is encoded by the gene most frequently mutated in cases of autosomal recessive primary microcephaly (Bond et al., 2002; Nicholas et al., 2009). ASPM localizes to the centrosome and midbody, where it participates in the positioning of spindle poles and the organization of microtubules into asters, thereby enabling the proper cleavage of symmetrically dividing neuroepithelial progenitor cells (Fish et al., 2006; Paramasivam et al., 2007; Higgins et al., 2010). Notably, acute shRNA-mediated knock-down of UBE3A in immortalized human kidney cells results in mitotic abnormalities, including disorganized spindles and misseggregated chromosomes (Singhmar and Kumar, 2011). If present in neural stem cell niches in Ube3am−/p+ mice or in individuals with AS, then these defects could deplete the pool of viable neural progenitors that populate the brain with neurons, leading to microcephaly. However, Ube3am−/p+ mice, similar to individuals with AS, do not exhibit microcephaly until the postnatal period, after the completion of neurogenesis and neuronal migration (Fig. 1). Presumably, neural stem cells, which bilallelically express Ube3a (Judson et al., 2014), express sufficient UBE3A protein from the paternal allele to support normal ASPM function in the event of maternal Ube3a loss. ASPM expression wanes in postmitotic neurons (Lüers et al., 2002; Kouprina et al., 2005; Williams et al., 2015), whereas the expression of several other Armadillo repeat-containing proteins, including β-catenin, persists. Considering the numerous studies linking β-catenin signaling to axon growth, morphogenesis, and presynaptic function (Bamji et al., 2003; Elul et al., 2003; David et al., 2008; Pratt et al., 2012; Taylor et al., 2013), potential interactions between UBE3A and β-catenin during early postnatal development merit investigation.
UBE3A has been linked, albeit tentatively (Jensen et al., 2013), to regulation of the actin cytoskeleton, which supports terminal axon branching and the elaboration of developing axonal arbors (Kalil and Dent, 2014). UBE3A is also enriched at nascent presynaptic terminals and plays a role in experience-dependent refinement of synaptic architecture during the early postnatal period (Yashiro et al., 2009; Burette et al., 2017; Kim et al., 2016). Maternal Ube3a loss may thus affect the elaboration of axon terminal arbors through distinct mechanisms: directly, by disrupting the actin cytoskeleton during terminal axon branching, and/or indirectly, through deficits in synapse development and stabilization. Because terminal arbor size tends to correlate with the caliber of the parent axon (Stuermer, 1984; Roe et al., 1989; Tsuji and Liberman, 1997; Eatock et al., 2008; Perge et al., 2009), it is possible that reductions in axon caliber in Ube3am−/p+ mice are secondary to deficits in terminal axon branching.
The development and maintenance of large axons and their terminal arbors is energetically taxing. Mitochondrial volume fraction in myelinated axons generally scales quadratically to increases in axon caliber and terminal field size, possibly to match energy production to the demands of synaptic transmission within the terminal arbor (Sengupta et al., 2010; Perge et al., 2012). Although we did not find evidence of deficient mitochondrial volume fraction or morphology in the axons of Ube3am−/p+ mice in this or in previous studies (Wallace et al., 2012; Burette et al., 2017; Judson et al., 2016), UBE3A does associate with mitochondrial membranes within neurons of both early postnatal and adult mice and thus is poised to regulate mitochondrial function (Burette et al., 2017). This is consistent with recent reports of increased mitochondrial superoxide in the hippocampus of adult Ube3am−/p+ mice (Santini et al., 2015). It will be interesting to determine whether mitochondrial dysfunction is more widespread in the brains of young Ube3am−/p+ mice, possibly imposing energetic constraints on axon growth.
Abnormal WM morphology in adult Ube3am−/p+ mice: relation to neuroimaging findings in AS
Despite marked reductions in axon caliber, we found that the myelination of callosal and sciatic nerve axons was largely intact in adult Ube3am−/p+ mice (Figs. 6B,C, 11A,B). Our DTI tractography study suggests that this is generally true for other tracts in the adult Ube3am−/p+ brain as well. RD, often increased in instances of hypomyelination (Song et al., 2002; Song et al., 2005; Harsan et al., 2006; Tyszka et al., 2006), was unchanged in most tracts or even decreased (Table 2). In contrast, a DTI tractography study of children with AS found RD to be increased in WM tracts throughout the brain (Peters et al., 2011), in agreement with evidence for delayed myelination garnered from a separate T2-weighted MRI study of younger children (Harting et al., 2009). Although these seemingly discrepant findings could indicate species differences in UBE3A function, we think it more likely that they highlight the disparate developmental periods explored in our respective studies. We hypothesize that impaired radial axon growth delays the deposition of myelin within both central and peripheral WM tracts in AS and achievement of a minimum axon caliber, presumably delayed in Ube3am−/p+ mice, triggers the initiation of myelination by both oligodendrocytes and Schwann cells (Simons and Trotter, 2007; Nave and Trapp, 2008). This would suggest that myelination largely normalizes by adulthood, explaining the findings reported here. To test this hypothesis, future studies in Ube3am−/p+ mice should establish the developmental profile of axon caliber deficits in relation to the course of myelination. Likewise, future AS neuroimaging studies should include adult subjects. Prior neuroimaging studies focused on AS individuals with large deletions of maternal 15q11-q13 (Harting et al., 2009; Peters et al., 2011), which result in the haploinsufficiency of important genes (e.g., GABAA receptor subunits) in addition to UBE3A (Margolis et al., 2015). This facet of the disorder, not modeled by the Ube3am−/p+ mouse, could also contribute to the WM pathology associated with maternal UBE3A loss in humans.
Functional implications of axon caliber deficits in adult Ube3am−/p+ mice
Reduced axon caliber was commensurate with the slowing of compound action potentials in the sciatic nerves of Ube3am−/p+ mice (Fig. 10). This functional deficit may contribute to the motor dysfunction seen in the model (Jiang et al., 1998; van Woerden et al., 2007; Huang et al., 2013; Mandel-Brehm et al., 2015; Santini et al., 2015). If slowed conduction of action potentials is a property of all WM tracts in Ube3am−/p+ mice, this could have a profound brain-wide impact on neural circuit function. For example, slowed conduction could disrupt brain rhythms that provide a temporal framework for grouping and integrating information within and across distributed neural networks; abnormal brain rhythmicity is well documented in both Ube3am−/p+ mice and in individuals with AS (Colas et al., 2005; Thibert et al., 2013; Judson et al., 2016) and may precipitate a range of phenotypes, including cognitive deficits, sleep disturbances, and seizures. Brain rhythms are highly conserved over the course of mammalian evolution, and large-caliber axons have been proposed to enable interareal neural synchrony despite tremendous increases in brain scale. Importantly, the bigger the brain, the greater the dependence on rapidly conducting, large-caliber axons (Buzsáki et al., 2013). Therefore, we suggest that decreased axon caliber consequent to loss of UBE3A function may have a far greater functional impact in humans than in mice.
The extent to which axon caliber deficits contribute directly to neural circuit and behavioral dysfunction in Ube3am−/p+ mice remains to be determined. Nevertheless, our findings demonstrate that WM abnormalities are a pervasive feature of the adult Ube3am−/p+ brain and these abnormalities are easily detected by standard structural neuroimaging. This also appears to be the case for children with AS (Harting et al., 2009; Peters et al., 2011; Wilson et al., 2011; Tiwari et al., 2012); importantly, the severity of WM microstructural defects in these children may be associated with clinical outcome (Peters et al., 2011). Structural neuroimaging-based studies could further explore the relationship between WM defects and clinical phenotypes in AS and potentially establish WM volume and integrity as noninvasive biomarkers of both phenotypic progression and response to therapeutic intervention in the disorder.
Footnotes
This work was supported by the National Institutes of Health (National Research Service Award Fellowship 5F32NS077686 to M.C.J.), the Angelman Syndrome Foundation (B.D.P.), National Institute of Neurological Disorders and Stroke–National Institutes of Health (NINDS Grant 5RO1NS039444 to R.J.W. and NINDS Grant 1RO1NS085093 to B.D.P.). Confocal imaging was supported by NINDS Center Grant P30 NS045892 and NICHD Center Grant P30 HD03110. We thank Ji Eun Han and Hyojin Kim for help genotyping and maintaining animal colonies and Kristen Phend for histological support.
The authors declare no competing financial interests.
References
- Avants BB, Epstein CL, Grossman M, Gee JC (2008) Symmetric diffeomorphic image registration with cross-correlation: evaluating automated labeling of elderly and neurodegenerative brain. Med Image Anal 12:26–41. 10.1016/j.media.2007.06.004 [DOI] [PMC free article] [PubMed] [Google Scholar]
- Bamji SX, Shimazu K, Kimes N, Huelsken J, Birchmeier W, Lu B, Reichardt LF (2003) Role of beta-catenin in synaptic vesicle localization and presynaptic assembly. Neuron 40:719–731. 10.1016/S0896-6273(03)00718-9 [DOI] [PMC free article] [PubMed] [Google Scholar]
- Bond J, Roberts E, Mochida GH, Hampshire DJ, Scott S, Askham JM, Springell K, Mahadevan M, Crow YJ, Markham AF, Walsh CA, Woods CG (2002) ASPM is a major determinant of cerebral cortical size. Nat Genet 32:316–320. 10.1038/ng995 [DOI] [PubMed] [Google Scholar]
- Budin F, Hoogstoel M, Reynolds P, Grauer M, O'Leary-Moore SK, Oguz I (2013) Fully automated rodent brain MR image processing pipeline on a Midas server: from acquired images to region-based statistics. Front Neuroinform 7:15. 10.3389/fninf.2013.00015 [DOI] [PMC free article] [PubMed] [Google Scholar]
- Burette AC, Judson MC, Burette S, Phend KD, Philpot BD, Weinberg RJ (2017) Subcellular organization of UBE3A in neurons. J Comp Neurol 525:233–251. 10.1002/cne.24063 [DOI] [PMC free article] [PubMed] [Google Scholar]
- Buzsáki G, Logothetis N, Singer W (2013) Scaling brain size, keeping timing: evolutionary preservation of brain rhythms. Neuron 80:751–764. 10.1016/j.neuron.2013.10.002 [DOI] [PMC free article] [PubMed] [Google Scholar]
- Colas D, Wagstaff J, Fort P, Salvert D, Sarda N (2005) Sleep disturbances in Ube3a maternal-deficient mice modeling Angelman syndrome. Neurobiol Dis 20:471–478. 10.1016/j.nbd.2005.04.003 [DOI] [PubMed] [Google Scholar]
- Cooper EM, Hudson AW, Amos J, Wagstaff J, Howley PM (2004) Biochemical analysis of Angelman syndrome-associated mutations in the E3 ubiquitin ligase E6-associated protein. J Biol Chem 279:41208–41217. 10.1074/jbc.M401302200 [DOI] [PubMed] [Google Scholar]
- Dagli A, Buiting K, Williams CA (2012) Molecular and clinical aspects of Angelman syndrome. Mol Syndromol 2:100–112. [DOI] [PMC free article] [PubMed] [Google Scholar]
- David MD, Yeramian A, Duñach M, Llovera M, Cantí C, de Herreros AG, Comella JX, Herreros J (2008) Signalling by neurotrophins and hepatocyte growth factor regulates axon morphogenesis by differential beta-catenin phosphorylation. J Cell Sci 121:2718–2730. 10.1242/jcs.029660 [DOI] [PubMed] [Google Scholar]
- Eatock RA, Xue J, Kalluri R (2008) Ion channels in mammalian vestibular afferents may set regularity of firing. J Exp Biol 211:1764–1774. 10.1242/jeb.017350 [DOI] [PMC free article] [PubMed] [Google Scholar]
- El Hokayem J, Nawaz Z (2014) E6AP in the brain: one protein, dual function, multiple diseases. Mol Neurobiol 49:827–839. 10.1007/s12035-013-8563-y [DOI] [PubMed] [Google Scholar]
- Elul TM, Kimes NE, Kohwi M, Reichardt LF (2003) N- and C-terminal domains of beta-catenin, respectively, are required to initiate and shape axon arbors of retinal ganglion cells in vivo. J Neurosci 23:6567–6575. [DOI] [PMC free article] [PubMed] [Google Scholar]
- Fish JL, Kosodo Y, Enard W, Pääbo S, Huttner WB (2006) Aspm specifically maintains symmetric proliferative divisions of neuroepithelial cells. Proc Natl Acad Sci U S A 103:10438–10443. 10.1073/pnas.0604066103 [DOI] [PMC free article] [PubMed] [Google Scholar]
- Fryburg JS, Breg WR, Lindgren V (1991) Diagnosis of Angelman syndrome in infants. Am J Med Genet 38:58–64. 10.1002/ajmg.1320380114 [DOI] [PubMed] [Google Scholar]
- Goodlett CB, Fletcher PT, Gilmore JH, Gerig G (2009) Group analysis of DTI fiber tract statistics with application to neurodevelopment. Neuroimage 45:S133–142. 10.1016/j.neuroimage.2008.10.060 [DOI] [PMC free article] [PubMed] [Google Scholar]
- Harsan LA, Poulet P, Guignard B, Steibel J, Parizel N, de Sousa PL, Boehm N, Grucker D, Ghandour MS (2006) Brain dysmyelination and recovery assessment by noninvasive in vivo diffusion tensor magnetic resonance imaging. J Neurosci Res 83:392–402. 10.1002/jnr.20742 [DOI] [PubMed] [Google Scholar]
- Harting I, Seitz A, Rating D, Sartor K, Zschocke J, Janssen B, Ebinger F, Wolf NI (2009) Abnormal myelination in Angelman syndrome. Eur J Paediatr Neurol 13:271–276. 10.1016/j.ejpn.2008.04.005 [DOI] [PubMed] [Google Scholar]
- Higgins J, Midgley C, Bergh AM, Bell SM, Askham JM, Roberts E, Binns RK, Sharif SM, Bennett C, Glover DM, Woods CG, Morrison EE, Bond J (2010) Human ASPM participates in spindle organisation, spindle orientation and cytokinesis. BMC Cell Biol 11:85. 10.1186/1471-2121-11-85 [DOI] [PMC free article] [PubMed] [Google Scholar]
- Huang HS, Allen JA, Mabb AM, King IF, Miriyala J, Taylor-Blake B, Sciaky N, Dutton JW Jr, Lee HM, Chen X, Jin J, Bridges AS, Zylka MJ, Roth BL, Philpot BD (2011) Topoisomerase inhibitors unsilence the dormant allele of Ube3a in neurons. Nature 481:185–189. 10.1038/nature10726 [DOI] [PMC free article] [PubMed] [Google Scholar]
- Huang HS, Burns AJ, Nonneman RJ, Baker LK, Riddick NV, Nikolova VD, Riday TT, Yashiro K, Philpot BD, Moy SS (2013) Behavioral deficits in an Angelman syndrome model: effects of genetic background and age. Behav Brain Res 243:79–90. 10.1016/j.bbr.2012.12.052 [DOI] [PMC free article] [PubMed] [Google Scholar]
- Jensen L, Farook MF, Reiter LT (2013) Proteomic profiling in Drosophila reveals potential Dube3a regulation of the actin cytoskeleton and neuronal homeostasis. PLoS One 8:e61952. 10.1371/journal.pone.0061952 [DOI] [PMC free article] [PubMed] [Google Scholar]
- Jiang YH, Armstrong D, Albrecht U, Atkins CM, Noebels JL, Eichele G, Sweatt JD, Beaudet AL (1998) Mutation of the Angelman ubiquitin ligase in mice causes increased cytoplasmic p53 and deficits of contextual learning and long-term potentiation. Neuron 21:799–811. 10.1016/S0896-6273(00)80596-6 [DOI] [PubMed] [Google Scholar]
- Joshi S, Davis B, Jomier M, Gerig G (2004) Unbiased diffeomorphic atlas construction for computational anatomy. Neuroimage 23:S151–S160. 10.1016/j.neuroimage.2004.07.068 [DOI] [PubMed] [Google Scholar]
- Judson MC, Sosa-Pagan JO, Del Cid WA, Han JE, Philpot BD (2014) Allelic specificity of Ube3a expression in the mouse brain during postnatal development. J Comp Neurol 522:1874–1896. 10.1002/cne.23507 [DOI] [PMC free article] [PubMed] [Google Scholar]
- Judson MC, Wallace ML, Sidorov MS, Burette AC, Gu B, van Woerden GM, King IF, Han JE, Zylka MJ, Elgersma Y, Weinberg RJ, Philpot BD (2016) GABAergic neuron-specific loss of Ube3a causes Angelman syndrome-like EEG abnormalities and enhances seizure susceptibility. Neuron 90:56–69. 10.1016/j.neuron.2016.02.040 [DOI] [PMC free article] [PubMed] [Google Scholar]
- Kalil K, Dent EW (2014) Branch management: mechanisms of axon branching in the developing vertebrate CNS. Nat Rev Neurosci 15:7–18. 10.1038/nrc3860 [DOI] [PMC free article] [PubMed] [Google Scholar]
- Kim H, Kunz PA, Mooney R, Philpot BD, Smith SL (2016) Maternal loss of Ube3a impairs experience-driven dendritic spine maintenance in the developing visual cortex. J Neurosci 36:4888–4894. 10.1523/JNEUROSCI.4204-15.2016 [DOI] [PMC free article] [PubMed] [Google Scholar]
- Kishino T, Lalande M, Wagstaff J (1997) UBE3A/E6-AP mutations cause Angelman syndrome. Nat Genet 15:70–73. 10.1038/ng0197-70 [DOI] [PubMed] [Google Scholar]
- Kouprina N, Pavlicek A, Collins NK, Nakano M, Noskov VN, Ohzeki J, Mochida GH, Risinger JI, Goldsmith P, Gunsior M, Solomon G, Gersch W, Kim JH, Barrett JC, Walsh CA, Jurka J, Masumoto H, Larionov V (2005) The microcephaly ASPM gene is expressed in proliferating tissues and encodes for a mitotic spindle protein. Hum Mol Genet 14:2155–2165. 10.1093/hmg/ddi220 [DOI] [PubMed] [Google Scholar]
- Lüers GH, Michels M, Schwaab U, Franz T (2002) Murine calmodulin binding protein 1 (Calmbp1): tissue-specific expression during development and in adult tissues. Mech Dev 118:229–232. 10.1016/S0925-4773(02)00253-8 [DOI] [PubMed] [Google Scholar]
- Ma Y, Hof PR, Grant SC, Blackband SJ, Bennett R, Slatest L, McGuigan MD, Benveniste H (2005) A three-dimensional digital atlas database of the adult C57BL/6J mouse brain by magnetic resonance microscopy. Neuroscience 135:1203–1215. 10.1016/j.neuroscience.2005.07.014 [DOI] [PubMed] [Google Scholar]
- Mabb AM, Ehlers MD (2010) Ubiquitination in postsynaptic function and plasticity. Annu Rev Cell Dev Biol 26:179–210. 10.1146/annurev-cellbio-100109-104129 [DOI] [PMC free article] [PubMed] [Google Scholar]
- Mabb AM, Judson MC, Zylka MJ, Philpot BD (2011) Angelman syndrome: insights into genomic imprinting and neurodevelopmental phenotypes. Trends Neurosci 34:293–303. 10.1016/j.tins.2011.04.001 [DOI] [PMC free article] [PubMed] [Google Scholar]
- Madisen L, Zwingman TA, Sunkin SM, Oh SW, Zariwala HA, Gu H, Ng LL, Palmiter RD, Hawrylycz MJ, Jones AR, Lein ES, Zeng H (2010) A robust and high-throughput Cre reporting and characterization system for the whole mouse brain. Nat Neurosci 13:133–140. 10.1038/nn.2467 [DOI] [PMC free article] [PubMed] [Google Scholar]
- Mandel-Brehm C, Salogiannis J, Dhamne SC, Rotenberg A, Greenberg ME (2015) Seizure-like activity in a juvenile Angelman syndrome mouse model is attenuated by reducing Arc expression. Proc Natl Acad Sci U S A 112:5129–5134. 10.1073/pnas.1504809112 [DOI] [PMC free article] [PubMed] [Google Scholar]
- Margolis SS, Sell GL, Zbinden MA, Bird LM (2015) Angelman syndrome. Neurotherapeutics 12:641–650. 10.1007/s13311-015-0361-y [DOI] [PMC free article] [PubMed] [Google Scholar]
- Matsuura T, Sutcliffe JS, Fang P, Galjaard RJ, Jiang YH, Benton CS, Rommens JM, Beaudet AL (1997) De novo truncating mutations in E6-AP ubiquitin-protein ligase gene (UBE3A) in Angelman syndrome. Nat Genet 15:74–77. 10.1038/ng0197-74 [DOI] [PubMed] [Google Scholar]
- Mori S, Zhang J (2006) Principles of diffusion tensor imaging and its applications to basic neuroscience research. Neuron 51:527–539. 10.1016/j.neuron.2006.08.012 [DOI] [PubMed] [Google Scholar]
- Mulherkar SA, Jana NR (2010) Loss of dopaminergic neurons and resulting behavioural deficits in mouse model of Angelman syndrome. Neurobiol Dis 40:586–592. 10.1016/j.nbd.2010.08.002 [DOI] [PubMed] [Google Scholar]
- Nave KA, Trapp BD (2008) Axon-glial signaling and the glial support of axon function. Annu Rev Neurosci 31:535–561. 10.1146/annurev.neuro.30.051606.094309 [DOI] [PubMed] [Google Scholar]
- Nawaz Z, Lonard DM, Smith CL, Lev-Lehman E, Tsai SY, Tsai MJ, O'Malley BW (1999) The Angelman syndrome-associated protein, E6-AP, is a coactivator for the nuclear hormone receptor superfamily. Mol Cell Biol 19:1182–1189. 10.1128/MCB.19.2.1182 [DOI] [PMC free article] [PubMed] [Google Scholar]
- Nicholas AK, Swanson EA, Cox JJ, Karbani G, Malik S, Springell K, Hampshire D, Ahmed M, Bond J, Di Benedetto D, Fichera M, Romano C, Dobyns WB, Woods CG (2009) The molecular landscape of ASPM mutations in primary microcephaly. J Med Genet 46:249–253. 10.1136/jmg.2008.062380 [DOI] [PMC free article] [PubMed] [Google Scholar]
- Paramasivam M, Chang YJ, LoTurco JJ (2007) ASPM and citron kinase co-localize to the midbody ring during cytokinesis. Cell Cycle 6:1605–1612. 10.4161/cc.6.13.4356 [DOI] [PubMed] [Google Scholar]
- Perge JA, Koch K, Miller R, Sterling P, Balasubramanian V (2009) How the optic nerve allocates space, energy capacity, and information. J Neurosci 29:7917–7928. 10.1523/JNEUROSCI.5200-08.2009 [DOI] [PMC free article] [PubMed] [Google Scholar]
- Perge JA, Niven JE, Mugnaini E, Balasubramanian V, Sterling P (2012) Why do axons differ in caliber? J Neurosci 32:626–638. 10.1523/JNEUROSCI.4254-11.2012 [DOI] [PMC free article] [PubMed] [Google Scholar]
- Peters SU, Kaufmann WE, Bacino CA, Anderson AW, Adapa P, Chu Z, Yallampalli R, Traipe E, Hunter JV, Wilde EA (2011) Alterations in white matter pathways in Angelman syndrome. Dev Med Child Neurol 53:361–367. 10.1111/j.1469-8749.2010.03838.x [DOI] [PMC free article] [PubMed] [Google Scholar]
- Pillai AM, Thaxton C, Pribisko AL, Cheng JG, Dupree JL, Bhat MA (2009) Spatiotemporal ablation of myelinating glia-specific neurofascin (Nfasc NF155) in mice reveals gradual loss of paranodal axoglial junctions and concomitant disorganization of axonal domains. J Neurosci Res 87:1773–1793. 10.1002/jnr.22015 [DOI] [PMC free article] [PubMed] [Google Scholar]
- Pratt T, Davey JW, Nowakowski TJ, Raasumaa C, Rawlik K, McBride D, Clinton M, Mason JO, Price DJ (2012) The expression and activity of beta-catenin in the thalamus and its projections to the cerebral cortex in the mouse embryo. BMC Neurosci 13:20. 10.1186/1471-2202-13-20 [DOI] [PMC free article] [PubMed] [Google Scholar]
- Reid G, Hübner MR, Métivier R, Brand H, Denger S, Manu D, Beaudouin J, Ellenberg J, Gannon F (2003) Cyclic, proteasome-mediated turnover of unliganded and liganded ERalpha on responsive promoters is an integral feature of estrogen signaling. Mol Cell 11:695–707. 10.1016/S1097-2765(03)00090-X [DOI] [PubMed] [Google Scholar]
- Roe AW, Garraghty PE, Sur M (1989) Terminal arbors of single ON-center and OFF-center X and Y retinal ganglion cell axons within the ferret's lateral geniculate nucleus. J Comp Neurol 288:208–242. 10.1002/cne.902880203 [DOI] [PubMed] [Google Scholar]
- Rougeulle C, Glatt H, Lalande M (1997) The Angelman syndrome candidate gene, UBE3A/E6-AP, is imprinted in brain. Nat Genet 17:14–15. 10.1038/ng0997-14 [DOI] [PubMed] [Google Scholar]
- Sánchez I, Hassinger L, Paskevich PA, Shine HD, Nixon RA (1996) Oligodendroglia regulate the regional expansion of axon caliber and local accumulation of neurofilaments during development independently of myelin formation. J Neurosci 16:5095–5105. [DOI] [PMC free article] [PubMed] [Google Scholar]
- Santini E, Turner KL, Ramaraj AB, Murphy MP, Klann E, Kaphzan H (2015) Mitochondrial superoxide contributes to hippocampal synaptic dysfunction and memory deficits in Angelman syndrome model mice. J Neurosci 35:16213–16220. 10.1523/JNEUROSCI.2246-15.2015 [DOI] [PMC free article] [PubMed] [Google Scholar]
- Schneider CA, Rasband WS, Eliceiri KW (2012) NIH Image to ImageJ: 25 years of image analysis. Nat Methods 9:671–675. 10.1038/nmeth.2089 [DOI] [PMC free article] [PubMed] [Google Scholar]
- Sell GL, Margolis SS (2015) From UBE3A to Angelman syndrome: a substrate perspective. Front Neurosci 9:322. 10.3389/fnins.2015.00322 [DOI] [PMC free article] [PubMed] [Google Scholar]
- Sengupta B, Stemmler M, Laughlin SB, Niven JE (2010) Action potential energy efficiency varies among neuron types in vertebrates and invertebrates. PLoS Comput Biol 6:e1000840. 10.1371/journal.pcbi.1000840 [DOI] [PMC free article] [PubMed] [Google Scholar]
- Sherman DL, Krols M, Wu LM, Grove M, Nave KA, Gangloff YG, Brophy PJ (2012) Arrest of myelination and reduced axon growth when Schwann cells lack mTOR. J Neurosci 32:1817–1825. 10.1523/JNEUROSCI.4814-11.2012 [DOI] [PMC free article] [PubMed] [Google Scholar]
- Simons M, Trotter J (2007) Wrapping it up: the cell biology of myelination. Curr Opin Neurobiol 17:533–540. 10.1016/j.conb.2007.08.003 [DOI] [PubMed] [Google Scholar]
- Singhmar P, Kumar A (2011) Angelman syndrome protein UBE3A interacts with primary microcephaly protein ASPM, localizes to centrosomes and regulates chromosome segregation. PLoS One 6:e20397. 10.1371/journal.pone.0020397 [DOI] [PMC free article] [PubMed] [Google Scholar]
- Song SK, Sun SW, Ramsbottom MJ, Chang C, Russell J, Cross AH (2002) Dysmyelination revealed through MRI as increased radial (but unchanged axial) diffusion of water. Neuroimage 17:1429–1436. 10.1006/nimg.2002.1267 [DOI] [PubMed] [Google Scholar]
- Song SK, Yoshino J, Le TQ, Lin SJ, Sun SW, Cross AH, Armstrong RC (2005) Demyelination increases radial diffusivity in corpus callosum of mouse brain. Neuroimage 26:132–140. 10.1016/j.neuroimage.2005.01.028 [DOI] [PubMed] [Google Scholar]
- Stuermer CA. (1984) Rules for retinotectal terminal arborizations in the goldfish optic tectum: a whole-mount study. J Comp Neurol 229:214–232. 10.1002/cne.902290207 [DOI] [PubMed] [Google Scholar]
- Sutcliffe JS, Jiang YH, Galijaard RJ, Matsuura T, Fang P, Kubota T, Christian SL, Bressler J, Cattanach B, Ledbetter DH, Beaudet AL (1997) The E6-Ap ubiquitin-protein ligase (UBE3A) gene is localized within a narrowed Angelman syndrome critical region. Genome Res 7:368–377. 10.1101/gr.7.4.368 [DOI] [PMC free article] [PubMed] [Google Scholar]
- Taylor AM, Wu J, Tai HC, Schuman EM (2013) Axonal translation of beta-catenin regulates synaptic vesicle dynamics. J Neurosci 33:5584–5589. 10.1523/JNEUROSCI.2944-12.2013 [DOI] [PMC free article] [PubMed] [Google Scholar]
- Thibert RL, Larson AM, Hsieh DT, Raby AR, Thiele EA (2013) Neurologic manifestations of Angelman syndrome. Pediatr Neurol 48:271–279. 10.1016/j.pediatrneurol.2012.09.015 [DOI] [PubMed] [Google Scholar]
- Tiwari VN, Jeong JW, Wilson BJ, Behen ME, Chugani HT, Sundaram SK (2012) Relationship between aberrant brain connectivity and clinical features in Angelman Syndrome: a new method using tract based spatial statistics of DTI color-coded orientation maps. Neuroimage 59:349–355. 10.1016/j.neuroimage.2011.07.067 [DOI] [PMC free article] [PubMed] [Google Scholar]
- Tomita K, Kubo T, Matsuda K, Fujiwara T, Yano K, Winograd JM, Tohyama M, Hosokawa K (2007) The neurotrophin receptor p75NTR in Schwann cells is implicated in remyelination and motor recovery after peripheral nerve injury. Glia 55:1199–1208. 10.1002/glia.20533 [DOI] [PubMed] [Google Scholar]
- Tsuji J, Liberman MC (1997) Intracellular labeling of auditory nerve fibers in guinea pig: central and peripheral projections. J Comp Neurol 381:188–202. [PubMed] [Google Scholar]
- Tyszka JM, Readhead C, Bearer EL, Pautler RG, Jacobs RE (2006) Statistical diffusion tensor histology reveals regional dysmyelination effects in the shiverer mouse mutant. Neuroimage 29:1058–1065. 10.1016/j.neuroimage.2005.08.037 [DOI] [PMC free article] [PubMed] [Google Scholar]
- van Woerden GM, Harris KD, Hojjati MR, Gustin RM, Qiu S, de Avila Freire R, Jiang YH, Elgersma Y, Weeber EJ (2007) Rescue of neurological deficits in a mouse model for Angelman syndrome by reduction of alphaCaMKII inhibitory phosphorylation. Nat Neurosci 10:280–282. 10.1038/nn1845 [DOI] [PubMed] [Google Scholar]
- Verde AR, Budin F, Berger JB, Gupta A, Farzinfar M, Kaiser A, Ahn M, Johnson H, Matsui J, Hazlett HC, Sharma A, Goodlett C, Shi Y, Gouttard S, Vachet C, Piven J, Zhu H, Gerig G, Styner M (2014) UNC-Utah NA-MIC framework for DTI fiber tract analysis. Front Neuroinform 7:51. 10.3389/fninf.2013.00051 [DOI] [PMC free article] [PubMed] [Google Scholar]
- Wallace ML, Burette AC, Weinberg RJ, Philpot BD (2012) Maternal loss of Ube3a produces an excitatory/inhibitory imbalance through neuron type-specific synaptic defects. Neuron 74:793–800. 10.1016/j.neuron.2012.03.036 [DOI] [PMC free article] [PubMed] [Google Scholar]
- Williams SE, Garcia I, Crowther AJ, Li S, Stewart A, Liu H, Lough KJ, O'Neill S, Veleta K, Oyarzabal EA, Merrill JR, Shih YY, Gershon TR (2015) Aspm sustains postnatal cerebellar neurogenesis and medulloblastoma growth in mice. Development 142:3921–3932. 10.1242/dev.124271 [DOI] [PMC free article] [PubMed] [Google Scholar]
- Wilson BJ, Sundaram SK, Huq AH, Jeong JW, Halverson SR, Behen ME, Bui DQ, Chugani HT (2011) Abnormal language pathway in children with Angelman syndrome. Pediatr Neurol 44:350–356. 10.1016/j.pediatrneurol.2010.12.002 [DOI] [PMC free article] [PubMed] [Google Scholar]
- Yamasaki K, Joh K, Ohta T, Masuzaki H, Ishimaru T, Mukai T, Niikawa N, Ogawa M, Wagstaff J, Kishino T (2003) Neurons but not glial cells show reciprocal imprinting of sense and antisense transcripts of Ube3a. Hum Mol Genet 12:837–847. 10.1093/hmg/ddg106 [DOI] [PubMed] [Google Scholar]
- Yashiro K, Riday TT, Condon KH, Roberts AC, Bernardo DR, Prakash R, Weinberg RJ, Ehlers MD, Philpot BD (2009) Ube3a is required for experience-dependent maturation of the neocortex. Nat Neurosci 12:777–783. 10.1038/nn.2327 [DOI] [PMC free article] [PubMed] [Google Scholar]
- Yushkevich PA, Piven J, Hazlett HC, Smith RG, Ho S, Gee JC, Gerig G (2006) User-guided 3D active contour segmentation of anatomical structures: significantly improved efficiency and reliability. Neuroimage 31:1116–1128. 10.1016/j.neuroimage.2006.01.015 [DOI] [PubMed] [Google Scholar]
- Zhu H, Kong L, Li R, Styner M, Gerig G, Lin W, Gilmore JH (2011) FADTTS: functional analysis of diffusion tensor tract statistics. Neuroimage 56:1412–1425. 10.1016/j.neuroimage.2011.01.075 [DOI] [PMC free article] [PubMed] [Google Scholar]