

Abstract
The identification of distinct cell-types within the basal ganglia has played a critical role in our understanding of basal ganglia function and the treatment of neurological disorders. The external globus pallidus (GPe) is a key contributor to motor suppressing pathways in the basal ganglia, yet its neuronal heterogeneity has remained an untapped resource for therapeutic interventions. Here, we demonstrate that optogenetic interventions that dissociate the activity of two neuronal populations in the GPe – elevating the activity of PV-GPe neurons over that of Lhx6-GPe neurons – restores movement in dopamine depleted mice and attenuates pathological activity of basal ganglia output neurons for hours beyond stimulation. These results establish the utility of cell-specific interventions in the GPe to target functionally distinct pathways, with the potential to induce long-lasting recovery of movement despite the continued absence of dopamine.
Introduction
Cell-types in neural circuits provide a functional diversity that can be harnessed to treat neurological disorders. The identification of distinct cell-types within the basal ganglia has played a critical role in our understanding of basal ganglia function and the treatment of neurological disorders, particularly Parkinson’s disease (PD). However, a major limitation of PD treatments is that they provide only transient relief of symptoms, which rapidly return if a drug dose is missed or deep brain stimulation (DBS) is discontinued.
The external globus pallidus (GPe) is a key contributor to motor suppressing pathways in the basal ganglia, yet its neuronal heterogeneity has remained an untapped resource for therapeutic interventions. It extends projections to all nuclei within the basal ganglia as well as the thalamus, amygdala, brainstem, and cortex1–3, and has been implicated as a critical node in the generation and amplification of pathological activity in the dopamine depleted (DD) state4–6. Recently, molecular and genetic strategies have been developed to subdivide GPe neurons into different subpopulations that vary in physiological and anatomical projections1, 2, 7–10. Two major subdivisions are ‘prototypical’ and ‘arkypallidal’ neurons8, 10, 11. Approximately 75–80% of GPe neurons are prototypical, meaning they have high, regular firing rates in vivo and project strongly to downstream basal ganglia nuclei7, 8. Within the prototypical population, neurons can be further subidivded based on expression of parvalbumin (PV-GPe) and lim homeobox 6 (Lhx6-GPe)2, 12. Although expression of these markers is partially overlapping7–9, 12, as a whole, PV and Lhx6 populations differ in their intrinsic physiology and projection densities to downstream nuclei2. To date, however, the behavioral significance of these neuronal subdivisions has not been directly demonstrated.
Here, we demonstrate that in DD mice, transiently dissociating the activity of PV-GPe and Lhx6-GPe subpopulations induces long-lasting recovery of movement and reversal of pathological activity in the basal ganglia circuit that persists for hours beyond stimulation. These prokinetic effects are only engaged by restricting manipulations to particular neuronal subsets, and not by manipulations that modulate all GPe neurons simultaneously. These results establish the behavioral relevance of functionally distinct neuronal subpopulations in the GPe and suggests their potential as therapeutic nodes for the long-term restoration of movement in PD.
Results
Global GPe Stimulation Does Not Restore Movement in DD Mice
A prediction of the classic model of basal ganglia function under dopamine depleted (DD) conditions is that increasing firing rates of GPe neurons should improve movement13, 14. To test this hypothesis, we expressed channelrhodopsin (ChR2) in all GPe neurons under control of the hSyn promotor (hSyn-ChR2) (Fig. 1a) and measured the efficacy of global GPe stimulation to rescue immobility and bradykinesia in bilaterally DD mice (see methods, Fig. S1a–b, and S2a–c).
Figure 1. Global GPe stimulation does not rescue movement in DD mice.

(a) Schematic of global optogenetic stimulation in the GPe. GPe projections to the SNr are represented as a dashed line to indicate omission of the STN. (b) Percentage of time spent in the immobile state before, during, and after stimulation (n = 4). Stimulation epochs are indicated with vertical blue lines. (c) Overlay of immobility immediately before (pre), during (stim), and after (post) each light pulse. (d) Movement velocities, normalized to dopamine intact controls, before (PreStim, b) and after stimulation (PostStim, b) (t(3) = −0.450, p = 0.683, paired t-test). Bars denote population averages; connected circles show data for individual mice. (e) Schematic of direct pathway stimulation with D1-ChR2. (f) Percentage of time spent in the immobile state before, during, and after stimulation (n = 4). (g) Overlay of immobility immediately before (pre), during (stim), and after (post) each light pulse. (h) Movement velocities, normalized to dopamine intact controls, before (PreStim, f) and after stimulation (PostStim, f) (t(3) = 4.441, p = 0.02, paired t-test). Bars denote population averages; connected circles show data for individual mice. (i) Schematic of GPe network recording during global stimulation. (j) Light-evoked responses of ten example GPe multiunits. (k) Average multiunit responses (n = 68 across 3 animals) over the course of a 30 sec optical stimulus, displayed as z-score (z = 1.65, p = 0.0495, one tailed z-test). Shaded area, sem. (l) Average firing rates (normalized to baseline) of units (n = 34 across 3 animals) held across all 10 stimulations. Each bin denotes firing in 30 sec bins immediately before and after each stimulation (blue). Error bars, sem.
Even though GPe neurons exhibited the expected decrease in firing rate (Naive: 44.3 ± 2.6 Hz, n = 73 neurons across 4 animals vs. bilateral DD: 24.6 ± 1.6 Hz, n = 62 neurons across 3 animals, p < 0.0001, Kruskal-Wallis H test) and increase in irregularity after dopamine depletion (CVNaive: 0.63 ± 0.03 vs CVDD: 0.80 ± 0.03; p < 0.0001, Kruskal-Wallis H test) (Fig. S1c–e), hSyn-ChR2 did not rescue movement (Fig. 1b–c), nor did it reduce bradykinesia (normalized to dopamine intact control: Pre: 0.27 ± 0.23 vs. Post10min: 0.29 ± 0.25, n = 4, p = 0.683, paired t-test) (Fig. 1d).
This inability to rescue movement with global GPe stimulation could challenge predictions of the classic basal ganglia model13, 14, but at least two other interpretations are possible. The first is that bilaterally DD mice are so impaired that they are no longer capable of robust movement. To address this possibility, we increased direct pathway activity by driving ChR2 expression in D1-spiny projection neurons (D1-ChR2) (Fig. 1e, S2d–e). Consistent with previous results15, D1-ChR2 relieved immobility in a predominantly light-locked manner (Fig. 1f–g). Some movement persisted after the 10th light pulse, but this effect was not significant (Pre: 82 ± 24% vs. Post10min: 63 ± 21%, n = 4, p = 0.15, paired t-test). When movement bouts did occur, velocities were significantly greater than before stimulation (normalized to dopamine intact controls: Pre: 0.25 ± 0.22 vs. Post10min: 0.91 ± 0.46, n = 4, p = 0.02, paired t-test) (Fig. 1h). These results demonstrate that bilaterally DD mice are still capable of robust movement, so this cannot account for the inability of global GPe stimulation to rescue movement.
A second possibility is that our optogenetic stimulation does not effectively drive firing of GPe neurons. To test this, we recorded the responses of GPe neurons in vivo during optical stimulation with hSyn-ChR2 (see methods, Fig. 1i). Due to the large numbers of neurons responding, single unit activity could not be well isolated during stimulation, so these data reflect multiunit activity. On average, all units (n = 68/68 units across 3 animals) significantly increased in firing rate (z-score100 ms = 17.6 ± 1.2; z = 1.65, p < 0.05, one-tailed z-test) and achieved peak activation within ~1 sec (range: 0.1–9.7 s) (Fig. 1j–k). In a subset of recordings, we verified that neural responses in the GPe were stable across each of the 10 repeated stimulations (n = 34 units across 3 animals) (Fig. 1l). These results confirm that hSyn-ChR2 was effective at increasing firing rates of GPe neurons, yet this did not rescue movement in DD mice.
Selective Activation of PV-GPe Neurons Restores Movement Persistently in DD Mice
The finding that movement can be rescued during D1-ChR2 stimulation, but not by global GPe stimulation, challenges the classic rate-based basal ganglia model and motivated a more in-depth analysis of GPe circuitry. The GPe contains a heterogeneous population of neurons11, 16. Since these populations have different anatomical and physiological properties, we reasoned that they might make different contributions to behavior. As such, cell-specific interventions might be more effective than global ones. To test this hypothesis, we first restricted ChR2 expression to PV-containing GPe neurons (Fig. 2a, S3a–b).
Figure 2. Selective stimulation of PV-GPe neurons rescues movement persistently in DD mice.

(a) Schematic of optogenetic stimulation of PV-ChR2. (b) Percentage of time spent in the immobile state before, during, and after stimulation (PV-ChR2: n = 10, PV-EYFP: n = 8). (c) Overlay of immobility immediately before (pre), during (stim), and after (post) each light pulse. (d) Movement velocities, normalized by dopamine intact controls, before (PreStim, b) and after stimulation (PostStim, b) (t(9) = 6.757, p = 0.00008, paired t-test). Bars denote population averages; connected circles show data for individual mice. (e) Duration of prokinetic effects of PV-ChR2 (n = 10) and D1-ChR2 (n = 4) stimulation (Main EffectTime: F[6, 54] = 7.672, p < 0.0001; Main EffectCondition: F[1, 9]= 10.04, p = 0.0114; Interaction EffectTime × Condition: F[6, 54] = 6.793, p < 0.0001, Two-way RM-ANOVA). (f) Percentage of animals rescued after D1-ChR2 or PV-ChR2 over the post stimulation period. Blue bar (Stim) represents full optogenetic manipulation. (g) Cumulative success rate over the 5 min trial for PV-ChR2 (n = 8/10) and PV-EYFP (n = 1/5) mice to approach food dish on opposing end of cage (χ2(1)= 5.000, p = 0.0253, chi-squared test) (h) Comparison of behavioral patterns expressed by PV-ChR2 mice (n = 10) during the PostStim period (b) compared to dopamine intact controls (n = 7). The average time engaged in each behavior is expressed as a percentage of total time. Only immobility (p = 0.003, Mann Whitney U) and rearing (p = 0.0001, Mann Whitney U) were significantly different between conditions. Error bars, sem.
Ten days to 2 weeks after viral injections, mice were bilaterally depleted and the prokinetic effects of PV-ChR2 stimulation were measured 3–5 days later. In contrast to global GPe stimulation, selective stimulation of PV-GPe neurons provided robust relief of immobility and bradykinesia (Fig. 2b–d, Video S1–2). In mice expressing a control fluorescent construct (DIO-EYFP), immobility was not reduced (Fig. 2b). Initial responses to PV-ChR2 were highly light-locked, but as stimulation progressed, continuous movement gradually accumulated between light pulses (Fig. 2b–c). By the 10th light pulse, PV-ChR2 had reduced immobility to the same degree as D1-ChR2 (10th Stim: PV-ChR2: 21 ± 20%, n = 10 vs. D1-ChR2: 17 ± 23%, n = 4, p = 0.995, Sidak’s post hoc test). While the effects of D1-ChR2 decayed shortly after stim, the effects of PV-ChR2 persisted significantly after the 10th stimulation (Pre: 81 ± 21% vs. Post10min: 28 ± 16%, n = 10, p < 0.0001, paired t-test). Movement velocities were also significantly increased (normalized to dopamine intact controls: Pre: 0.26 ± 0.10 vs. Post10min: 1.04 ± 0.67, n = 10, p < 0.0001, paired t-test) (Fig. 2d).
To test the duration of the prokinetic effects of PV-ChR2, a subset of mice were left in the open field for 3 hrs after stimulation (n = 7) (Fig. 2e–f); 4 out of 7 mice remained highly mobile for the duration of the test (Fig. 2f) and immobility (averaged across all mice, n = 7) was significantly reduced for the entire 3 hrs (Fig. 2e). When mice were returned to their home cage after stimulation, locomotioned ramped down within minutes. However, when mice were placed at one end of a 30 × 20 cm cage with food and water positioned at the other end, 8 out of 10 PV-ChR2 mice reached the food within 5 min (range: 0.08 – 3.9 min) whereas only 1 out of 5 PV-EYFP mice reached the food (latency = 0.58 min) (p = 0.03, Chi-squared test) (Fig. 2g). Combined, these results demonstrate that the prokinetic effects of PV-ChR2 stimulation are long lasting and persist for hours after stimulation.
To characterize the behavioral patterns expressed by PV-ChR2 mice, open field behaviors were manually scored during the 10 min post stimulation period. Overall, behavioral patterns were remarkably similar between PV-ChR2 mice and dopamine intact controls (Fig. 2h). Control (n = 7) and PV-ChR2 (n = 10) mice spent similar percentages of time walking (Control: 48 ± 6% vs. PV: 52 ± 25%; p = 0.6, Mann Whitney U), grooming (Control: 6 ± 4% vs. PV: 5 ± 4%; p = 0.734, Mann Whitney U) and performing fine movements (Control: 10 ± 4% vs. PV: 8 ± 7%; p = 0.270, Mann Whitney U). On average, walking bouts were longer in PV-ChR2 mice (6.8 ± 4.9 sec) compared to controls (3.1 ± 0.48 sec, p = 0.043, Mann Whitney U). Rearing was not rescued by stimulation (Control: 27 ± 9% vs. PV: 0.6 ± 1%; p = 0.0001, Mann Whitney U) and PV-ChR2 mice spent more time immobile compared to controls (Control: 9 ± 4% vs. PV: 33 ± 19%; p = 0.003, Mann Whitney U). Furthermore, PV-ChR2 mice retained a hunched posture and irregular gait (Video S2), suggesting that stimulation is more effective at alleviating bradykinesia/immobility than postural/gait symptoms.
Because the severity of motor symptoms induced by bilateral DD restricted our experimental time window to 3–5 days after depletion, we performed a number of control experiments to ensure that behavioral rescue was specific for symptoms related to dopamine loss, and not symptoms induced by other factors such as acute inflammation. First, to control for the effects of inflammation, dopamine-intact mice were injected with lipopolysaccharide (LPS), an inflammatory agent, in the MFB17. Five days after injections of LPS, mice exhibited no locomotor deficits in the open field and PV-ChR2 stimulation had no effects on immobility (Fig. S4a). Second, we observed that the persistent component of behavioral rescue could not be induced in mice with partial dopamine depletions (mice with >20% striatal TH left on either side) (Fig. S4b–f), suggesting the long-lasting prokinetic effects of PV-ChR2 are specific to the dopamine depleted state of the mouse and not other factors associated with our depletion protocol. Third, consistent with data from partially DD mice, PV-ChR2 stimulation in unilaterally DD mice (14 days post depletion) did not alter their behavior persistently (Fig. S4g–i). Combined, these results demonstrate that the long-lasting prokinetic effects of PV-ChR2 are specifically induced only under conditions of advanced dopamine loss.
Neuronal Responses In The GPe During PV-ChR2 Stimulation
Our behavioral results demonstrate that movement is restored when PV-GPe neurons are stimulated selectively, but not when they are stimulated with all other GPe neurons (hSyn-ChR2). To investigate how PV-ChR2 stimulation differs at the network level from hSyn-ChR2 stimulation, we recorded responses of neurons in vivo during PV-ChR2 stimulation (Fig. 3a). To identify putative PV-GPe neurons, neurons were first classified as ChR2+ or ChR2− on the basis of their short-latency responses to brief (5 ms) optical pulses (see methods, Fig. S5a). Characteristic firing patterns and waveform distributions of ChR2+ and ChR2− neurons are summarized in Fig. S5b–c. Because the average firing rate of our putative PV-GPe population (24 ± 4 Hz, n = 18 across 3 animals) was lower than what has been reported by other groups8, 18, we validated our optical identification strategy in dopamine intact mice (Fig. S5d). In dopamine intact control mice, the average firing rate of the PV-GPe population was 46 ± 2 Hz, consistent with results from previous studies (48 ± 3 Hz8, and 47 ± 6 Hz 18). These results suggest that the lower firing rates of putative PV-GPe neurons in our study are due to changes in population activity induced by dopamine loss, and not errors in neuronal classification.
Figure 3. Local response during PV-ChR2 stimulation directly inhibits other high-firing GPe neurons.

(a) Schematic of GPe network recording during PV-ChR2 stimulation. (b) Light-evoked responses of ten single units during onset of a 30 sec pulse. (c) Average z-score of excited (red, n = 18/39 across 3 animals) and inhibited (blue, n = 14/39) neurons during a 30 sec optical pulse. Shaded area, sem. (d) Firing rates of individual neurons before, during (time 0), and in 10 sec bins after a 30 sec light pulse (Excited: t(17) = −4.913, p < 0.0001, paired t-test, Inhibited: t(13) = 4.789, p < 0.0001, paired t-test). Population averages are shown as thick, colored lines. (e) Average firing rates of units held across all ten 30 sec pulses for excited (top, n = 5 across 3 animals) and inhibited units (bottom, n =4 across 2 animals). Each bin denotes firing in 30 sec bins immediately before and after each stimulation (colored bars). Error bars, sem. (f) Schematic of GPe network during Lhx6-Arch stimulation. (g) Light-evoked responses of ten single units during onset of a 30 sec pulse. (h) Average z-score of inhibited (blue, n = 27/42 across 3 animals) and no change (grey, n = 15/42) neurons during a 30 sec optical pulse. Shaded area, sem. (i) Firing rates of individual neurons before, during (time 0), and in 10 sec bins after a 30 sec light pulse (Inhibited: t(26) = 9.888, p < 0.0001, paired t-test, No change: t(14) = −1.126, p = 0.279, paired t-test). Population averages are shown as thick, colored lines. (j) Average firing rates of inhibited units held across all ten 30 sec pulses (n = 11 across 3 animals). Each bin denotes firing in 30 sec bins immediately before and after each stimulation (colored bars). Error bars, sem. (k) Summary of average firing rates before, during, and after 30 sec stimulations of PV-ChR2, and Lhx6-Arch. Error bars, sem.
In DD mice, 18 out of 18 ChR2+ neurons (putative PV-GPe) responded to 30 sec optical pulses with sustained increases in firing rates (Fig. 3b–c), averaging 24 ± 4 Hz before stimulation and 52 ± 8 Hz during stimulation (p < 0.0002, paired t-test) (Fig. 3d). A subset of recordings that were stable enough to track single units across a 10-pulse stimulation paradigm (n = 7 across 3 animals) revealed that responses were consistent across all 10 pulses (Fig. 3e). In contrast, most (14/21) ChR2− neurons were inhibited during optical pulses (Fig. 3b–c), averaging 30 ± 3 Hz before stimulation and 18 ± 2 Hz during stimulation (p < 0.0004, paired t-test) (Fig. 3d). Firing rates of the remaining (7/21) ChR2− neurons were not significantly modulated (data not shown). A subset of recordings that were stable enough to track inhibited units across a 10-pulse stimulation paradigm (n = 4 across 2 animals) revealed that inhibitory responses were consistent across all 10 pulses (Fig. 3e).
These data reveal a key difference between the effect of PV-ChR2 vs. hSyn-ChR2 on population dynamics within the GPe. PV-ChR2 produces a bidirectional response that transiently elevates the firing of PV-GPe neurons but suppresses the firing of other GPe neurons, a dissociation that is occluded during global stimulation with hSyn-ChR2. To test whether this dissociation is critical for the induction of behavioral rescue, we sought to mimic this effect by inhibiting a subset of neurons directly with archaerhodopsin (Arch). Because the firing rates and waveforms of ChR2− neurons were highly overlapping with those of ChR2+ neurons (Fig. S5b–c), we reasoned that both subtypes are part of the prototypical population8, 18. PV-GPe neurons constitute a major fraction of this population, but neurons expressing Lhx6 represent a second, partially non-overlapping fraction2, 7, 12 (Fig. S6a–b).
To measure the impact of inhibiting Lhx6-GPe neurons on population activity in the GPe, we performed in vivo recordings in Lhx6-Cre mice two weeks after viral-mediated expression of Flex-Arch (Fig. 3f). Neurons were classified as Arch+ or Arch− based on their response to 1 sec optical pulses of green light (see methods, Fig. S5e). Characteristic firing patterns and waveform distributions of Arch+ and Arch− neurons were highly overlapping and are summarized in Fig. S5f–g.
In response to 30 sec optical pulses, 27 out of 27 Arch+ neurons responded with sustained decreases in firing rates (Fig. 3g–h), averaging 29 ± 3 Hz before stimulation and 6 ± 2 Hz during stimulation (p = 2.68 × 10⁻¹⁰, paired t-test) (Fig. 3i). A subset of recordings that were stable enough to track single units across a 10-pulse stimulation paradigm (n = 11 across 3 animals) revealed that responses were consistent across all 10 pulses (Fig. 3j). The remaining 15 out of 15 neurons were Arch− and showed no net change in firing rate during optical stimulation (Fig. 3g–i). Although some neurons exhibited sharp firing rate increases at the onset of a light pulse, this effect was transient, and often did not persist for >100 ms (Fig. 3h). These results demonstrate that Lhx6-Arch, like PV-ChR2, transiently dissociates population activity in the GPe, but with different effects on absolute firing rate (Fig. 3k).
Selective Inhibition of Lhx6-GPe Neurons Restores Movement Persistently in DD Mice
To test whether the transient dissociation of GPe activity produced by Lhx6-Arch was also sufficient to induce behavioral rescue, we assessed its effects on immobility and bradykinesia of DD mice in the open field (Fig. 4a–d, S3c). Initially, mice were highly immobile (Pre: 86 ± 11%, n = 9), but over the course of 10 stimulations, Lhx6-Arch reduced immobility to a similar degree as PV-ChR2 (10th pulse: Lhx6-Arch: 28 ± 38%, n = 9 vs. PV-ChR2: 21 ± 20%, n = 10, p = 0.80, Tukey’s post hoc test) (Fig. 4b,f, Video S3). Immobility was not reduced in mice expressing a control fluorescent construct (DIO-EYFP) (Fig. 4b), nor was it induced by globally inhibiting all GPe neurons with CAG-Arch (Fig. 4h–j, S3d).
Figure 4. Selective suppression of Lhx6-GPe neurons rescues movement persistently in DD mice.
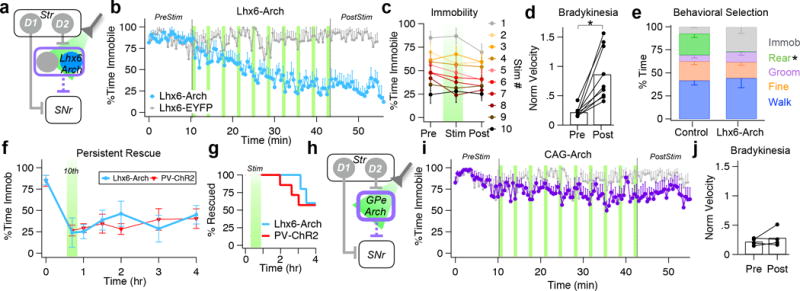
(a) Schematic of optogenetic inhibition of Lhx6-GPe neurons. (b) Percentage of time spent in the immobile state before, during, and after Lhx6-Arch (n = 9) and Lhx6-EYFP (n = 7). (c) Overlay of immobility immediately before (pre), during (stim), and after (post) each light pulse (d) Movement velocities, normalized by dopamine intact controls, before (PreStim, b) and after stimulation (PostStim, b) (p = 0.002, paired t-test). Bars denote population averages; connected circles show data for individual mice. (e) Comparison of behavioral patterns expressed by Lhx6-Arch (n = 7) mice during the PostStim period (b) compared to dopamine intact controls (n = 6). The average time engaged in each behavior is expressed as a percentage of total time. Only immobility rearing (p = 0.001, Mann Whitney U) was significantly different between conditions. (f) Duration of prokinetic effects of Lhx6-Arch (n = 5) and PV-ChR2 (n = 7) plotted for reference (Main EffectTime: F[7, 70] = 7.994, p < 0.0001; Main EffectCondition: F[1, 10]= 0.5855, p = 0.462; Interaction EffectTime × Condition: F[7, 70] = 1.358, p = 0.2367, Two-way RM-ANOVA).(g) Percentage of animals rescued after Lhx6-Arch or PV-ChR2 over the post stimulation period. Green bar (Stim) represents full optogenetic manipulation.(h) Schematic of optogenetic inhibition of all GPe neurons. (i) Percentage of time spent in the immobile state before, during, and after CAG-Arch (n = 4) and Lhx6-EYFP (n = 7). (j) Movement velocities, normalized by dopamine intact controls, before (PreStim, g) and after stimulation (PostStim, g) (p = 0.393, paired t-test). Bars denote population averages; connected circles show data for individual mice. Error bars, sem.
Intriguingly, Lhx6-Arch induced the gradual, persistent component of behavioral recovery but not the early, light-locked component present in PV-ChR2 mice. Bradykinesia was also greatly reduced (Pre: 0.22 ± 0.08 vs. Post10min: 0.85 ± 0.45, n = 9, p = 0.002, paired t-test) (Fig. 4d). Ten minutes after the last stimulation, Lhx6-Arch mice remained highly mobile, spending only 34 ± 21% (vs. Pre: 86 ± 11%, n = 9, p = 0.012, Tukey’s post hoc test) of their time in the immobile state. Similar to the long-lasting effects of PV-ChR2, immobility in Lhx6-Arch mice remained significantly reduced for hours after stimulation (Post3hr: Lhx6-Arch: 45 ± 11%, n = 5 vs. PV-ChR2: 41 ± 36%, n = 7, p =0.990,Tukey’s post hoc test) (Fig. 4f–g) and 3 out of 5 Lhx6-Arch mice remained highly mobile for the duration of the test (Fig. 4g).
Behavioral patterns in Lhx6-Arch mice were similar to those of dopamine intact controls (Fig. 4e). Control (n = 6) and Lhx6-Arch mice (n = 7) spent similar percentages of time walking (Control: 42 ± 12% vs. Lhx6: 44 ± 28%; p = 0.886, Mann Whitney U), grooming (Control: 6.9 ± 7.7% vs. Lhx6: 11.2 ± 9.2%, p = 0.568, Mann Whitney U) and performing fine movements (Control: 21 ± 9% vs. Lhx6: 18 ± 9%, p = 0.445, Mann Whitney U), but rearing behavior was not recovered (Control: 23 ± 10% vs. Lhx6: 0.3 ± 0.3%, p = 0.001, Mann Whitney U). Lhx6-Arch mice spent a wide range (7–50%) of time in the immobile state (Control: 7.6 ± 2.0% vs. Lhx6: 26.5 ± 18.3%, p = 0.101, Mann Whitney U). Walking bouts in Lhx6-Arch mice were significantly longer compared to control (Control: 2.7 ± 0.8 ms vs. Lhx6: 5.6 ± 2.4 ms, p = 0.02, Mann Whitney U) and they walked with a hunched posture and shuffling gait (Video S4). Combined, our behavioral results suggest that transiently dissociating the activity of GPe neurons with Lhx6-Arch induces a gradual, long-lasting recovery of movement that is qualitatively and quantitatively similar to that induced by PV-ChR2.
Persistent Behavioral Rescue Depends on the Ratio of Lhx6 and PV Activity
Thus far, our results have shown that movement can be persistently rescued by manipulations that dissociate the activity of PV-GPe neurons above that of Lhx6-GPe neurons. But because these subpopulations are partially overlapping at the molecular level (Fig. S6a–b), we wanted to determine whether their effects were truly segregated at the behavioral level. To test this, we assessed the prokinetic effects of inverse manipulations: Lhx6-ChR2 and PV-Arch. In mice stimulated with Lhx6-ChR2 (Fig. 5a, S3e), some relief from immobility was observed in 3 out of 5 mice during the stimulation period (Pre: 91 ± 13% vs. 10th Stim: 47 ± 46 %, n = 5, p = 0.067, Tukey’s post hoc test), but this effect did not persist beyond 30 min. after stimulation (Pre: 91 ± 13% vs. Post30 min: 72 ± 37%, n = 5, p = 0.684, Tukey’s post hoc test) (Fig. 5b–c).
Figure 5. The induction of persistent behavioral rescue is cell-type specific.

(a) Schematic of optogenetic stimulation of Lhx6-GPe neurons. (b) Percentage of time spent in the immobile state before, during, and after Lhx6-ChR2 stimulation (n = 5). (c) Duration of prokinetic effects in Lhx6-ChR2 mice. Data from PV-ChR2 (n = 10) and D1-ChR2 (n = 4) is re-plotted for reference (Main EffectTime: F[6, 78] = 10.25, p < 0.0001; Main EffectCondition: F[2, 13]= 7.177, p = 0.0079; Interaction EffectTime × Condition: F[12, 78] = 3.947, p < 0.0001, Two-way RM-ANOVA).. (d) Schematic of optogenetic suppression of PV-GPe neurons. (e) Percentage of time spent in the immobile state before, during, and after PV-Arch stimulation (n = 4). (f) Schematic of GPe manipulations that globally alter GPe physiology and those that shift the relative balance of PV and Lhx6 neurons to successfully induce behavioral rescue (PV-ChR2, Lhx6-Arch). Error bars, sem.
In mice stimulated with PV-Arch (Fig. 5d, S3f), optogenetic suppression of PV-GPe neurons did not rescue movement (Fig. 5e). Immobility in PV-Arch mice was 94 ± 4% before the first stimulation and 92 ± 8% during the 10th stimulation (n = 5, p = 0.448, paired t-test) and no persistent effects were observed (Fig. 5e). Taken together, these results confirm that the induction of long-lasting behavioral recovery is cell-type specific, and is induced by interventions that dissociate the firing rates of PV-GPe neurons above that of Lhx6-GPe neurons (Fig. 5f).
PV-ChR2 and Lhx6-Arch Reverse Pathological Burst Firing in SNr
How do transient imbalances between the firing rates of two subpopulations of GPe neurons produce a long-lasting effect on movement? To study the impact of GPe interventions on the basal ganglia circuit, we recorded neural activity in the substantia nigra reticulata (SNr), the major basal ganglia output nucleus in rodents.
A pathological hallmark of SNr dysfunction following dopamine depletion is an increase in burst firing and the percentage of bursting neurons19–21. Consistent with these findings, we observed a rightward shift in the proportion of bursting neurons in DD mice compared to dopamine intact controls (p = 0.005, K-S two sample test) (Fig. 6a–b). To test if optogenetic stimuli that rescue movement reduce the proportion of bursting neurons, we recorded from the SNr before, during, and after stimulation (Fig. 6c–d). PV-ChR2 induced a leftward shift in the distribution of bursting neurons in the SNr (p = 0.005, K-S two sample test) (Fig. 6e). This effect was most pronounced for ‘highly bursty’ units, as identified by burst frequencies that exceeded 1 median absolute devation (MAD) above the median (Fig. 6f). The fraction of highly bursting neurons was reduced from 27% pre stimulation to 10% post stimulation (Pre: n = 22/81 vs. Post: n = 6/58 across 3 animals, p = 0.044, chi-squared test) (Fig. 6g). In contrast, hSyn-ChR2 did not shift the distribution of bursting neurons (p = 0.188, K-S two sample test) (Fig. 6h); 31% of units were classified as highly bursty pre stimulation compared to 20% post stimulation (Pre: n = 17/55 vs. Post: n = 14/69 across 3 animals, p = 0.295, chi-squared test) (Fig. 6i–j). In recordings stable enough to track the activity of single units across all 10 light pulses, a reduction in the number of bursts was apparent at the level of individual neurons recorded in PV-ChR2 mice (Fig. 6k), but not in hSyn-ChR2 mice (Fig. 6l). Intriguingly, bursts diminished gradually over the first 2–4 stimuli, mirroring the kinetics of behavioral rescue in the open field.
Figure 6. PV-ChR2 and Lhx6-Arch reverse pathological bursting activity persistently.

(a) Cumulative distribution plots of burst firing in the SNr of naive (black) and bilaterally depleted mice (Acute, dotted) (b) Representative raster of single unit activity in Naive and Acute conditions (c) Schematic of simultaneous GPe stimulation (bilateral, not depicted) and SNr recording (d) Representative single unit activity before (pre), between stimulations (inter-stim) and after (post) stimulation of the PV-GPe neurons (e) Distribution of burst firing before (pre) and after (post) PV-ChR2 stimulation. Acute distribution (dotted) replotted for reference. (f) Histogram of burst firing before (pre, top) and after (post, bottom) PV-ChR2 stimulation (g) Fraction of ‘Bursty’ units before and after PV-ChR2 stimulation (h) Distribution of burst firing before (pre) and after (post) hSyn-ChR2 stimulation (i) Histogram of burst firing before (pre, top) and after (post, bottom) hSyn-ChR2 stimulation (j) Fraction of ‘Bursty’ units before and after hSyn-ChR2 stimulation (k–l) Single unit activity before, during and after PV-ChR2 (n = 7 across 3 animals) or hSyn-ChR2 (n = 3 across 2 animals). Error bars, sem. (m) Distribution of burst firing before (pre) and after (post) Lhx6-Arch inhibition (n) Histogram of burst firing before (pre, top) and after (post, bottom) Lhx6-Arch inhibition (o) Fraction of ‘Bursty’ units before and after Lhx6-Arch inhibition. (p) Fraction of ‘Bursty’ units over the course of the three hour post-stimulation period across 3 animals per condition. Error bars, sem.
To test whether Lhx6-Arch works through a similar mechanism, we repeated experiments in Lhx6-Arch mice. Consistent with the effects of PV-ChR2, Lhx6-Arch produced a leftward shift in the distribution of bursting neurons in the SNr (p = 0.005, K-S two sample test) (Fig. 6m) and the fraction of highly bursting neurons was reduced from 31% pre stimulation to 3% post stimulation (Pre: n = 9/29 vs. Post: n = 2/69 across 3 animals, p = 0.0006, chi-squared test) (Fig. 6n–o).
To determine how long burst attenuation persisted after stimulation, we separated the population activity into one hour time bins and calculated the fraction of bursty neurons over time. Consistent with the persistent effects on behavior, the fraction of bursty neurons across the population remained persistently reduced for hours after stimulation (Pre vs. Post2hr: PV-ChR2: p = 0.007, Lhx6-Arch: p = 0.003, Dunnett’s multiple comparsions test), and only begins to drift back to pre-stimulation levels by ~3 hrs after stimulation (Pre vs. Post3hr: PV-ChR2: p = 0.105, Lhx6-Arch: p = 0.001, Dunnett’s multiple comparsions test) (Fig. 6p). These data suggest a mechanism through which PV-ChR2 and Lhx6-Arch persistently rescue movement through a long-lasting normalization of basal ganglia output pattern. We also considered effects of stimulation on SNr firing rates, and although burst firing decreased, there was no change in the firing rate before and after PV-ChR2 and Lhx6-Arch (Fig. S7). In contrast, hSyn-ChR2 induced a pronounced decrease in the firing rate but no change to the overall proportion of highly bursty neurons (Pre vs. Post1–3hr: p > 0.1, Dunnett’s multiple comparsions test).
Taken together, these results suggest that transient cell-specific interventions in the GPe induce long-lasting reductions in the pathological activity of basal ganglia output neurons in the SNr that persist for hours beyond stimulation.
Discussion
Here, we demonstrate that cell-specific interventions in the GPe induce robust, long-lasting recovery of motor function in DD mice. Manipulations that transiently elevate the firing of PV-GPe neurons above that of Lhx6-Arch neurons reverse pathological burst firing in the SNr and ameliorate symptoms of immobility and bradykinesia for hours beyond stimulation. These results establish the behavioral significance of cell-type heterogeneity in the GPe, with potential implications for the treatment of PD.
Nearly thirty years ago, the discovery that striatal neurons can be molecularly divided into D1 and D2-subpopulations provided a cellular basis for the direct/indirect pathway model of the basal ganglia that has long dominated our conceptual framework22. However, with the exception of neuronal diversity in the striatum, the classic direct/indirect pathway model treats all other downstream nuclei as relay structures, an oversimplification whose limits have become increasingly apparent as techniques to study circuit function become more sophisticated. The GPe contains different cell populations11, 16, but this knowledge has been slow to translate into therapeutic strategies. Here, leveraging tools to optogenetically target subpopulations of GPe neurons, we can induce long-term recovery of motor function in DD mice.
Strategies that persistently restored movement shared a common mechanism of elevating the firing rates of PV-GPe neurons relative to that of Lhx6-GPe neurons (PV-ChR2, Lhx6-Arch). Interventions that activated or suppressed all GPe neurons were not effective (hSyn-ChR2, CAG-Arch), nor were interventions that elevated the firing rates of Lhx6-GPe neurons relative to PV-GPe neurons (Lhx6-ChR2, PV-Arch). Thus, despite some overlap between the Lhx6 and PV subpopulations at the molecular level7–9, 11, 12, the behavioral effects produced by manipulating these populations are well segregated.
The GPe’s impact on movement is thought to be mediated by its influence over basal ganglia output nuclei, predominantly the SNr in rodents13, 14, 23. Under dopamine depleted conditions, neurons in the basal ganglia become more rhythmic and bursty, impairing basal ganglia output4, 21. Attenuation of pathological activity is well correlated with the therapeutic effects of DBS on bradykinesia and rigidity24–27. The dissociation of pallidal subpopulations –elevating the activity of PV-GPe above Lhx6-GPe neurons – and the subsequent removal of pathological activity in the SNr, may be a possible mechanism for DBS. Although acute toxin models do not replicate all the features of a complex human disorder such as PD, they provide key insights into the function of neural circuits under conditions of low dopamine. The cardinal motor symptoms of PD such as immobility and bradykinesia do not arise until dopamine levels have decreased by ~70%, highlighting the need to discover strategies to restore motor function, even at advanced stages of dopamine loss28–32.
It has long been assumed that the prokinetic effects of DBS are limited to the stimulation period, with symptoms (and pathological activity) rapidly returning within minutes after stimulation. However, a modified DBS protocol, called coordinated reset (CR-DBS), has been shown to provide some prokinetic benefits that persist for hours, or even days, after stimulation in both MPTP primate models19, 33 and human PD patients34. The ability to distablize the network by shifting the balance of neuronal subpopulations may be sufficient to rescue motor function.
Although we do not know whether GPe stimulation engages similar mechanisms, the GPe is a central node for the amplification and propagation of pathological network oscillations in PD3, 4, 6, 27, 35, 36. Our data identify PV and Lhx6-GPe neurons as critical nodes within the basal ganglia circuit for the induction of long-lasting attenuation of pathological activity in the SNr. The convergent effects of PV and Lhx6-GPe neurons on the SNr could be mediated via their direct projections to the nucleus, or via their indirect projections by way of the STN, a nucleus which is differentially innervated by Lhx6 vs. PV subpopulations2. Elucidating the circuit and synaptic mechanisms that give rise to pathological rhythmicity in disease, and discovering interventions to best counteract this rhythmicity, is an important area of research in the field.
Conclusion
In conclusion, our results demonstrate that cell-specific, but not global interventions in the GPe induce long-lasting behavioral rescue and physiological restoration of basal ganglia output in DD mice. These results establish important functional distinctions between subpopulations of GPe neurons, delineated in part by their expression of Lhx6 and PV. These results reconcile a number of conflicting reports in the literature: that successful DBS can either increase or decrease firing rates of GPe neurons37–40, that DBS directly in the GPe can reduce bradykinesia27, 41 but restoring autonomous firing after DD has no effect42. Finally, because the proportion of PV-GPe neurons in humans is similar to that in mice43, our results suggest that interventions that preferentially increase their activity relative to other GPe neurons might provide more persistent prokinetic benefits than current treatments.
Methods
Animals
Experimental procedures were approved by the Carnegie Mellon University Committee for the Use and Care of Animals and in accordance to the guidelines set forth by the National Institute of Health and Society for Neuroscience Use of Animals in Neuroscience Research. Male and female heterozygous 8–15 week-old mice on a C57BL/6J background were used for all experiments. D1-SPNs were targeted using the D1-cre mouse line44. PV-GPe neurons were targeted using a Pvalb-2A-Cre mouse line45. Lhx6-GPe neurons were targeted using Lhx6-iCre mouse line46. To ensure health of the animals undergoing the dopamine depletion, weights were closely monitored and every animal weighed greater than 20 g prior to initial surgery. Animals were group housed (2–8 per group) in a 12hr–12hr light dark cycle until the time of second surgery (as noted below) and all experiments were completed during the light cycle.
Viral Transfection
Injections of purified double-floxed AAV2-DIO-EYFP (controls), AAV2-DIO-ChR2-EYFP (cell-specific activation), AAV2-DIO-ArChT-tdTomato (cell-specific inhibition), AAV2-hsyn-hChR2(H132R)-tdTomato (non-specific activation) or AAV2-CAG-ArchT-tdTomato (non-specific inhibition) produced at the University of North Carolina (Vector Core Facility) were made in 8–12 week-old D1-cre, PV-Cre or Lhx6-iCre transgenic mice. Littermates were randomly assigned to either the rhodopsin-positive or control groups. Injections into the dorsomedial striatum47 or GPe48 were completed in accordance to methods previously described. Briefly, anesthesia was induced using 0.2 μL ketamine/xylazine (0.2cc/5 mg/ml) and maintained throughout surgery using 1.5% isofluorane. Mice were placed in a stereotaxic frame (Kopf Instruments) where the scalp was opened and bilateral holes were drilled in the skull (Striatum: 0.5mm anterior, 1.5mm lateral, GPe: 0.27–0.30 mm anterior, 2.1–2.2 mm lateral from bregma). 200–250 nL of virus was injected with a Nanoject (Drummond Scientific) through a pulled glass pipet (tip diameter ~30 μm) whose tip was positioned below the top of the skull (Striatum: 2.80 mm, GPe: 3.65 mm). To prevent backflow of virus, the pipet was left in the brain for 5 min after completion of the injection. All experiments were performed at least 2 weeks following injection to allow time for full viral expression. At which point, mice underwent a second surgery for either behavioral opotogenetics or physiology, where experimenters were blind to the experimental condition. Sample sizes for each experiment are in line with previous published studies47,51.
Optogenetic Behavioral Implantation and Dopamine Depletion
For behavioral optogenetic experiments in freely moving mice, a second surgery was performed at least 10 days after viral injections to deplete dopamine and insert optical fibers. For the second surgery, mice were anesthetized, placed on the stereotaxic frame and holes were re-drilled from the previous viral injection. In addition, bilateral holes were drilled over the medial forebrain bundle (−0.45 mm posterior, +/−1.15 mm lateral from bregma) for 6-OHDA injections. A 33-gauge cannula (Plastics One, Roanoke, VA, USA) attached to a syringe pump, was slowly lowered down into place (MFB: 4.95mm from top of the skull) and allowed to settle for five minutes. At this point, 1 μL of 6-OHDA (5 μg/μL in 0.9% NaCl), saline (0.9% NaCl) for unilateral depletions or lipopolysachairide (LPS, Sigma-Aldrich) for inflammatory induction was slowly injected into the MFB at a rate of 0.1 μL/min. The injection cannula was left in place for five additional minutes.
After the bilateral injections, a custom-made plastic button containing 2 polished ferrules was placed over the holes previously used for viral injections. The fibers were slowly advanced to the top of the viral expression (Striatum: 2.60 mm, GPe: 3.45 mm). Dental cement was used to secure the button to the top of the skull. After all dopamine depletions, mice were individually housed and placed into a recovery station. The station consisted of a new cage, soft food, trail mix, shallow water dish and half of the cage was placed on a heating pad. In addition, a daily injection of saline (0.9% NaCl; intraperitoneally) was used to curb dehydration, and weight was closely monitored to ensure the greatest level of health for each animal.
Behavioral Paradigm
Three to five days following fiber implantation, mice were connected to bilateral fibers and subsequently placed in the center of a 1600 cm2 square open field. Fibers were adjusted to ensure 1 mW of power at the tip of the previously implanted ferrule. Activity was monitored from overhead and the side of the arena and the center-point was tracked utilizing Noldus Ethovision software. After collecting 10 minutes of ‘baseline’ activity, the LED delivered a 30 second pulse of light that was repeated 10 times and separated by 3 minute intervals. Following the final stimulation bout, 10 minutes of ‘post-stim’ activity was collecting. In a subset of conditions, mice were observed for an additional three hours to capture the persistence of behavioral intervention.
For the food-retrieval task, mice were placed in a new cage (30 × 20 cm) following the completion of the behavioral paradigm. Mice were placed in the opposing corner of the cage from two small dishes of food and water. Mice were tracked overhead using Noldus Ethovision. Successful trials were when mice reached the food or water dishes within 5 min.
Implantation of head-fixation system
A subset of virally injected mice were utilized for head-fixed in vivo physiology. Two weeks following viral expression, mice followed the same dopamine depletion protocol described above. After the bilateral injection of 6-OHDA, bilateral craniotomies were created over the GPe (−0.45–0.45 mm anterior, 1.75–2.35 mm lateral to bregma) or SNr (−2.75–3.25 mm anterior, 1.15–2.00 mm lateral to bregma). For SNr recordings, holes were drilled over the site of viral injections into the GPe and fibers (transmittanceoutput = 1 mW measured at the end of the fiber) were implanted for direct optical stimulation during recordings. After which, all animals were implanted with a copper headpost fixed to the posterior portion of the skull (approximately −3.5 mm posterior to bregma) utilizing a combination of glue and dental cement. The dental cement fixation was extended to surround the entirety of both craniotomies. The subsequent well that was formed was filled with a silicon elastomer (Kwik-sil, WPI) that prevented infection and damage to the brain tissue. During recording, this well was filled with saline and used as a ground reference.
Head fixation training and recording
Mice were placed atop a running wheel and allowed to run freely for 60 minutes the day before recording. Movement was tracked for the full period of recordings using an inverted optical mouse and custom MATLAB script. Craniotomies were cleaned, prepared for recordings the following day and silicone elastomer was replaced.
GPe Recordings
On the day of recording, mice were fixed to the top of the wheel and allowed 15 minutes to acclimate to the head fixed position. After removal of the silicon elastomer and clearing of the craniotomy, a linear 16-channel silicone optrode with sites spaced 50 μm apart (Neuronexus) and a 100 μm fiber terminating 50 μm above the uppermost site was attached to the micromanipulator and centered on bregma. Transmittance through the optical fiber was measured prior to recording to ensure ~0.5 mW in both the blue and green light conditions. The probe was slowly advanced (5–7 μm/sec) until the top of the GPe (~3.20 mm from top of the skull) was found. GPe activity was distinguished based on a combination of physiological features: presence of high-firing neurons, presence of low firing, irregular neurons, lack of spindle-like activity (thalamic) and responsiveness to light activation or inhibition. Post-mortem tissue analysis for viral hit and craniotomy placements were further evidence for proper targeting.
The probe was left in place for approximately 15 min before neuronal activity was measured. During this time, a drop of saline was placed in the well that surrounds the craniotomy and a reference ground electrode was placed in contact with the saline. Extracellular recordings and local field potentials were acquired using the omniplex system (Plexon Inc) and stored for offline analysis.
Optical Tagging Method
In the cell-type manipulations, single units could be isolated and an optical tagging strategy was employed to distinguish a neuron’s activity as positive or negative for rhodopsin expression. For ChR2 conditions, brief pulses (pulse width = 5 ms, 10 Hz, 120 pulses) were administered at the start and end of each recording session before advancing the probe to the next location. For Arch conditions, a set of longer pulses (pulse width = 1 sec, 0.5 Hz, 10–20 pulses) was administered to clearly denote neurons that were directly inhibited by the light. After the optical tag, activity of the neurons was measured in response to a thirty second period of light. In a subset of neurons, stability of recording was great enough to allow for the application of the full optogenetic paradigm (pulse width = 30 sec, interpulse interval = 3 min, 10 pulses). After the recording period, mice were sacrificed and tissue was utilized to verify placement of the craniotomy and documentation of probe entrance and placement.
For analysis, we utilized the previously published identification tool to classify neurons based on responsiveness to brief pulses (5 ms)49. Briefly, baseline activity (−110 to −10 ms) for each pulse was compared to the number of significant bins within 0–10 ms of light onset. As seen in Fig. S5a, the first significant bin (yellow) denotes the latency to spike due to direct ChR2-activation. For the Arch tagging, peri-event histograms (bin size = 10 – 50 ms) were produced centered on the start of each of the 10–20 pulses and a student’s t test (p < 0.005) was performed to compare the baseline firing rate (−510 ms to −10 ms from light onset) to the firing rate during light onset (0 ms to 200 ms). 30 sec Pulse Analysis: Neurons were binned based on the average firing rate changes during stimulation compared to 20 seconds prior to stimulation.
SNr Recordings
Following the acclimation protocol described earlier, mice were fixed atop the wheel and the appropriate light source was attached to the optical fibers (transmittance = 1 mW, tested prior to implantation). After removal of the silicon elastomer and clearing of the craniotomy, a linear 16-channel silicone probe with sites spaced 50 μm apart (Neuronexus) was centered on lambda. The probe was slowly advanced (5–7 um/sec) until the top of the SNr (~4.75 mm from top of the skull) was found. SNr activity was distinguished based on a combination of physiological features: presence of putative dopamine neurons, presence of putative GABAergic neurons, lack of spindle-like activity (thalamic) and responsiveness to light activation or inhibition. Post-mortem tissue analysis for viral hit and craniotomy placements were further evidence for proper targeting.
During the pre- and post-stimulation period, the probe was advanced to record a new set of neurons every 30–40 mins. Due to the scale of our craniotomy, when the probe was advanced to the bottom of the SNr (~5.00 mm), the probe was taken out of the brain and reinserted. This allowed for sampling across the SNr. During the full optical stimulation, the probe was left at the same recording site for the full duration, including an additional 10 minutes before and after stimulation. In a subset of the recordings, the signal to noise ratio and the subsequent population clusters were sufficiently isolated to track a set of neurons throughout the recording.
Tissue Processing
Shortly after the behavioral or electrophysiology experiments, mice were sacrificed and perfused transcardially with phosphate buffered saline (PBS), followed by 4% paraformaldehyde (PFA) in PBS. Brains were retrieved, fixed in 4% PFA for 24 hr before being placed in a 30% sucrose solution. Brains were sliced at 30 μm thickness and prepared for the appropriate incubations, as described previously50. Primary antibody included rabbit anti-GFP (1:1000, Millipore 06-896), Mouse anti-HuC/D (1:200, Molecular Probes A21271), mouse anti-NeuN (1:100, Millipore MAB377), rabbit anti-TH (1:1000, Pel-Freez P40101-0), at room temperature for 24 hours or at 4°C for 48 h when using rabbit anti-PV (1:1000, Swant PV 27). Secondary antibodies included Alexa Fluor 488-conjugated goat anti-chicken (1:500, Life Technologies), Alexa Fluor 488-conjugated goat anti-rabbit (1:500, Life Technologies), Alexa Fluor 568-conjugated donkey anti- rabbit (1:500, Life Technologies), Alexa Fluor 568-conjugated donkey anti-mouse (1:500, Life Technologies), Alexa Fluor 647-conjugated donkey anti-rabbit (1:500, Life Technologies), or Alexa Fluor 647-conjugated donkey anti-mouse (1:500, Life Technologies).
TH Quantification
Quantification of tyrosine hydroxylase staining was used as a measure of dopamine lesion on both hemispheres. As described previously50, slices containing the dorsal striatum were imaged using an epifluorescent scope at 10x magnification. To analyze the fluorescent intensity, the pixel intensity-measuring tool in ImageJ was used. A 100 × 100 μm square from each hemisphere was measured and normalized to the pixel intensities of a healthy control tissue that was processed and imaged in parallel. Unless noted, all mice had <20% TH remaining on both sides for all behavioral and physiology experiments to limit behavioral variability.
Behavioral Analysis
Videos collected during the behavioral paradigm were analyzed using the Noldus Ethovision. Immobility was quantified as the period of time where there was less than 1.2% change in pixels corresponding to the body segment. Center point detection was utilized to calculate movement velocities during movement bouts (velocity > 1 cm/s for at least 1 sec). For quantification of behavioral patterns, the behavior of a subset of randomly selected animals in the dopamine intact control, PV-ChR2, and Lhx6-Arch conditions was manually scored using Observer software to denote start and stop times that mice engaged in walking, rearing, grooming, and fine movements (scratching, sniffing, looking around). Periods of time not engaged in any of these movements were classified as ‘immobile’ in behavioral pattern analyses.
Electrophysiology Analysis
Data was filtered at 150–8000 Hz for spiking activity and 0.7–300 Hz for local field potentials. Spike detection was completed using the Plexon offline sorter where principal component analysis was used to delineate single and multi-units. To be classified as a single unit, the following criteria was utilized: (a) PCA clusters were significantly different (p <0.001); (b) J3-statistic was greater than 1; (c) percent of ISI violations (< 2ms) was less than 0.15%; (d) Davies-Bouldin test statistic was less than 0.5; (e) manual verification that optical stimulation did not occlude the ability to delineate single units from noise.
Following spike sorting, data was processed in Neuroexplorer and with custom scripts in MATLAB. Rest Period Analysis: Periods of rest were analyzed to identify the firing rates (FR) and coefficient of variation of the interspike intervals (CVISI) in the naive vs dopamine depleted state (Fig. S1c–e). Burst Analysis: Utilizing the surprise algorithm (surprise = 2), bursts were identified in the single unit SNr activity (FR > 5 Hz) and calculated across a two minute period, referred to as number of bursts (Fig. 6). For Fig. 6k–l, the number of bursts were calculated for thirty second time bins. Each unit was then normalized to baseline (Pre) and then averaged across all stably recorded units. Fractional Analysis: The fraction of highly ‘bursty’ neurons were identified by calculating the number of units that exceeded 1 MAD of the median in the distrubtion across all conditions, prior to optogenetic manipulation (Bursty threshold: 70).
Statistics and Data Availablity
Statistical analysis were completed using SPSS software or GraphPad Prism 7 (GraphPad Software). All data was tested for normality and equal variance. Behavioral data were analyzed using two-sided, paired or unpaired Student’s t-tests for normally distributed data. In all other cases, a Mann Whitney U or a Chi-squared test was applied. For the analysis of behavioral persistence, behavioral conditions were tested using two-way repeated measures (RM) ANOVA and reported in the appropriate figure legend. As noted in the main text, comparisons made within or across conditions utilizied Tukey’s or Sidak post hoc test, respectively. Results are reported as mean ± S.D.
Physiology data was first tested for normality and equal variance. Then, the appropriate parametric (two sided, paired or unpaired Student’s t-test) or non-parametric (Mann Whitney U or Kruskal-Wallis H test) tests were applied. Cumulative distrubtions were compared using the Kolmogorov-Smirnov two sample test (K-S two sample test). Fractional burst analysis applied a chi-sqaured statistic to measure if there was a change in the population burst firing before and after optogenetic intervention. Physiology results were reported as mean ± SEM. The data that support the findings of this study are available from the corresponding author upon reasonable request.
Supplementary Material
Acknowledgments
The authors thank V. Corbit and T. Whalen for Matlab analysis scripts and B. Rogowski for surgical support and behavioral video editing. We also thank N. Kessaris and H. Zeng for their gifts of the Lhx6-iCre and Pvalb-2A-Cre mice, respectively. This work was supported by NIH grants F31 NS090745-01 (K.M.), F31 NS093944-01 (A.W.), R00 NS076524, NSF grant DMS 1516288, and grants from the Brain and Behavior Research Foundation (National Alliance for Research on Schizophrenia and Depression Young Investigator Grant), the Parkinson’s Disease Foundation, and the NIH Intramural Research Program.
References
- 1.Saunders A, et al. A direct GABAergic output from the basal ganglia to frontal cortex. Nature. 2015;521:85–89. doi: 10.1038/nature14179. [DOI] [PMC free article] [PubMed] [Google Scholar]
- 2.Mastro KJ, Bouchard RS, Holt HA, Gittis AH. Transgenic mouse lines subdivide external segment of the globus pallidus (GPe) neurons and reveal distinct GPe output pathways. The Journal of neuroscience. 2014;34:2087–2099. doi: 10.1523/JNEUROSCI.4646-13.2014. [DOI] [PMC free article] [PubMed] [Google Scholar]
- 3.Kita H. Globus pallidus external segment. Progress in brain research. 2007;160:111–133. doi: 10.1016/S0079-6123(06)60007-1. [DOI] [PubMed] [Google Scholar]
- 4.Bevan MD, Magill PJ, Terman D, Bolam JP, Wilson CJ. Move to the rhythm: oscillations in the subthalamic nucleus-external globus pallidus network. Trends Neurosci. 2002;25:525–531. doi: 10.1016/s0166-2236(02)02235-x. [DOI] [PubMed] [Google Scholar]
- 5.Mallet N, et al. Parkinsonian beta oscillations in the external globus pallidus and their relationship with subthalamic nucleus activity. The Journal of neuroscience. 2008;28:14245–14258. doi: 10.1523/JNEUROSCI.4199-08.2008. [DOI] [PMC free article] [PubMed] [Google Scholar]
- 6.Bergman H, et al. Physiological aspects of information processing in the basal ganglia of normal and parkinsonian primates. Trends Neurosci. 1998;21:32–38. doi: 10.1016/s0166-2236(97)01151-x. [DOI] [PubMed] [Google Scholar]
- 7.Hernandez VM, et al. Parvalbumin+ Neurons and Npas1+ Neurons Are Distinct Neuron Classes in the Mouse External Globus Pallidus. The Journal of neuroscience. 2015;35:11830–11847. doi: 10.1523/JNEUROSCI.4672-14.2015. [DOI] [PMC free article] [PubMed] [Google Scholar]
- 8.Dodson PD, et al. Distinct developmental origins manifest in the specialized encoding of movement by adult neurons of the external globus pallidus. Neuron. 2015;86:501–513. doi: 10.1016/j.neuron.2015.03.007. [DOI] [PMC free article] [PubMed] [Google Scholar]
- 9.Abdi A, et al. Prototypic and arkypallidal neurons in the dopamine-intact external globus pallidus. The Journal of neuroscience. 2015;35:6667–6688. doi: 10.1523/JNEUROSCI.4662-14.2015. [DOI] [PMC free article] [PubMed] [Google Scholar]
- 10.Mallet N, et al. Dichotomous organization of the external globus pallidus. Neuron. 2012;74:1075–1086. doi: 10.1016/j.neuron.2012.04.027. [DOI] [PMC free article] [PubMed] [Google Scholar]
- 11.Hegeman DJ, Hong ES, Hernandez VM, Chan CS. The external globus pallidus: progress and perspectives. The European journal of neuroscience. 2016;43:1239–1265. doi: 10.1111/ejn.13196. [DOI] [PMC free article] [PubMed] [Google Scholar]
- 12.Oh YM, et al. Using a novel PV-Cre rat model to characterize pallidonigral cells and their terminations. Brain structure & function. 2016 doi: 10.1007/s00429-016-1346-2. [DOI] [PubMed] [Google Scholar]
- 13.Albin RL, Young AB, Penney JB. The functional anatomy of basal ganglia disorders. Trends Neurosci. 1989;12:366–375. doi: 10.1016/0166-2236(89)90074-x. [DOI] [PubMed] [Google Scholar]
- 14.DeLong MR. Primate models of movement disorders of basal ganglia origin. Trends Neurosci. 1990;13:281–285. doi: 10.1016/0166-2236(90)90110-v. [DOI] [PubMed] [Google Scholar]
- 15.Kravitz AV, et al. Regulation of parkinsonian motor behaviours by optogenetic control of basal ganglia circuitry. Nature. 2010;466:622–626. doi: 10.1038/nature09159. [DOI] [PMC free article] [PubMed] [Google Scholar]
- 16.Gittis AH, et al. New roles for the external globus pallidus in basal ganglia circuits and behavior. The Journal of neuroscience. 2014;34:15178–15183. doi: 10.1523/JNEUROSCI.3252-14.2014. [DOI] [PMC free article] [PubMed] [Google Scholar]
- 17.Herrera AJ, Castano A, Venero JL, Cano J, Machado A. The single intranigral injection of LPS as a new model for studying the selective effects of inflammatory reactions on dopaminergic system. Neurobiology of disease. 2000;7:429–447. doi: 10.1006/nbdi.2000.0289. [DOI] [PubMed] [Google Scholar]
- 18.Mallet N, et al. Arkypallidal Cells Send a Stop Signal to Striatum. Neuron. 2016;89:308–316. doi: 10.1016/j.neuron.2015.12.017. [DOI] [PMC free article] [PubMed] [Google Scholar]
- 19.Wang J, et al. Coordinated Reset Deep Brain Stimulation of Subthalamic Nucleus Produces Long-Lasting, Dose-Dependent Motor Improvements in the 1-Methyl-4-phenyl-1,2,3,6-tetrahydropyridine Non-Human Primate Model of Parkinsonism. Brain stimulation. 2016;9:609–617. doi: 10.1016/j.brs.2016.03.014. [DOI] [PMC free article] [PubMed] [Google Scholar]
- 20.Soares J, et al. Role of external pallidal segment in primate parkinsonism: comparison of the effects of 1-methyl-4-phenyl-1,2,3,6-tetrahydropyridine-induced parkinsonism and lesions of the external pallidal segment. The Journal of neuroscience. 2004;24:6417–6426. doi: 10.1523/JNEUROSCI.0836-04.2004. [DOI] [PMC free article] [PubMed] [Google Scholar]
- 21.Rubin JE, McIntyre CC, Turner RS, Wichmann T. Basal ganglia activity patterns in parkinsonism and computational modeling of their downstream effects. The European journal of neuroscience. 2012;36:2213–2228. doi: 10.1111/j.1460-9568.2012.08108.x. [DOI] [PMC free article] [PubMed] [Google Scholar]
- 22.Gerfen CR, et al. D1 and D2 dopamine receptor-regulated gene expression of striatonigral and striatopallidal neurons. Science. 1990;250:1429–1432. doi: 10.1126/science.2147780. [DOI] [PubMed] [Google Scholar]
- 23.Smith Y, Bevan MD, Shink E, Bolam JP. Microcircuitry of the direct and indirect pathways of the basal ganglia. Neuroscience. 1998;86:353–387. doi: 10.1016/s0306-4522(98)00004-9. [DOI] [PubMed] [Google Scholar]
- 24.Hammond C, Bergman H, Brown P. Pathological synchronization in Parkinson’s disease: networks, models and treatments. Trends Neurosci. 2007;30:357–364. doi: 10.1016/j.tins.2007.05.004. [DOI] [PubMed] [Google Scholar]
- 25.Kuhn AA, Kupsch A, Schneider GH, Brown P. Reduction in subthalamic 8–35 Hz oscillatory activity correlates with clinical improvement in Parkinson’s disease. The European journal of neuroscience. 2006;23:1956–1960. doi: 10.1111/j.1460-9568.2006.04717.x. [DOI] [PubMed] [Google Scholar]
- 26.Weinberger M, et al. Beta oscillatory activity in the subthalamic nucleus and its relation to dopaminergic response in Parkinson’s disease. Journal of neurophysiology. 2006;96:3248–3256. doi: 10.1152/jn.00697.2006. [DOI] [PubMed] [Google Scholar]
- 27.Vitek JL, Zhang J, Hashimoto T, Russo GS, Baker KB. External pallidal stimulation improves parkinsonian motor signs and modulates neuronal activity throughout the basal ganglia thalamic network. Experimental neurology. 2012;233:581–586. doi: 10.1016/j.expneurol.2011.09.031. [DOI] [PMC free article] [PubMed] [Google Scholar]
- 28.Bernheimer H, Birkmayer W, Hornykiewicz O, Jellinger K, Seitelberger F. Brain dopamine and the syndromes of Parkinson and Huntington. Clinical, morphological and neurochemical correlations. Journal of the neurological sciences. 1973;20:415–455. doi: 10.1016/0022-510x(73)90175-5. [DOI] [PubMed] [Google Scholar]
- 29.Riederer P, Wuketich S. Time course of nigrostriatal degeneration in parkinson’s disease. A detailed study of influential factors in human brain amine analysis. Journal of neural transmission. 1976;38:277–301. doi: 10.1007/BF01249445. [DOI] [PubMed] [Google Scholar]
- 30.Betarbet R, Sherer TB, Greenamyre JT. Animal models of Parkinson’s disease. BioEssays : news and reviews in molecular, cellular and developmental biology. 2002;24:308–318. doi: 10.1002/bies.10067. [DOI] [PubMed] [Google Scholar]
- 31.Deumens R, Blokland A, Prickaerts J. Modeling Parkinson’s disease in rats: an evaluation of 6-OHDA lesions of the nigrostriatal pathway. Experimental neurology. 2002;175:303–317. doi: 10.1006/exnr.2002.7891. [DOI] [PubMed] [Google Scholar]
- 32.Fahn S. Description of Parkinson’s disease as a clinical syndrome. Annals of the New York Academy of Sciences. 2003;991:1–14. doi: 10.1111/j.1749-6632.2003.tb07458.x. [DOI] [PubMed] [Google Scholar]
- 33.Tass PA, et al. Coordinated reset has sustained aftereffects in Parkinsonian monkeys. Annals of neurology. 2012;72:816–820. doi: 10.1002/ana.23663. [DOI] [PubMed] [Google Scholar]
- 34.Adamchic I, et al. Coordinated reset neuromodulation for Parkinson’s disease: proof-of-concept study. Movement disorders. 2014;29:1679–1684. doi: 10.1002/mds.25923. [DOI] [PMC free article] [PubMed] [Google Scholar]
- 35.Corbit VL, et al. Pallidostriatal Projections Promote beta Oscillations in a Dopamine-Depleted Biophysical Network Model. The Journal of neuroscience. 2016;36:5556–5571. doi: 10.1523/JNEUROSCI.0339-16.2016. [DOI] [PMC free article] [PubMed] [Google Scholar]
- 36.Holgado AJ, Terry JR, Bogacz R. Conditions for the generation of beta oscillations in the subthalamic nucleus-globus pallidus network. The Journal of neuroscience. 2010;30:12340–12352. doi: 10.1523/JNEUROSCI.0817-10.2010. [DOI] [PMC free article] [PubMed] [Google Scholar]
- 37.Erez Y, Czitron H, McCairn K, Belelovsky K, Bar-Gad I. Short-term depression of synaptic transmission during stimulation in the globus pallidus of 1-methyl-4-phenyl-1,2,3,6-tetrahydropyridine-treated primates. The Journal of neuroscience. 2009;29:7797–7802. doi: 10.1523/JNEUROSCI.0401-09.2009. [DOI] [PMC free article] [PubMed] [Google Scholar]
- 38.Bar-Gad I, Elias S, Vaadia E, Bergman H. Complex locking rather than complete cessation of neuronal activity in the globus pallidus of a 1-methyl-4-phenyl-1,2,3,6-tetrahydropyridine-treated primate in response to pallidal microstimulation. The Journal of neuroscience. 2004;24:7410–7419. doi: 10.1523/JNEUROSCI.1691-04.2004. [DOI] [PMC free article] [PubMed] [Google Scholar]
- 39.Chin GD, Hutchison WD. Effects of cobalt and bicuculline on focal microstimulation of rat pallidal neurons in vivo. Brain stimulation. 2008;1:134–150. doi: 10.1016/j.brs.2008.05.001. [DOI] [PubMed] [Google Scholar]
- 40.Bugaysen J, Bar-Gad I, Korngreen A. The impact of stimulation induced short-term synaptic plasticity on firing patterns in the globus pallidus of the rat. Frontiers in systems neuroscience. 2011;5:16. doi: 10.3389/fnsys.2011.00016. [DOI] [PMC free article] [PubMed] [Google Scholar]
- 41.Johnson MD, Zhang J, Ghosh D, McIntyre CC, Vitek JL. Neural targets for relieving parkinsonian rigidity and bradykinesia with pallidal deep brain stimulation. Journal of neurophysiology. 2012;108:567–577. doi: 10.1152/jn.00039.2012. [DOI] [PMC free article] [PubMed] [Google Scholar]
- 42.Chan CS, et al. HCN channelopathy in external globus pallidus neurons in models of Parkinson’s disease. Nature neuroscience. 2011;14:85–92. doi: 10.1038/nn.2692. [DOI] [PMC free article] [PubMed] [Google Scholar]
- 43.Hardman CD, Halliday GM. The external globus pallidus in patients with Parkinson’s disease and progressive supranuclear palsy. Movement disorders. 1999;14:626–633. doi: 10.1002/1531-8257(199907)14:4<626::aid-mds1012>3.0.co;2-u. [DOI] [PubMed] [Google Scholar]
- 44.Gong S, et al. Targeting Cre recombinase to specific neuron populations with bacterial artificial chromosome constructs. J Neurosci. 2007;27:9817–9823. doi: 10.1523/JNEUROSCI.2707-07.2007. [DOI] [PMC free article] [PubMed] [Google Scholar]
- 45.Madisen L, et al. A robust and high-throughput Cre reporting and characterization system for the whole mouse brain. Nat Neurosci. 2010;13:133–140. doi: 10.1038/nn.2467. [DOI] [PMC free article] [PubMed] [Google Scholar]
- 46.Fogarty M, et al. Spatial genetic patterning of the embryonic neuroepithelium generates GABAergic interneuron diversity in the adult cortex. J Neurosci. 2007;27:10935–10946. doi: 10.1523/JNEUROSCI.1629-07.2007. [DOI] [PMC free article] [PubMed] [Google Scholar]
- 47.Kravitz AV, et al. Regulation of parkinsonian motor behaviours by optogenetic control of basal ganglia circuitry. Nature. 2010;466:622–626. doi: 10.1038/nature09159. [DOI] [PMC free article] [PubMed] [Google Scholar]
- 48.Mastro KJ, Bouchard RS, Holt HA, Gittis AH. Transgenic mouse lines subdivide external segment of the globus pallidus (GPe) neurons and reveal distinct GPe output pathways. J Neurosci. 2014;34:2087–2099. doi: 10.1523/JNEUROSCI.4646-13.2014. [DOI] [PMC free article] [PubMed] [Google Scholar]
- 49.Kravitz AV, Owen SF, Kreitzer AC. Optogenetic identification of striatal projection neuron subtypes during in vivo recordings. Brain Res. 2013;1511:21–32. doi: 10.1016/j.brainres.2012.11.018. [DOI] [PMC free article] [PubMed] [Google Scholar]
- 50.Willard AM, Bouchard RS, Gittis AH. Differential degradation of motor deficits during gradual dopamine depletion with 6-hydroxydopamine in mice. Neuroscience. 2015;301:254–267. doi: 10.1016/j.neuroscience.2015.05.068. [DOI] [PMC free article] [PubMed] [Google Scholar]
- 51.Gradinaru Viviana, Mogri Murtaza, Thompson Kimberly R, Henderson Jaimie M, Deisseroth Karl. Optical deconstruction of parkinsonian neural circuitry. science. 2009;324(5925):354–359. doi: 10.1126/science.1167093. [DOI] [PMC free article] [PubMed] [Google Scholar]
Associated Data
This section collects any data citations, data availability statements, or supplementary materials included in this article.