

SUMMARY
We introduce neutron-encoded (NeuCode) amino acid labeling of mice as a strategy for multiplexed proteomic analysis in vivo. Using NeuCode we characterize an inducible knock-out mouse model of Bap1, a tumor suppressor and deubiquitinase whose in vivo roles outside of cancer are not well established. NeuCode proteomics revealed altered metabolic pathways following Bap1 deletion, including profound elevation of cholesterol biosynthetic machinery coincident with reduced expression of gluconeogenic and lipid homeostasis proteins in the liver. Bap1 loss increased pancreatitis biomarkers and reduced expression of mitochondrial proteins. These alterations accompany a metabolic remodeling with hypoglycemia, hypercholesterolemia, hepatic lipid loss, and acinar cell degeneration. Liver-specific Bap1-null mice present with fully penetrant perinatal lethality, severe hypoglycemia and hepatic lipid deficiency. This work reveals Bap1 as a metabolic regulator in the liver and pancreas, and establishes NeuCode as a reliable proteomic method for deciphering in vivo biology.
IN BRIEF
Baughman et al. use NeuCode in vivo labeling for multiplexed quantitation in mouse tissues. Using this approach, coupled with multiple genetically engineered mouse models, they demonstrate a role for Bap1 in maintaining metabolic homeostasis in the liver and pancreas.
INTRODUCTION
Mass spectrometry (MS) proteomics is an essential tool for studying proteins and post-translational modifications (PTMs) that are dysregulated in human disease (Lawrence et al., 2015). While mouse models are the primary systems for emulating human disease in vivo (Cheon and Orsulic, 2011), the quantitative MS toolkit for in vivo studies is limited.
In mice, stable isotope labeling in mammals (SILAM) is a gold standard quantitative method (Geiger et al., 2013; Krüger et al., 2008; McClatchy and Yates, 2008; Wu et al., 2004). In SILAM, control mice are fed isotopically labeled amino acids to create heavy protein samples (Zanivan et al., 2011). Labeled reference samples are mixed equally with unlabeled samples and quantified using LC-MS/MS (Zanivan et al., 2013). SILAM enables accurate quantitation with a large dynamic range, while not suffering from ratio compression seen in isobaric tagging. Additionally, SILAM yields more labeled protein than other methods and permits sample mixing prior to digestion and enrichment, facilitating accurate quantitation of low abundance analytes. However, SILAM is normally performed as duplex quantitation and used sparingly for practical reasons (Krüger et al., 2008). For instance, complete protein labeling is required since unlabeled peptides from a heavy reference sample overlap with and artificially augment the signal intensity of light peptides (Krüger et al., 2008); yet full labeling is costly and takes several months. Despite its shortcomings, there is considerable demand for in vivo labeling to study mouse models of disease (Rayavarapu et al., 2013; Zanivan et al., 2013).
Recently, we developed neutron encoded (NeuCode) lysine isotopologues differing in mass by 6 to 36 mDa for multiplexed metabolic labeling (Hebert et al., 2013; Merrill et al., 2014; Rhoads et al., 2014). NeuCode experiments simultaneously compare up to four heavy labeled protein samples and ignore unlabeled peptides, thus obviating the need for complete labeling (Rose et al., 2013). Applying NeuCode in mammals (NeuCode SILAM) should offer increased multiplexing and significantly shorter in vivo labeling times, so long as isotopologue incorporation rates are equivalent.
Brca1-associated protein (Bap1) is a deubiquitinating enzyme whose loss of function is associated with multiple human cancers (Carbone et al., 2013; Schalken et al., 2010; Testa et al., 2011; Wiesner et al., 2011). Bap1 knockout is embryonic lethal in mice and its conditional deletion triggers myeloproliferation, splenomegaly, and thrombocytopenia (Dey et al., 2012). Bap1 is ubiquitously expressed (Lattin et al., 2008), but its roles outside the hematopoietic system and cancer have not been well-studied. As part of a chromatin-associated complex which includes Hcfc1, Ogt, Asxl1/2, Foxk1/2 and Kdm1b (Dey et al., 2012; Misaghi et al., 2009; Scheuermann et al., 2010; Yu et al., 2010), Bap1 influences histone dynamics by deubiquitinating histone 2A (Scheuermann et al., 2010). Recent studies link Bap1-interacting proteins to metabolic homeostasis. Mice lacking Asxl2 are hyperglycemic with lipodystrophy and osteopetrosis (Izawa et al., 2015). Ogt and Hcfc1 influence nutrient homeostasis by glycosylating substrate proteins in response to glucose levels and regulating transcriptional pathways (Ma and Hart, 2013; Ruan et al, 2012). These findings suggest that Bap1 may also regulate metabolic homeostasis.
Here, we introduce NeuCode SILAM as a tool for deciphering mammalian biology in vivo. We show that NeuCode isotopologues incorporate at similar rates in mice without phenotypic consequences, and that accurate quantitation can be achieved within days in some tissues. NeuCode SILAM analyses of BAP1 knockout revealed substantial dysregulation of metabolic pathways. In vivo metabolic studies support Bap1’s involvement in lipid and glucose homeostasis. Together, our findings implicate Bap1 in metabolic regulation and establish NeuCode SILAM as a promising tool for deciphering in vivo mammalian biology.
RESULTS
NeuCode expedites mammalian metabolic isotope studies
In SILAM, labeling is achieved by feeding mice a lysine deficient diet supplemented with a heavy lysine isotope that incorporates into proteins over time. Unlike cell culture studies where complete labeling can be achieved within days, >95% labeling of proteins in tissues requires months and is only achieved in second generation pups (from labeled mothers) (Krüger et al., 2008). Whereas partial labeling is appealing for pragmatic reasons, complete labeling is strongly preferred because light signal from incompletely labeled samples convolutes measurements. For example, if a partially labeled (e.g., 50% heavy) protein sample is equally mixed with a light protein sample, MS analysis would yield a heavy:light ratio of 1:3 instead of the desired 1:1 (Figure 1A). This artifact is difficult to correct, as incorporation rates are protein- and tissue-dependent. Given that fully labeled SILAM tissues are costly, commercially available only for selected strains, and currently limited to 2-plex comparisons, a strategy that overcomes these limitations would have great value.
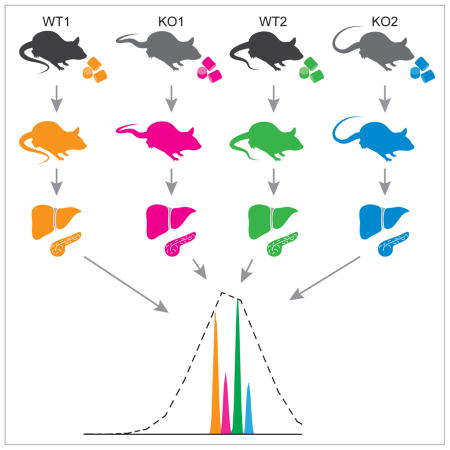
Figure 1. NeuCode SILAM allows protein quantification from partially labeled mouse tissues.

A) Schematic comparing partial labeling in SILAM with NeuCode SILAM. In SILAM, a 50% labeled peptide (red) from a ‘heavy’ mouse will have an unlabeled counterpart (dark gray) that overlaps in mass with unlabeled (light gray) peptide from the ‘light’ mouse. NeuCode uses heavy to heavy ratios (blue:red) and ignores unlabeled peptides.
B) In 4-plex NeuCode, mice are labeled with K602, K521, K440, or K080, tissues harvested, and protein lysates equally mixed for MS analysis. During MS, a low resolution MS1 scan at 30,000 (dotted line) is performed and used to trigger data-dependent MS2. Both light and heavy features can be observed due to partial labeling. During MS2 acquisition, a high resolution MS1 scan (480,000) resolves closely spaced NeuCode isotopologues (colored peaks). Isotopologue area under the curve signal is used to quantify peptide abundance.
We reasoned that NeuCode offers an opportunity to shorten in vivo labeling time compared to traditional SILAM, since NeuCode experiments compare labeled protein to labeled protein. In a NeuCode experiment, light peptides are ignored during quantification and the equally mixed, partially labeled (e.g., 50%) heavy samples yield the desired 1:1 peptide ratios (Figure 1A). So long as incorporation has occurred, and the incorporation rate of one isotopologue is comparable to another, complete labeling is not necessary. Considering newly synthesized lysine isotopologues, 4-plex NeuCode is possible, accommodating multiple conditions within an analysis (Figure 1B).
NeuCode lysine isotopologue labeling kinetics
To test whether NeuCode can shorten SILAM labeling, we assessed the incorporation rates of K602 and K080 isotopologues which differ in mass by 36 mDa. To refer to these isotopologues, we define a nomenclature: letter denotes amino acid, first digit 13C count, second digit 2H count, third digit 15N count. The heaviest lysine isotopologue, K080, is of special interest since every useable position is deuterated. High deuterium content could be a concern given that its smaller atomic radius (compared to hydrogen) may induce physiological effects or alter labeling (Katz et al., 1962).
We fed ten-week-old male C57BL/6J mice customized K000, K602, or K080 diets for 3, 10, 20, or 30 days (Figure 2A). At each interval, three mice from the K602 and K080 groups were sacrificed and 9 tissues collected (Figure 2A, Table S1). Mice fed isotopologue-containing diets appeared equally active as controls, with food consumption (Figure S1A) and body weights (Figure S1B) indistinguishable from the control group (p > 0.2, Welch’s t-test).
Figure 2. Labeling Efficiency and Accuracy of NeuCode SILAM.

A) Mice were labeled with either K602 or K080 for 3–30 days. Proteins extracted from nine tissues were LysC digested and analyzed by MS. Light and heavy peptides are quantified to assess percent labeling. K602 and K080 peptide samples from some tissues were also mixed at defined ratios to assess NeuCode accuracy.
B) Heavy lysine % incorporation is plotted by tissue and labeling time. Box plots represent the average of n=3 animals per protein (K602–blue; K080-red). Box edges are the 25th and 75th percentiles, with the median protein shown. Whiskers extend to 1.5X interquartile range and outliers plotted as circles.
C) Correlation plots of K602:K080 labeling for a representative biological replicate from each time point and tissue.
D) Proteins from mice fed K602 or K080 were mixed in defined ratios (1:1, 5:1, and 10:1) for intestine, liver, and brain. Expected ratios are signified by dotted lines and measured ratios displayed as box plots as in 2B.
To assess whether isotopologues incorporate at similar rates, proteins were extracted from each tissue/time point (108 total samples), digested with LysC, and analyzed by high resolution nLC-MS/MS. Isotope incorporation for each protein was calculated by dividing the intensity of the heavy feature by the summed intensity of heavy and light (Figure 2A, %labeling). Figure 2B shows label incorporation by protein in each tissue as a function of diet and days of labeling. We observe broadly distributed incorporation rate across the tissues, likely due to reagent availability and protein turnover rates (McClatchy and Yates, 2008). The intestine, for example, labels very quickly (~40% within three days), while the muscle takes ~ 30 days to reach ~ 50% labeling. Interestingly, tissues with slow mean incorporation (e.g., muscle, brain) exhibit a broader distribution of lysine incorporation (Figure 2B). We next plotted incorporation by protein and observed that isotopologues displayed similar rates across all tissues (Figure 2C), with only 8/19,316 protein measurements differing significantly between isotopologues (FDR < 0.01, t-test with Bonferroni correction, n=3 biological replicates). We conclude that incorporation of K602 and K080 is nearly identical.
NeuCode SILAM quantitative performance
Having surveyed labeling kinetics, we next sought to determine the shortest labeling time required for accurate quantitation. Peptides from the study above were mixed in 1:1, 5:1, and 10:1 (K602:K080) ratios for each of four time points (Figure 2A, Ratios). Tissues exhibiting low (brain), medium (liver), and high (intestine) incorporation were analyzed, comprising 36 nLC-MS/MS experiments (Figure 2D, Table S2). Impressively, within 3 days of labeling, 84% of identified intestinal peptides reported measurements within ±15% of expected ratio (Figure 2D). In the liver, we quantified 85% of detected peptides after 10 days of labeling, when the average protein is 60% labeled (Figure 2D). Slow incorporating tissues, such as the brain, require longer labeling periods. After 10–20 days of labeling, brain proteins measured in the 10:1 sample differ by >25% from the expected value; however, labeling for 30 days results in 80% of identified peptides being accurately quantified (±15%) (Figure 2D). These data describe a relationship between lysine incorporation and the %quantifiable peptides, with increased mean incorporation improving quantitation (Figure S1C). In general, a mean lysine incorporation of 50% enables quantitation of >80% of identified peptides. From these data we conclude that a subset of tissues can be accurately quantified after just 10 days of labeling, while labeling for 20–30 days ensures accurate quantitation more broadly.
NeuCode SILAM reveals altered metabolic pathways after Bap1 deletion
Loss of function mutations in Bap1 are frequently observed in cancer (Carbone et al., 2013), but pathways regulated by Bap1 in normal tissues remain unstudied. To examine these pathways in vivo, NeuCode SILAM isotopologues with 12mDa spacing (K602/K521/K440/K080 Figure 1B) were used to label tamoxifen-inducible Cre-expressing Bap1wt/wt, Rosa26.creERT2+ (Bap1wt) and Bap1fl/fl, Rosa26.creERT2+ (BAP1ko) mice. We projected that three weeks of NeuCode labeling would permit accurate quantitation in most tissues (Figure 2), and hence, three Bap1ko and three Bap1wt mice were labeled for 21 days (Figure 3A). A matching set of six mice were fed matching K000 chow to control for isotopologue effects and increase replicates for other measurements. After 10 days of labeling, mice were subjected to a 5-day series of tamoxifen injections to delete Bap1. After 21 days of labeling, the mice were sacrificed and tissues harvested for RNA and proteomic analysis. During the study, most mice consumed comparable amounts of chow (Figure S2A–B). One Bap1ko mouse labeled with K080 consumed less food after Bap1 deletion, and was sacrificed a day early due to hunched posture and lethargy, a phenotype sometimes observed in Bap1ko mice. Bap1 mRNA expression was reduced 80–95% in liver, spleen, and pancreas, while deletion in other tissues was less effective (50–80%, Figures 3C, S3). Since overexpression of Bap1 in liver can modestly enhance gluconeogenesis (Ruan et al., 2012), we measured serum glucose at intervals from the start of tamoxifen injections. Bap1ko mice became significantly hypoglycemic on the day following the last tamoxifen injection (i.e. Day 1; Figure 3B). An independent cohort of unlabeled Bap1ko mice also exhibited hypoglycemia at day 7, signifying a consistent and necessary role for Bap1 in maintaining euglycemia (Figure S4).
Figure 3. NeuCode SILAM Analysis Seven Days Following Bap1 Deletion.

A) Bap1ko NeuCode experimental design. Mice were labeled 21 days with four NeuCode diets (K602, K521, K440, K080). During labeling, mice were treated with tamoxifen (tam) for 5 days to delete Bap1. Day 0 is the fifth and final tam injection (day 14 of labeling). Liver, pancreas, and spleen were harvested and protein lysates mixed as 4-plex and 2-plex. High resolution (480,000) MS1 scans reveal NeuCode-labeled peptides which are quantified by ‘area under the curve’.
B) Glucose measurements during (day < 0) and after (day > 0) 5 daily tam injections. * p < .05; ** p < .01 in two-tailed unpaired T-test. n=6 per group.
C) Bap1 mRNA measured by qPCR with primers spanning the deleted exons. n=6 per group.
D) Number of proteins changing more than 1.5-fold with a nominal p < .05 following Bap1 deletion.
E,F,G) Volcano plots of all proteins using log2 ratios and nominal p-values. Significantly enriched protein sets and individual proteins referred to in the text are colored and labeled.
We performed NeuCode proteomic profiling on spleen, as Bap1 dramatically influences hematological composition (Dey et al 2012), and on liver and pancreas, since they are closely tied to metabolic homeostasis. Lysates from biological replicates of each tissue were mixed in 4-plex or 2-plex formats, digested with Lys-C, and fractionated for nLC-MS/MS analysis (Figure 3A). In aggregate, 7646 proteins were quantified in at least one tissue (Table S3). We noted that sets of significantly changing proteins show minimal overlap between tissues, a result that suggests Bap1 is a context-dependent regulator of multiple pathways (Figure 3D).
We performed protein set enrichment analyses of GO and KEGG pathways using DAVID (Figures 3E–G) (Huang et al., 2009). In the spleen, Bap1 deletion reduced cell cycle proteins (p=6.2e-20), consistent with pancytopenia often observed in myelodysplastic disorders (Foran and Shammo, 2012) (Figure 3E). In pancreas, Bap1 knockout elevated Reg family pancreatitis markers (Graf et al., 2002), and significantly reduced mitochondrial protein expression (p=2.3e-4) (Figure 3F). Intriguingly, pancreatic acinar cells harbor large numbers of mitochondria to power exocrine output (Petersen, 2012). From these results we hypothesized that Bap1 is involved in acinar cell maintenance. In Bap1ko liver, acute phase inflammation biomarkers including Hp, Hamp, Orm1/2, and Mt1/2 were elevated, suggesting an ongoing stress or damage response (Gruys et al., 2005). The hexose (p=.035) and glucose metabolic pathways (p=.053) were also repressed in the liver. Fbp1, a key enzyme in gluconeogenesis, was decreased nearly 2-fold upon Bap1 deletion (Figure 3G). Other glycolytic and gluconeogenic regulators including Pklr and Aldob were also depleted and could contribute to the hypoglycemia observed. While lipid pathways were not broadly changed, key lipid chaperones Fabp1/2/5 and Plin2 were markedly reduced. Most strikingly, the cholesterol biosynthetic pathway was significantly elevated (p=3.6e-13) in Bap1ko liver. Taken together, our NeuCode proteomic analyses link Bap1 to metabolic and tissue damage pathways in liver and pancreas, providing key hypotheses for in vivo experimentation.
Bap1 regulates the metabolic proteome independent of hematopoietic defects
In addition to hypoglycemia, our proteomic data suggest that Bap1ko mice may suffer from eventual liver and pancreas damage, as well as lipid and cholesterol mismanagement. However, these hypotheses are difficult to test in Bap1ko mice due to myeloid transformation. Bap1ko mice become lethargic and require euthanization within weeks, precluding analysis of later developing phenotypes such as tissue damage. Indeed, one Bap1ko mouse in our NeuCode study was sacrificed a day early for this reason. Hematopoietic defects might indirectly influence the proteomic markers of metabolic rewiring and damage observed in the liver and pancreas.
To exclude the hematopoietic role of Bap1, we rescued Bap1fl/fl, Rosa26.creERT2+ mice with bone marrow from Bap1wt/wt donor mice. After hematopoietic reconstitution for five weeks, Bap1 was deleted by tamoxifen injection (Figure 4A). Bone marrow chimeric Bap1ko mice (i.e. BMC-Bap1ko) exhibited normal platelet counts compared to matched wild-type tamoxifen-treated controls (Figure 4B). Serum glucose measurements in male and female mice revealed significant hypoglycemia by day 7 (Figure 4C), establishing that this metabolic parameter is not due to hematopoietic Bap1 deletion. Importantly, BMC-Bap1ko mice survive >3 months, indicating that Bap1 expression in the adult hematopoietic system is necessary for long-term viability.
Figure 4. Proteomic and pathological characterization of BMC-Bap1ko mice.

A) Schematic of bone marrow rescue experiments and NeuCode labeling.
B) Platelet measurements. N=3 mice per group, error bars=SEM.
C) Time course of glucose measurements following Bap1 deletion in BMC mice. n = 11 Wt female, 10 Ko female, 9 Wt male, 9 Ko male mice. *p < .001, two-tailed unpaired T-test.
D) Proteins changing >2-fold with nominal p < .05 in NeuCode SILAM data from each tissue following 3 months of Bap1 knockout with the final 3 weeks being fed NeuCode diets. N=3 Wt and Ko.
E) Comparison between all proteins identified in NeuCode SILAM experiments in the liver at day 7 from Figure 3, and at day 90 post-Bap1 deletion. Select proteins are labeled.
F) Log2 Ko:Wt ratios of enriched K-GG (ubiquitinated) peptides from Day 7 Bap1ko NeuCode livers are plotted against liver total protein ratios from the same samples analyzed in Figure 3F. H2A histone isoforms and outer membrane mitochondrial proteins Vdac1/2/3 and Maob are highlighted. Residue numbers derive from UniProt and include the start methionine.
To assess whether similar proteomic pathways are altered in BMC-Bap1ko mice, tamoxifen injections were performed 5 weeks following bone marrow reconstitution. BMC-Bap1ko mice were aged for 9 weeks, then NeuCode labeled for 3 weeks (Figure 4A). Mice ate similar quantities of labeled food (Figure S5), and did not appear affected by the isotopologue diet. We focused our analyses on liver and pancreas, which exhibit effective Bap1 deletion and the most significant proteomic changes (Figure 4D, S3). In the liver, we observed a similar proteomic signature to non-BMC mice 7 days after knockout, with elevation of cholesterol biosynthesis and down-regulation of gluconeogenesis and lipid chaperone proteins (Figure 4E). Bap1 deletion in liver therefore affects metabolism independently of the hematopoietic system.
In the pancreas, the proteomic signature observed 12 weeks after Bap1 deletion mirrored changes from the non-BMC day 7 dataset (Figure S6). In both datasets, mitochondrial proteins were reduced and pancreatitis markers, such as Reg2 and Reg3, were up-regulated. Effect sizes increased after 12 weeks, suggesting a progressive transformation of the pancreatic proteome. Strikingly, there was substantial loss of ribosomal structural subunits, which was not observed at seven days post-deletion (Figure S6).
Bap1 modulates histone H2A and mitochondrial ubiquitination in the liver
While Bap1 regulates histone H2A ubiquitination in cultured cells (Scheuermann et al., 2010), its activity toward distinct H2A isoforms in the liver has not been described. Ubiquitinated peptides can be enriched using antibodies against the tryptic, di-glycine remnant (K-GG) and quantified by mass spectrometry (Kim et al. 2011). We used NeuCode SILAM to analyze K-GG peptides in 4-plex and 2-plex liver samples at day 7 post deletion. K-GG peptide ratios were compared to their corresponding protein level ratios (Figure 3G) for peptides quantified in at least two biological replicates (Figure 4F, Table S5). Bap1 loss elevated ubiquitination of the canonical H2A K119 site nearly 2-fold. The alternative H2AX isoform exhibited increased ubiquitination at K119 and K120, but not K128, in Bap1ko liver. The corresponding K116 site on macro-histone H2AY ubiquitination increased 1.5-fold without a change in total protein abundance. Bap1 deletion in the liver also increased ubiquitination of select outer mitochondrial membrane proteins, including the three Vdac isoforms and Maob (Figure 4F). Although the exact roles of Vdac and Maob ubiquitination in liver metabolism are unknown, they can be indicators of mitochondrial stress (Narendra et al., 2010).
Bap1 loss causes defects in liver gluconeogenesis and lipid homeostasis
To assess whether our proteomic results predicted metabolic changes in vivo, we tested serum biomarkers in fed and fasted cohorts of BMC-Bap1wt and BMC-Bap1ko mice 2 and 12 weeks post-deletion (Figure 5A–B). As predicted, BMC-Bap1ko mice display high cholesterol at both early and late time points. Surprisingly, after 2 weeks, cholesterol appears higher only in the fasting state (Figure 5A). In the proteomics data from 12 weeks post-deletion, the rate-limiting enzyme for ketone body biosynthesis, Hmgcs2, was reduced nearly 2-fold in BMC-Bap1ko (Table S4). Consistent with this, fasting ketogenesis was severely blunted in BMC-Bap1ko mice (Figure 5A).
Figure 5. Serum chemistry and pathology of BMC-Bap1ko mice.

A,B) Serum chemistry for Bap1-BMC mice 2 or 12 wks post-deletion. Fed denotes ad-libitum feeding, and fasted denotes a 16 hr overnight fast. At 12 wks: Wt-fed (n=12), Wt fast (n=12), Ko-fed (n=14), Ko-fast (n=14). At 2 wks: Wt-fed (n=5), Wt-fast (n=12), Ko-fed (n=5), Ko-fast (n=14). * p <.001, unpaired two-tailed T-test.
C,D) H&E staining of pancreas and liver of BMC-Bap1-Wt and Ko mice 2 wks and 12 wks post-deletion.
As predicted by proteomic signatures of liver acute phase response, damage markers ALT and AP were elevated at 2 weeks and progressed higher by 12 weeks post-deletion. Total serum protein was reduced at 12, but not at 2 weeks signifying progressive liver malfunction (Figure 5B). Frozen sections from BMC-Bap1ko livers appeared histologically normal 2 weeks post-deletion (Figure 5C), but revealed disorganized hepatic plates, scattered pyknotic nuclei (signifying dying hepatocytes), and hypereosinophilic staining with diminished vacuolation after 12 weeks (Figure 5C). Significant immune cell infiltration, typical of hepatitis, was not observed.
Our proteomic results posit that Bap1 is required for preserving pancreatic acinar cell functions. Two weeks after Bap1 deletion, acinar cells were notably larger and hypereosinophilic. After 12 weeks, acinar cells degenerated severely, leaving isolated islets and instances of apparent ductal hyperplasia (Figure 5D). Pancreas histology data at 12 weeks post deletion aligned well with NeuCode SILAM, as acinar-enriched mitochondrial and ribosomal proteins were conspicuously diminished in Bap1ko (Figure S6).
We sought to further refine our understanding of Bap1 function using a battery of metabolic assays. To avoid complications from the later developing liver damage, pancreatitis, and myeloproliferation, experiments were performed on BMC-Bap1ko mice within 2 weeks of deletion, when livers appeared normal by histology (Figure 5C) and liver damage markers showed only modest elevation (Figure 5A). Despite abnormal acinar cell architecture, the islets appeared normal by histology and insulin staining (Figure 6A). Circulating insulin was significantly lower in fasting BMC-Bap1ko animals, possibly due to increased insulin sensitivity or hypoglycemia, but insulin release after glucose challenge was similar to controls (Figure 6B). Normal insulin staining and release in BMC-Bap1ko mice indicate that changes in insulin dynamics are not the primary factor dysregulating glucose homeostasis.
Figure 6. Metabolic characterization of BMC-Bap1Ko mice.

A) Insulin staining of BMC-Bap1wt and BMC-Bap1ko pancreas 2wks post-deletion. Representative image from n=3 mice.
B) Insulin release assay. Mice were fasted 12hr and serum insulin concentrations measured at times after glucose injection. Error bars: SEM. *p<.01. Replicated in 2 independent cohorts.
C) Glucose tolerance assay. Mice were fasted for ~6hr and serum glucose measured at the times after glucose challenge. Error bars: SEM. *p<.001. Replicated in 3 independent cohorts.
D) Pyruvate tolerance assay. Mice were fasted overnight (~16hr) and serum glucose measured at the times after pyruvate injection. Error bars: SEM. * p<.001. Replicated in 3 independent cohorts.
E) Oil Red O staining of BMC-Bap1 Wt and Ko ad-libitum fed or fasted 12hr. Representative of n=3 mice per condition.
F) BMC-Bap1-Wt and Ko mice were fed high fat chow for the indicated times starting 2 wks post-deletion. *p<1e-10.
Consistent with increased insulin sensitivity, BMC-Bap1ko animals were more glucose tolerant after fasting (Figure 6C). In a pyruvate tolerance test, BMC-Bap1ko animals were severely blunted in gluconeogenic capacity (Figure 6D). Recently, the master metabolic regulator Pgc1α was reported to be stabilized by Bap1-mediated deubiquitination in 293T cells. Pgc1α protein was below the detection limit for MS or western-blotting in Neucode liver samples. Surprisingly, Pgc1α mRNA was reduced ~85% in fed liver, but still induced during fasting (Figure S7A). We did not observe blunted fasting induction of the Pgc1α target and rate-limiting gluconeogenesis enzyme, Pck1 (Figure S7B). G6pc was modestly induced by fasting but did not reach statistical significance (Figure S7C). These data suggest Bap1 regulation of gluconeogenesis and Pgc1α are likely more complex than previously appreciated.
During fasting gluconeogenesis, the liver relies on lipid mobilization and fatty acid oxidation for fuel in place of glucose. Because our data revealed decreased lipid chaperones in Bap1ko mice (Figure 3G), we stained for lipids in the liver (Figure 6E). Similar to mice lacking Fabp1 and Plin5 (Newberry et al., 2003; Wang et al., 2015), two proteins downregulated in Bap1ko livers, BMC-Bap1ko mice had significantly lower liver lipid stores during fasting, indicating that Bap1 is essential for limiting lipid utilization, uptake, or production. Consistent with Bap1 regulating lipid metabolism, BMC-Bap1ko mice were completely resistant to weight gain on a high fat diet for up to 6 weeks (Figure 6F).
Liver-specific Bap1 deletion causes perinatal lethality with hypoglycemia and hepatic hypolipidemia
The metabolic alterations observed in adult BMC-Bap1ko mice may be shaped by multiple organs. Since pancreatic islets were normal (Figure 6A–B), we reasoned that Bap1 functions primarily in the liver to control gluconeogenesis and lipid homeostasis. Surprisingly, liver-specific Bap1ko mice (Bap1fl/fl;Alfp-Cre+) expired within 48 hr of birth. Label-free proteomics on 12hr post-natal livers revealed key gluconeogenic enzymes G6pc and Fbp1 were significantly down-regulated (Figure 7A). As in adults, Bap1 loss did not suppress Pck1 (Figure 7A) but did significantly reduce Plin and Fabp proteins (Figure 7B). Key cholesterol biosynthesis enzymes including Hmgcs1 and Hmgcr were also elevated (Figure 7C). Overall, the metabolic protein alterations observed in adult Bap1ko animals are similarly perturbed in Bap1fl/fl;Alfp-Cre+ neonates.
Figure 7. Liver-specific Bap1 deletion causes neonatal mortality with metabolic defects.

A–C) Label-free proteomics of gluconeogenenic, lipid chaperone, and cholesterol biosynthesis enzyme expression in the neonatal liver (12–24hr postnatal). n=3 mice. Error bars: SEM. *p<0.05.
D) Blood glucose recorded 1–4hr post-partum for each indicated genotype. *p<.01. **p<1e-8.
E) H&E staining of frozen neonatal liver section ~6hr post-partum.
F) Cleaved caspase3 staining of liver frozen sections ~12hr post-partum.
G) Frozen sections of liver stained with Oil Red O (Red) demonstrating intra-hepatic lipid of E18.5 embryos and P0 neonates (~12hr post-partum) with the designated genotypes.
Liver gluconeogenesis is essential for neonates to survive until suckling (Grijalva and Vakili, 2013). In concert with low expression of gluconeogenic enzymes, liver-specific Bap1ko mice were profoundly hypoglycemic within hours after birth (Figure 7D), suggesting that these neonates fail to activate gluconeogenesis. We observed moderate hypoglycemia in heterozygous Bap1wt/fl;Alfp-Cre+ neonates, indicating a dose effect of Bap1 protein (Figure 7D). Bap1fl/fl;Alfp-Cre+ liver sections showed less vacuolation than wild-type tissues (Figure 7E). Occasional shrunken nuclei were also observed by histology but post-natal cleaved caspase3 levels were indistinguishable from controls, indicating the absence of overt liver damage that may indirectly cause metabolic distress (Figure 7F). Lipids and glycogen were both depleted in Bap1fl/fl;Alfp-Cre+ neonatal liver (Figures 7G, S7D). In prenatal livers at E18.5, we observed a striking Bap1 dose-dependent loss of lipids similar to that seen after birth (Figure 7G). Bap1 expression is therefore critical for hepatic lipid management in preparation for post-partum fasting (Figure 7G). Taken together, our data show that Bap1 is essential for maintaining lipid and glucose homeostasis in the neonatal and adult mouse liver.
DISCUSSION
This work demonstrates the effectiveness of NeuCode proteomics for studying genetically engineered mouse models and reveals a prominent role for Bap1 in metabolic homeostasis. Bap1 has received considerable attention for its mutational spectrum in cancer (Carbone et al., 2013; Schalken et al., 2010; Testa et al., 2011; Wiesner et al., 2011). Bap-interacting proteins are consistent among cell types and tissues (Dey et al., 2012; Machida et al., 2009; Misaghi et al., 2009; Scheuermann et al., 2010; Yu et al., 2010), with several showing roles in metabolic homeostasis (Bond and Hanover, 2015; Iwata et al., 2013; Izawa et al., 2015). Asxl1 and Asxl2 are obligate subunits which control Bap1 activity and proposed to differentially regulate nuclear receptors Lxr, Ppara, and Pparg (Park et al., 2011, 2014). Asxl2-null mice show impairment of lipogenesis in adipose tissue and Pparg-mediated activation of osteoclastogenesis (Izawa et al., 2015). It will be interesting to determine if Asxl2 functions alone or through Bap1 to mediate these effects. Asxl2-null mice were not assessed for liver hypolipidemia, but were surprisingly hyperglycemic, suggesting differential regulation of glucose pathways by Bap1 and Asxl2.
Bap1 overexpression in the liver slightly enhances gluconeogenesis, possibly by stabilizing Pgc1α (Ruan et al., 2012). We found that Bap1 deletion significantly reduced Pgc1α mRNA, adding a new layer of regulation. However, unlike Pgc1α-null animals, Bap1ko mice are hypoglycemic in the fed state, not just during fasting, and display significantly increased serum cholesterol, liver hypolipidemia, and pancreatic abnormalities (Lin et al., 2004). Also, in contrast to Bap1ko mice, mice with reduced Pgc1α expression specifically in liver exhibit higher hepatic lipid content after fasting (Estall et al., 2009). Diminished Pgc1α signaling likely contributes to some of the observed phenotypes in Bap1ko mice, but Bap1 likely modulates metabolism by additional means. In accord with this hypothesis, Bap1 deletion significantly increases ubiquitination on multiple H2A isoforms and mitochondrial proteins in the liver. One H2A variant exhibiting increased ubiquitination, H2AY (also known as macro-H2A), influences gene expression of Fabp1 and Hmgcr in cultured hepatocytes (Pazienza et al., 2014). Deleting the H2AY in mice partially protects against high fat feeding and epigenetically activates the promoters of lipogenic genes (Pehrson et al., 2014; Podrini et al., 2015).
Bap1 loss caused progressive damage to hepatocytes and acinar cells. Mouse models of liver damage including hepatectomy, drug induced hepatotoxicity, and acute infections, can trigger hypoglycemia and hypercholesterolemia similarly to Bap1 loss(Delgado-Coello et al., 2011; Inoue et al., 2004; Khovidhunkit, 2004). However, hypoglycemia presented within days of Bap1 deletion coincident with only modest increases in liver damage markers and prior to observable liver tissue pathology. Moreover, liver-specific Bap1ko mice display fully penetrant metabolic defects in the absence of tissue damage. These results suggest a direct role for Bap1 in regulating metabolic homeostasis.
NeuCode lysine isotopologue labeling kinetics
Importantly, this work highlights the utility of 4-plex NeuCode labeling in mammals. Key to this approach, the NeuCode lysine isotopologues incorporate at similar rates and enable quantitation in fast-incorporating tissues after only ten days of labeling. This reduced label consumption (>10-fold) in combination with commercialization of isotopologue reagents will facilitate routine application of NeuCode SILAM. Alternatives to NeuCode, including multiplexed SILAM with lysine isotopes with different masses (e.g., K002, K040, K600) may share this benefit, but overlapping isotopic clusters and spectral complexity would likely present major obstacles. Increasing NeuCode plexing can also present analytical challenges. For example, ~10–15% fewer peptides were quantified in 4-plex compared to 2-plex NeuCode analyses. This reduction is mainly due to spreading of quantitative signal across 4 channels, such that some peptides fall below the required signal-to-noise threshold. And like isobaric tagging, SILAM is more costly than utilizing label-free methods. Looking forward, NeuCode is suitable for studying protein turnover in vivo by pulse chase and key lysine post-translational modifications (PTM) such as ubiquitination. Moreover, NeuCode SILAM may be expanded to 6-plex using newly synthesized lysine isotopologues (K422, K341) that are available but not used in this study (Merrill et al., 2014). In summary, we use NeuCode proteomics in vivo to decipher roles of the tumor suppressor Bap1 in maintaining metabolic homeostasis. Given the multifaceted links between metabolism and cancer, this study opens avenues for exploring crosstalk between the tumor suppressor and metabolic regulatory roles of Bap1.
Experimental Procedures
Mice and labeling
Male C57BL/6J mice (Jackson Labs) were used for labeling efficiency studies. Floxed Bap1 mice (Bap1fl/fl;Rosa26.creERT2+) were generated and Bap1 deleted with tamoxifen as previously described (Dey et al, 2012). The liver specific deletion of BAP1 was generated by crossing Bap1fl/fl mice to the Alfp.cre strain. For NeuCode labeling, mice were fed a customized lysine-free diet (Harlan, Madison, WI) combined with 1% K602, K521, K440, or K080 (Cambridge Isotope Laboratories) for indicated times. To reconstitute bone marrow, donor cells from Bap1wt/wt animals were injected into the tail vein of irradiated recipients (Bap1fl/fl;Rosa26.creERT2+ or Bap1wt/wt;Rosa26.creERT2+). Reconstituted mice were given 0.11 mg/mL polymyxin B and 1.1 mg/mL neomycin water for two weeks. The Genentech Institutional Animal Care and Use Committee approved these protocols.
Protein preparation
Cleared protein lysate from homogenized NeuCode-labeled tissue samples were mixed in equal amounts to provide two samples (4-plex and 2-plex) per tissue. Mixed samples were reduced, alkylated, digested with either LysC or trypsin, and desalted according to Supplemental Experimental Procedures. Peptides were fractionated at high pH across a Gemini C18 reversed phase column and pooled into 16 samples which were dried for LC-MS/MS analysis.
Mass spectrometry
Online reverse-phase chromatography was performed using a nanoAcquity UPLC (Waters) or Easy-nanoLC 1000 (Thermo). Peptides were eluted over a 70 min gradient on a Waters analytical column (75 μm ID, 60°C, 30 cm, 130 Å pore size, Bridged Ethylene Hybrid C18 particles) with mobile phase A: 0.2% formic acid/5% DMSO and Mobile phase B: acetonitrile/0.2% formic acid. Eluted peptides were analyzed on a Thermo Orbitrap Elite mass spectrometer. A survey scan was performed at 30,000 resolving power to identify precursors to sample for data-dependent, top 20 MS/MS. A 480,000 resolving power scan immediately followed and was performed simultaneously with MS/MS scans. MS1 and MS/MS target-ion accumulation values were set to 1E6 and 5E3, respectively. Dynamic exclusion was set to 45 s for −25 ppm and +15 ppm around the selected precursor. Label-free proteomics of neonate liver samples are described in the Supplemental Experimental Procedures.
Data processing
Data reduction and searching of Neucode data was performed with COMPASS as detailed in the extended experimental methods (Wenger et al., 2011). Peptides were quantified using NeuQuant, as described (Merrill et al., 2014). Quantified peptides were grouped into proteins using Protein Hoarder and Procyon modules in COMPASS. Unique protein groups were mean-normalized, log2 transformed, before calculating ratios and p-values. Proteins that were quantified in all six mice (3 KO, 3 WT) with greater than 1.5-fold change (2-fold for spleen) and a nominal p <0.05 (Huang et al., 2009) were input for protein set enrichment analysis by DAVID (Huang et al., 2009).
Ubiquitination analysis
Sample preparation, immuno-affinity enrichment mass spectrometry and data analysis of diglycine-(K-GG) containing peptides was performed using 60mg total liver protein (4-plex: 4 × 15mg, 2-plex: 2 × 30mg) as previously described, (Bingol et al., 2014) with minor modifications. Namely, paired MS1 scans, at a 480,000 and 30,000 resolution were collected in each duty cycle. For searching a variable mass on lysines of +8.0322 Da to account for NeuCode labeling. Search data was analyzed as above using NeuQuant.
Statistical Analyses
Mean values measured from animal groups were compared using unpaired two-way student’s T-tests for all metabolic, proteomic, and qPCR mRNA measurements. NeuCode proteomic data was analyzed at the protein-level using T-test nominal p-values and corrected by Benjamini-Hochberg for multiple hypothesis testing where indicated.
Serum chemistry, histology and immunohistochemistry
Blood was obtained from the retro-orbital sinus under anesthesia and collected in tubes containing K3-EDTA (hematology samples) or no additive and spun to collect serum (clinical chemistry samples). Standard clinical pathology measurements are described in the Supplemental Experimental Procedures. Fed glucose was measured in the morning and fasted glucose after 16hr overnight fast, unless otherwise specified. For glucose and pyruvate tolerance tests, mice were fasted for ~6hr and ~16hr, respectively. Pancreas and liver tissue samples were formalin-fixed, paraffin embedded, sectioned at 4μm, and routinely stained with hematoxylin and eosin for histopathology. Additional sections of liver were OCT embedded and frozen at the time of necropsy for oil red O staining. Antibodies used were Dako polyclonal guinea pig anti-insulin, Cell Signaling Technologies cleaved caspase 3 at 0.06μg/ml concentration. Primary antibodies were detected with biotinylated goat anti-rabbit antibodies (Vector Laboratories, Burlingame, CA) and the reaction was visualized with DAB Map detection kit (Ventana). Slides were counterstained with hematoxylin. Tissues were evaluated for glycogen using the Periodic Acid Schiff reaction.
Supplementary Material
HIGHLIGHTS.
NeuCode is an accurate, quantitative proteomics method reducing in vivo labeling time.
Bap1 deletion perturbs multiple metabolic pathways in pancreas and liver.
Histones and mitochondrial membrane proteins are hyperubiquitinated in Bap1-KO livers.
Liver-specific Bap1 KO mice are perinatal lethal with metabolic defects.
Acknowledgments
We thank C. Havnar, R. Arceo, and N. Majidy for histology support, S. Chan for immunohistochemistry, A. Martzall and L. Leong for clinical pathology, the Genentech necropsy team for support, A. Bruce for graphical support, as well as V. Dixit and M. Chaurushiya for discussions and reagents. We are grateful to Cambridge Isotope Laboratories for generating NeuCode isotopologues and preparing chow and to J. Flowers of Harlan Laboratories for advice in chow formulation. A.D. Attie is supported by NIH grants DK066369 and DK101573. JJC gratefully acknowledges NIH GM080148. C.M.R was funded by an NSF Graduate Research Fellowship and NIH traineeship (T32GM008505). A.E.M. was supported by an NIH traineeship, the Genomic Sciences Training Program (5T32HG002760). A.E.M. and T.W.R., received support from NIH post-doctoral traineeship (5T15LM007359). E.M.W. was funded by NIH pre-doctoral traineeship (T32HL007899). J.W., R.A., M.D., J.Z.S., M.R., D.S.K. and A.D. are all current employees of Genentech and shareholders in Roche.
Footnotes
Author Contributions
J.M.B., C.M.R., T.W.R., A.S.H., J.J.C., D.S.K. and A.D. wrote the manuscript.
G.K., J.W., T.W.R., A.S.H., M.S.W., M.P.K., and A.D.A. edited the manuscript.
J.M.B., C.M.R., T.W.R., A.S.H., J.J.C., D.S.K., and A.D. designed experiments.
A.S.H., M.S.W., M.P.K., A.D.A., J.J.C., D.S.K. and A.D. oversaw experiments and interpreted data.
A.S.H. and J.J.C. conceptualized NeuCode SILAM labeling.
J.M.B., C.M.R., E.M.W., T.W.R., and A.S.H. prepared samples for mass spectrometry analysis.
J.M.B., C.M.R. and E.M.W. performed mass spectrometry analysis.
J.M.B., C.M.R., E.M.W., and A.E.M. analyzed mass spectrometry data.
D.S.S., M.E.R., K.L.S., R.A., M.R and M.D maintained mouse colony.
D.S.S. and M.E.R. isolated islet cells for labeling study.
G.K., J.Z.S, J.L., J.D.V., R.N. and A.D conducted mouse experiments
J.W., and P.K. analyzed pathology and serum chemistry data
Publisher's Disclaimer: This is a PDF file of an unedited manuscript that has been accepted for publication. As a service to our customers we are providing this early version of the manuscript. The manuscript will undergo copyediting, typesetting, and review of the resulting proof before it is published in its final citable form. Please note that during the production process errors may be discovered which could affect the content, and all legal disclaimers that apply to the journal pertain.
References
- Bechmann LP, Hannivoort Ra, Gerken G, Hotamisligil GS, Trauner M, Canbay A. The interaction of hepatic lipid and glucose metabolism in liver diseases. J Hepatol. 2012;56:952–964. doi: 10.1016/j.jhep.2011.08.025. [DOI] [PubMed] [Google Scholar]
- Bingol B, Tea JS, Phu L, Reichelt M, Bakalarski CE, Song Q, Foreman O, Kirkpatrick DS, Sheng M. The mitochondrial deubiquitinase USP30 opposes parkin-mediated mitophagy. Nature. 2014;510:370–375. doi: 10.1038/nature13418. [DOI] [PubMed] [Google Scholar]
- Bruce JE, Anderson Ga, Lin CY, Gorshkov M, Rockwood AL, Smith RD. A novel high-performance Fourier transform ion cyclotron resonance cell for improved biopolymer characterization. J Mass Spectrom. 2000;35:85–94. doi: 10.1002/(SICI)1096-9888(200001)35:1<85::AID-JMS910>3.0.CO;2-7. [DOI] [PubMed] [Google Scholar]
- Cao J, Yan Q. Histone Ubiquitination and Deubiquitination in Transcription, DNA Damage Response, and Cancer. Front Oncol. 2012;2:1–9. doi: 10.3389/fonc.2012.00026. [DOI] [PMC free article] [PubMed] [Google Scholar]
- Carbone M, Yang H, Pass HI, Krausz T, Testa JR, Gaudino G. BAP1 and cancer. Nat Rev Cancer. 2013;13:153–159. doi: 10.1038/nrc3459. [DOI] [PMC free article] [PubMed] [Google Scholar]
- Carro MS, Lim WK, Alvarez MJ, Bollo RJ, Zhao X, Snyder EY, Sulman EP, Anne SL, Doetsch F, Colman H, et al. The transcriptional network for mesenchymal transformation of brain tumours. Nature. 2010;463:318–325. doi: 10.1038/nature08712. [DOI] [PMC free article] [PubMed] [Google Scholar]
- Cheon DJ, Orsulic S. Mouse models of cancer. Annu Rev Pathol. 2011;6:95–119. doi: 10.1146/annurev.pathol.3.121806.154244. [DOI] [PubMed] [Google Scholar]
- Delgado-Coello B, Briones-Orta M, Macías-Silva M, Mas-Oliva J. Cholesterol: recapitulation of its active role during liver regeneration. Liver Int. 2011;31:1271–1284. doi: 10.1111/j.1478-3231.2011.02542.x. [DOI] [PubMed] [Google Scholar]
- Denisov E, Damoc E, Lange O, Makarov A. Orbitrap mass spectrometry with resolving powers above 1,000,000. Int J Mass Spectrom. 2012;325–327:80–85. [Google Scholar]
- Dey a, Seshasayee D, Noubade R, French DM, Liu J, Chaurushiya MS, Kirkpatrick DS, Pham VC, Lill JR, Bakalarski CE, et al. Loss of the Tumor Suppressor BAP1 Causes Myeloid Transformation. Science (80-) 2012;337:1541–1546. doi: 10.1126/science.1221711. [DOI] [PMC free article] [PubMed] [Google Scholar]
- Estall JL, Kahn M, Cooper MP, Fisher M, Wu MK, Laznik D, Qu L, Cohen DE, Shulman GI, Spiegelman BM. Sensitivity of Lipid Metabolism and Insulin Signaling to Genetic Alterations in Hepatic Peroxisome Coactivator-Proliferator Activated Receptor-gamma Cactivator-1a Expression. Diabetes. 2009;58:1499–1508. doi: 10.2337/db08-1571. [DOI] [PMC free article] [PubMed] [Google Scholar]
- Foran JM, Shammo JM. Clinical Presentation, Diagnosis, and Prognosis of Myelodysplastic Syndromes. Ajm. 2012;125:S6–S13. doi: 10.1016/j.amjmed.2012.04.015. [DOI] [PubMed] [Google Scholar]
- Geiger T, Velic A, Macek B, Lundberg E, Kampf C, Nagaraj N, Uhlen M, Cox J, Mann M. Initial quantitative proteomic map of 28 mouse tissues using the SILAC mouse. Mol Cell Proteomics. 2013;12:1709–1722. doi: 10.1074/mcp.M112.024919. [DOI] [PMC free article] [PubMed] [Google Scholar]
- Graf R, Schiesser M, Lüssi a, Went P, Scheele Ga, Bimmler D. Coordinate regulation of secretory stress proteins (PSP/reg, PAP I, PAP II, and PAP III) in the rat exocrine pancreas during experimental acute pancreatitis. J Surg Res. 2002;105:136–144. doi: 10.1006/jsre.2002.6387. [DOI] [PubMed] [Google Scholar]
- Grijalva J, Vakili K. Neonatal liver physiology. Semin Pediatr Surg. 2013;22:185–189. doi: 10.1053/j.sempedsurg.2013.10.006. [DOI] [PubMed] [Google Scholar]
- Gruys E, Toussaint MJM, Niewold Ta, Koopmans SJ. Acute phase reaction and acute phase proteins. J Zhejiang Univ Sci B. 2005;6:1045–1056. doi: 10.1631/jzus.2005.B1045. [DOI] [PMC free article] [PubMed] [Google Scholar]
- Hayashi Y, Hirai H, Kamio N, Yao H, Yoshioka S, Miura Y, Ashihara E, Fujiyama Y, Tenen DG, Maekawa T. C/EBPβ promotes BCR–ABL-mediated myeloid expansion and leukemic stem cell exhaustion. Leukemia. 2012:619–628. doi: 10.1038/leu.2012.258. [DOI] [PMC free article] [PubMed] [Google Scholar]
- Hebert AS, Merrill AE, Bailey DJ, Still AJ, Westphall MS, Strieter ER, Pagliarini DJ, Coon JJ. Neutron-encoded mass signatures for multiplexed proteome quantification. Nat Methods. 2013;10:332–334. doi: 10.1038/nmeth.2378. [DOI] [PMC free article] [PubMed] [Google Scholar]
- Huang DW, Sherman BT, Lempicki Ra. Systematic and integrative analysis of large gene lists using DAVID bioinformatics resources. Nat Protoc. 2009;4:44–57. doi: 10.1038/nprot.2008.211. [DOI] [PubMed] [Google Scholar]
- Inoue H, Ogawa W, Ozaki M, Haga S, Matsumoto M, Furukawa K, Hashimoto N, Kido Y, Mori T, Sakaue H, et al. Role of STAT-3 in regulation of hepatic gluconeogenic genes and carbohydrate metabolism in vivo. Nat Med. 2004;10:168–174. doi: 10.1038/nm980. [DOI] [PubMed] [Google Scholar]
- Iwata TN, Cowley TJ, Sloma M, Ji Y, Kim H, Qi L, Lee SS. The Transcriptional Co-Regulator HCF-1 Is Required for INS-1 β-cell Glucose-Stimulated Insulin Secretion. PLoS One. 2013;8:e78841. doi: 10.1371/journal.pone.0078841. [DOI] [PMC free article] [PubMed] [Google Scholar]
- Izawa T, Rohatgi N, Fukunaga T, Wang QT, Silva MJ, Gardner MJ, McDaniel ML, Abumrad NA, Semenkovich CF, Teitelbaum SL, et al. ASXL2 Regulates Glucose, Lipid, and Skeletal Homeostasis. Cell Rep. 2015;11:1625–1637. doi: 10.1016/j.celrep.2015.05.019. [DOI] [PMC free article] [PubMed] [Google Scholar]
- Kaiser NK, Quinn JP, Blakney GT, Hendrickson CL, Marshall AG. A novel 9.4 tesla FTICR mass spectrometer with improved sensitivity, mass resolution, and mass range. J Am Soc Mass Spectrom. 2011;22:1343–1351. doi: 10.1007/s13361-011-0141-9. [DOI] [PubMed] [Google Scholar]
- Katz JJ, Crespi HL, Czajka DM, Finkel aJ. Course of deuteriation and some physiological effects of deuterium in mice. Am J Physiol. 1962;203:907–913. doi: 10.1152/ajplegacy.1962.203.5.907. [DOI] [PubMed] [Google Scholar]
- Khovidhunkit W. Effects of infection and inflammation on lipid and lipoprotein metabolism: mechanisms and consequences to the host. J Lipid Res. 2004;45:1169–1196. doi: 10.1194/jlr.R300019-JLR200. [DOI] [PubMed] [Google Scholar]
- Kim W, Bennett EJ, Huttlin EL, Guo A, Li J, Possemato A, Sowa ME, Rad R, Rush J, Comb MJ, Harper JW, Gygi SP. Systematic and quantitative assessment of the ubiquitin-modified proteome. Mol Cell. 2011;44:325–40. doi: 10.1016/j.molcel.2011.08.025. [DOI] [PMC free article] [PubMed] [Google Scholar]
- Krüger M, Moser M, Ussar S, Thievessen I, Luber Ca, Forner F, Schmidt S, Zanivan S, Fässler R, Mann M. SILAC Mouse for Quantitative Proteomics Uncovers Kindlin-3 as an Essential Factor for Red Blood Cell Function. Cell. 2008;134:353–364. doi: 10.1016/j.cell.2008.05.033. [DOI] [PubMed] [Google Scholar]
- LaFave LM, Béguelin W, Koche R, Teater M, Spitzer B, Chramiec A, Papalexi E, Keller MD, Hricik T, Konstantinoff K, et al. Loss of BAP1 function leads to EZH2-dependent transformation. Nat Med. 2015:21. doi: 10.1038/nm.3947. [DOI] [PMC free article] [PubMed] [Google Scholar]
- Lattin JE, Schroder K, Su AI, Walker JR, Zhang J, Wiltshire T, Saijo K, Glass CK, Hume Da, Kellie S, et al. Expression analysis of G Protein-Coupled Receptors in mouse macrophages. Immunome Res. 2008;4:1–13. doi: 10.1186/1745-7580-4-5. [DOI] [PMC free article] [PubMed] [Google Scholar]
- Lawrence RT, Perez EM, Hernández D, Miller CP, Haas KM, Irie HY, Lee S-I, Blau CA, Villén J. The Proteomic Landscape of Triple-Negative Breast Cancer. Cell Rep. 2015:630–644. doi: 10.1016/j.celrep.2015.03.050. [DOI] [PMC free article] [PubMed] [Google Scholar]
- Lin J, Wu PH, Tarr PT, Lindenberg KS, St-Pierre J, Zhang CY, Mootha VK, Jäger S, Vianna CR, Reznick RM, et al. Defects in adaptive energy metabolism with CNS-linked hyperactivity in PGC-1α null mice. Cell. 2004;119:121–135. doi: 10.1016/j.cell.2004.09.013. [DOI] [PubMed] [Google Scholar]
- Ma J, Hart GW. Protein O-GlcNAcylation in diabetes and diabetic complications. Expert Rev Proteomics. 2013;10:365–380. doi: 10.1586/14789450.2013.820536. [DOI] [PMC free article] [PubMed] [Google Scholar]
- Machida YJ, Machida Y, Vashisht Aa, Wohlschlegel Ja, Dutta A. The deubiquitinating enzyme BAP1 regulates cell growth via interaction with HCF-1. J Biol Chem. 2009;284:34179–34188. doi: 10.1074/jbc.M109.046755. [DOI] [PMC free article] [PubMed] [Google Scholar]
- McClatchy DB, Yates JR. Stable isotope labeling of mammals (SILAM) Cold Spring Harb Protoc. 2008;3 doi: 10.1101/pdb.prot4940. [DOI] [PubMed] [Google Scholar]
- Merrill AE, Hebert AS, MacGilvray ME, Rose CM, Bailey DJ, Bradley JC, Wood WW, ElMasri M, Westphall MS, Gasch AP, et al. NeuCode labels for relative protein quantification. Mol Cell Proteomics. 2014:1–33. doi: 10.1074/mcp.M114.040287. [DOI] [PMC free article] [PubMed] [Google Scholar]
- Misaghi S, Ottosen S, Izrael-Tomasevic A, Arnott D, Lamkanfi M, Lee J, Liu J, O’Rourke K, Dixit VM, Wilson AC. Association of C-terminal ubiquitin hydrolase BRCA1-associated protein 1 with cell cycle regulator host cell factor 1. Mol Cell Biol. 2009;29:2181–2192. doi: 10.1128/MCB.01517-08. [DOI] [PMC free article] [PubMed] [Google Scholar]
- Narendra DP, Kane La, Hauser DN, Fearnley IM, Youle RJ. p62/SQSTM1 is required for Parkin-induced mitochondrial clustering but not mitophagy; VDAC1 is dispensable for both. Autophagy. 2010;6:1090–1106. doi: 10.4161/auto.6.8.13426. [DOI] [PMC free article] [PubMed] [Google Scholar]
- Newberry EP, Xie Y, Kennedy S, Han X, Buhman KK, Luo J, Gross RW, Davidson NO. Decreased Hepatic Triglyceride Accumulation and Altered Fatty Acid Uptake in Mice with Deletion of the Liver Fatty Acid-binding Protein Gene. J Biol Chem. 2003;278:51664–51672. doi: 10.1074/jbc.M309377200. [DOI] [PubMed] [Google Scholar]
- Park UH, Yoon SK, Park T, Kim EJ, Um SJ. Additional sex comb-like (ASXL) proteins 1 and 2 play opposite roles in adipogenesis via reciprocal regulation of peroxisome proliferator-activated receptor gamma. J Biol Chem. 2011;286:1354–1363. doi: 10.1074/jbc.M110.177816. [DOI] [PMC free article] [PubMed] [Google Scholar]
- Park UH, Seong MR, Kim EJ, Hur W, Kim SW, Yoon SK, Um SJ. Reciprocal regulation of LXRα activity by ASXL1 and ASXL2 in lipogenesis. Biochem Biophys Res Commun. 2014;443:489–494. doi: 10.1016/j.bbrc.2013.11.124. [DOI] [PubMed] [Google Scholar]
- Pazienza V, Borghesan M, Mazza T, Sheedfar F, Panebianco C, Williams R, Mazzoccoli G, Andriulli A, Nakanishi T, Vinciguerra M. SIRT1-metabolite binding histone macroH2A1.1 protects hepatocytes against lipid accumulation. Aging (Albany NY) 2014;6:35–47. doi: 10.18632/aging.100632. [DOI] [PMC free article] [PubMed] [Google Scholar]
- Pehrson JR, Changolkar LN, Costanzi C, Leu NA. Mice without macroH2A histone variants. Mol Cell Biol. 2014;34:4523–4533. doi: 10.1128/MCB.00794-14. [DOI] [PMC free article] [PubMed] [Google Scholar]
- Petersen OH. Specific mitochondrial functions in separate sub-cellular domains of pancreatic acinar cells. Pflugers Arch Eur J Physiol. 2012;464:77–87. doi: 10.1007/s00424-012-1099-6. [DOI] [PubMed] [Google Scholar]
- Piva R, Pellegrino E, Mattioli M, Agnelli L, Lombardi L, Boccalatte F, Costa G, Ruggeri Ba, Cheng M, Chiarle R, et al. Functional validation of the anaplastic lymphoma kinase signature identifies CEBPB and BCl2A1 as critical target genes. J Clin Invest. 2006;116:3171–3182. doi: 10.1172/JCI29401. [DOI] [PMC free article] [PubMed] [Google Scholar]
- Podrini C, Koffas a, Chokshi S, Vinciguerra M, Lelliott CJ, White JK, Adissu Ha, Williams R, Greco a. MacroH2A1 isoforms are associated with epigenetic markers for activation of lipogenic genes in fat-induced steatosis. FASEB J. 2015;29:1676–1687. doi: 10.1096/fj.14-262717. [DOI] [PubMed] [Google Scholar]
- Rayavarapu S, Coley W, Cakir E, Jahnke V, Takeda S, Aoki Y, Grodish-Dressman H, Jaiswal JK, Hoffman EP, Brown KJ, et al. Identification of disease specific pathways using in vivo SILAC proteomics in dystrophin deficient mdx mouse. Mol Cell Proteomics. 2013;12:1061–1073. doi: 10.1074/mcp.M112.023127. [DOI] [PMC free article] [PubMed] [Google Scholar]
- Rhoads TW, Rose CM, Bailey DJ, Riley NM, Molden RC, Nestler AJ, Merrill AE, Smith LM, Hebert AS, Westphall MS, et al. Neutron-encoded mass signatures for quantitative top-down proteomics. Anal Chem. 2014;86:2314–2319. doi: 10.1021/ac403579s. [DOI] [PMC free article] [PubMed] [Google Scholar]
- Rose CM, Merrill AE, Bailey DJ, Hebert AS, Westphall MS, Coon JJ. Neutron encoded labeling for peptide identification. Anal Chem. 2013;85:5129–5137. doi: 10.1021/ac400476w. [DOI] [PMC free article] [PubMed] [Google Scholar]
- Ruan H Bin, Han X, Li MD, Singh JP, Qian K, Azarhoush S, Zhao L, Bennett AM, Samuel VT, Wu J, et al. O-GlcNAc transferase/host cell factor C1 complex regulates gluconeogenesis by modulating PGC-1-alpha stability. Cell Metab. 2012;16:226–237. doi: 10.1016/j.cmet.2012.07.006. [DOI] [PMC free article] [PubMed] [Google Scholar]
- Schalken Ja, Debruyne FM, Ruiter DJ, Gage WR, Nelson WG, De Marzo aM, Epstein JI. References and Notes 1. Science (80-) 2010;329:571–575. [Google Scholar]
- Scheuermann JC, de Ayala Alonso AG, Oktaba K, Ly-Hartig N, McGinty RK, Fraterman S, Wilm M, Muir TW, Müller J. Histone H2A deubiquitinase activity of the Polycomb repressive complex PR-DUB. Nature. 2010;465:243–247. doi: 10.1038/nature08966. [DOI] [PMC free article] [PubMed] [Google Scholar]
- Spellman DS, Deinhardt K, Darie CC, Chao MV, Neubert Ta. Stable isotopic labeling by amino acids in cultured primary neurons: application to brain-derived neurotrophic factor-dependent phosphotyrosine-associated signaling. Mol Cell Proteomics. 2008;7:1067–1076. doi: 10.1074/mcp.M700387-MCP200. [DOI] [PMC free article] [PubMed] [Google Scholar]
- Syka JEP, Marto JA, Bai DL, Horning S, Senko MW, Schwartz JC, Ueberheide B, Garcia B, Busby S, Muratore T, et al. Novel linear quadrupole ion trap/FT mass spectrometer: Performance characterization and use in the comparative analysis of histone H3 post-translational modifications. J Proteome Res. 2004;3:621–626. doi: 10.1021/pr0499794. [DOI] [PubMed] [Google Scholar]
- Testa JR, Cheung M, Pei J, Below JE, Tan Y, Sementino E, Cox NJ, Dogan aU, Pass HI, Trusa S, et al. Germline BAP1 mutations predispose to malignant mesothelioma. Nat Genet. 2011;43:1022–1025. doi: 10.1038/ng.912. [DOI] [PMC free article] [PubMed] [Google Scholar]
- Vercauteren K, Gleyzer N, Scarpulla RC. PGC-1-related coactivator complexes with HCF-1 and NRF-2β in mediating NRF-2(GABP)-dependent respiratory gene expression. J Biol Chem. 2008;283:12102–12111. doi: 10.1074/jbc.M710150200. [DOI] [PMC free article] [PubMed] [Google Scholar]
- Wang C, Zhao Y, Gao X, Li L, Yuan Y, Liu F, Zhang L, Wu J, Hu P, Zhang X, et al. Perilipin 5 improves hepatic lipotoxicity by inhibiting lipolysis. Hepatology. 2015;61:870–882. doi: 10.1002/hep.27409. [DOI] [PubMed] [Google Scholar]
- Wenger CD, Phanstiel DH, Lee MV, Bailey DJ, Coon JJ. COMPASS: a suite of pre- and post-search proteomics software tools for OMSSA. Proteomics. 2011;11:1064–1074. doi: 10.1002/pmic.201000616. [DOI] [PMC free article] [PubMed] [Google Scholar]
- Wiesner T, Obenauf a, Murali R, Fried I, Griewank K, Ulz P, Windpassinger C, Loy S, Wackernagel W, Wolf I, et al. Abstract LB-125: Germline mutations in BAP1 predispose to melanocytic nevi and melanoma. Cancer Res. 2011;71:LB – 125–LB – 125. doi: 10.1038/ng.910. [DOI] [PMC free article] [PubMed] [Google Scholar]
- Wu CC, MacCoss MJ, Howell KE, Matthews DE, Yates JR. Metabolic labeling of mammalian organisms with stable isotopes for quantitative proteomic analysis. Anal Chem. 2004;76:4951–4959. doi: 10.1021/ac049208j. [DOI] [PubMed] [Google Scholar]
- Yu H, Mashtalir N, Daou S, Hammond-Martel I, Ross J, Sui G, Hart GW, Rauscher FJ, Drobetsky E, Milot E, et al. The ubiquitin carboxyl hydrolase BAP1 forms a ternary complex with YY1 and HCF-1 and is a critical regulator of gene expression. Mol Cell Biol. 2010;30:5071–5085. doi: 10.1128/MCB.00396-10. [DOI] [PMC free article] [PubMed] [Google Scholar]
- Zanivan S, Krueger M, Mann M. In vivo quantitative proteomics: The SILAC mouse. Methods Mol Biol. 2011;757:435–450. doi: 10.1007/978-1-61779-166-6_25. [DOI] [PubMed] [Google Scholar]
- Zanivan S, Meves A, Behrendt K, Schoof EM, Neilson LJ, Cox J, Tang HR, Kalna G, van Ree JH, van Deursen JM, et al. In Vivo SILAC-Based Proteomics Reveals Phosphoproteome Changes during Mouse Skin Carcinogenesis. Cell Rep. 2013;3:552–566. doi: 10.1016/j.celrep.2013.01.003. [DOI] [PubMed] [Google Scholar]
Associated Data
This section collects any data citations, data availability statements, or supplementary materials included in this article.