

Abstract
Background
Studies on ragweed and birch pollen extracts suggested that the adenosine content is an important factor in allergic sensitization. However, exposure levels from other pollens and considerations of geographic and seasonal factors have not been evaluated.
Objective
This study compared the metabolite profile of pollen species important for allergic disease, specifically measured the adenosine content, and evaluated exposure to pollen-derived adenosine.
Methods
An NMR metabolomics approach was used to measure metabolite concentrations in twenty-six pollen extracts. Pollen count data was analyzed from five cities to model exposure.
Results
A principal component analysis of the various metabolites identified by NMR showed that pollen extracts could be differentiated primarily by sugar content: glucose, fructose, sucrose, and myo-inositol. In extracts of 10 mg of pollen/ml, the adenosine was highest for grasses (45 μM) followed by trees (23 μM) and weeds (19 μM). Pollen count data showed that tree pollen was typically 5–10 times the amount of other pollens. At the daily peaks of tree, grass, and weed season the pollen-derived adenosine exposure per day is likely to only be 1.1, 0.11, and 0.12 μg, respectively. Seasonal models of pollen exposure and respiration suggest that it would be a rare event limited to tree pollen season for concentrations of pollen-derived adenosine to approach physiological levels.
Conclusions
Sugar content and other metabolites may be useful in classifying pollens. Unless other factors create localized exposures that are very different from these models, pollen-derived adenosine is unlikely to be a major factor in allergic sensitization.
Introduction
Recent studies in the United States show that allergic sensitization rates to pollens vary from 10–20%.(Salo et al. 2014) Among the major sources of allergen for adults, IgE antibodies to rye grass allergens are the most prevalent (~20%), followed by ragweed and bermuda grass (~15%), and finally oak, thistle and birch (~10%). It is fascinating to consider that while trees produce the greatest pollen load, the prevalence of allergic disease is the lowest. The symptomatic response is directed against the allergens but understanding the other factors that initiate allergic sensitization is a major area of research. For example, the low molecular weight components of aqueous pollen extracts were shown to alter bronchial epithelial barrier function in a cell model.(Blume et al. 2015) Pollen-associated lipid mediators (PALMs) have been extensively studied for their ability to recruit inflammatory cells and skew the immune response towards allergy.(Behrendt et al. 2001; Plotz et al. 2004) These PALM compounds elute from pollen grains and contribute to a Th2 response.(Mariani et al. 2007; Gilles et al. 2009)
A recent study on the birch pollen metabolome identified pollen-derived adenosine as another contributor to allergic sensitization.(Gilles et al. 2011) These studies showed that birch pollen extract activated cAMP in dendritic cells through the adenosine mediated A2 receptor, but failed to do so when the extract was treated with adenosine deaminase. Similarly, in studies of animals sensitized with ragweed extract the recruitment of eosinophils and airway resistance upon challenge depended on whether or not the extract was depleted of adenosine.(Wimmer et al. 2015) Elevated adenosine signaling can provide a protective effect in response to acute stress or injury, however, prolonged excessive adenosine signaling is detrimental and contributes to the development and progression of certain chronic disease states (Liu and Xia 2015), including Parkinson’s disease (Jenner et al. 2009), pre-eclampsia (Iriyama et al. 2015) and sickle cell anemia (Zhang et al. 2011).
Although these studies provide strong support for the conclusion that adenosine can play an important role in the allergic response, it is less clear whether the adenosine content of pollen is sufficient to contribute significantly to the physiological response. An estimate that pollen-derived adenosine could accumulate in the nasal fluid to 500 nM was determined.(Gilles et al. 2011) However, this appears to be below the amount needed to demonstrate an effect in the dendritic cells, and significant details of the exposure model were not presented. For comparison, the levels of adenosine in human plasma are typically measured at less than 200 nM, but can be in excess of 500 nM in people with sickle cell disease.(Ramakers et al. 2008; Zhang et al. 2011) Airway surface liquid is normally 150–200 nM adenosine (Zuo et al. 2008) although recent evidence suggests that at the cell surface, where many of the regulatory enzymes and receptors are positioned, the concentration may be 5 to 10 times higher (Amarante et al. 2014).
Two key points needed to evaluate the importance of adenosine would seem to be accurate measurements of the adenosine content in various pollens, and an evaluation of human exposure models. The amount of adenosine that was measured in 10 mg of pollen/ml birch, ragweed, and timothy grass pollen extract was typically in the low micromolar range.(Gilles et al. 2011) This is a reasonable range for metabolomic characterization by NMR. Since numerous other compounds present can be measured simultaneously by NMR, it was apparent that other compounds could be quantified for rapid comparisons of the metabolites from various pollens. This may be useful in generating metabolic fingerprints to identify pollens or in assessing other compounds as potentially allergenic factors. Twenty-six pollens were chosen from major families of allergens. The three major goals of this study were to compare the metabolomes of aqueous pollen extracts, specifically measure the adenosine content, and then to further evaluate the human exposure to pollen-derived adenosine. The last goal was accomplished by extrapolating human pollen exposure from pollen count data from various cities across the United States.
Methods
Twenty-six species of pollen from major sources of airborne allergens in North America were purchased from Greer Laboratories, Lenoir, NC. Supplementary Table 1 lists the pollens with a two-letter code, scientific name, and common name for each that will be used in figure legends throughout this article. Pollen extracts were prepared by standard methods as described in the Supplemental Material. NMR NOESY experiments were performed on a 14.7 T magnet and analyzed with Chenomx NMR Profiler software (Version 8.2, Edmonton, AB, Canada) for metabolite concentrations. Pollen count data was obtained from public government resources or kindly provided as described in the Supplemental Material.
Results
Aqueous pollen metabolomics
Aqueous pollen extracts were prepared from seven grasses, three weeds, and twelve species of trees from a variety of biomes in North America. Figure 1 shows four example NMR spectra from Birch, Cypress, Ragweed, and Timothy pollen, as representatives of the tree, the western pine (Cupressaceae), weed, and grass spectra, respectively. The spectra were usually dominated by carbohydrates that were the most abundant compounds identified, as can been seen in the crowded spectral region from 4.2–3.2 ppm. The exceptions were the western pines (Cupressaceae) Cupressus arizonica (Figure 1B) and Juniperus ashei (data not shown) that contained many fewer compounds in the extract and in fact the largest peaks were due to glycerol. There is strong evidence for endogenous glycerol in the aqueous extracts, but due to contamination with exogenous glycerol from the concentrators and filters it was not analyzed further. A few of the isolated peaks for sucrose, glucose, and fructose that were used for fitting the concentrations are annotated in Figure 1. The differences in these four spectra are primarily due to the different combinations of carbohydrates present in the different species (Figure 2). Another very strong resonance was due to betaine at 3.3 ppm, as annotated in figure 1, which was confirmed by the corresponding weaker resonance at 3.9 ppm. Betaine was found prominently in the weeds, grasses, and red maple, but usually an order of magnitude less in other pollens (Supplementary Figure 1). Betaine is an organic osmolyte and its presence in pollen is likely protective against desiccation.
Figure 1.
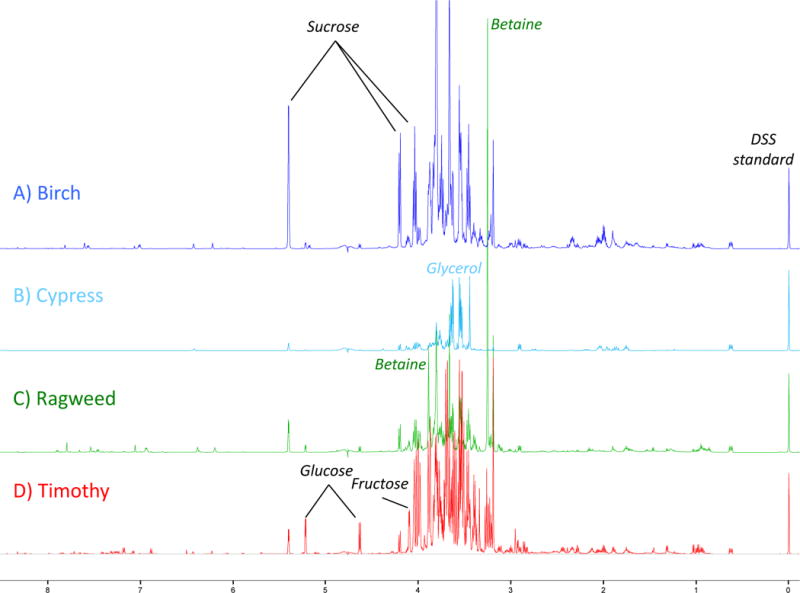
Example NMR spectra of pollen extracts A) Birch, Betula pendula, representative of tree pollen extracts with the exception of B) Cypress, Cupresus arizonica representative of the Cupressaceae family of trees. C) Ragweed, Ambrosia artemisifolia similar to other weeds, and D) Timothy grass, Pheleum pretense, typical of other grasses. Isolated peaks of important compounds discussed in the text are annotated. DSS was added to all samples for standardization.
Figure 2.
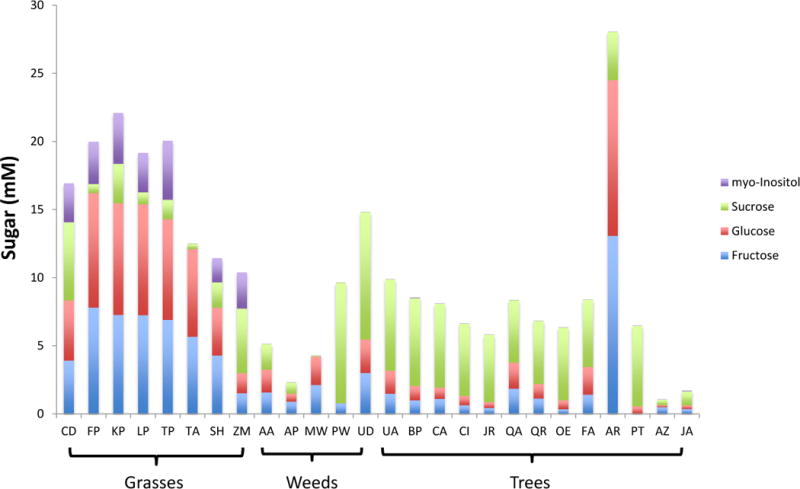
Sugar content in the various pollens. A stacked bar graph presents the amount of myo-inositol (purple), sucrose (green), glucose (red), and fructose (blue) measured in the pollen extracts. The abbreviations for the species names are shown in Supplementary Table 1.
The concentrations of the carbohydrates and other metabolites present in the different pollens were measured by fitting the peaks with the Chenomx software. Figure 2 shows a bar graph of carbohydrate content in each pollen extract. The grass pollens contain myo-inositol, while the grasses and red maple pollen contain considerably more glucose than the other species. Red maple pollen (AR) contained the most total sugar, while the Cupressaceae (JA and AZ) were nearly devoid of extracted sugars. Besides the carbohydrates, Supplementary Table 2 shows all the metabolites that were identified and concentrations determined relative to the DSS standard by Chenomx for all five samples of each pollen. Comparisons of the measured concentrations of a few other specific compounds (betaine, arginine, methanol, and proline) in the pollen are shown in Supplemental Figure 1.
Principal Component Analysis of Metabolites
A principal component analysis (PCA) of the 52 identified compound concentrations confirms the initial assertion above that the carbohydrates primarily differentiate the various pollen extracts. Figure 3A plots the first two principal components, which reasonably differentiate the various pollen extracts. Principal component 1 accounts for 69% of the variance and component 2 accounts for 18% of the variance. The western pines with the low sugar content are farthest from the red maple, and the weeds are closer to the main tree group since their combination of sugars more closely resembles that group as shown in Figure 2. Figure 3B shows the loadings plots for the first two principal components, which shows which compounds were most important for differentiating the pollen extracts in Figure 3A. The sucrose component clearly dominates the second component (y-axis), and is orthorgonal to the fructose and glucose, which dominate the first component (x-axis).
Figure 3.
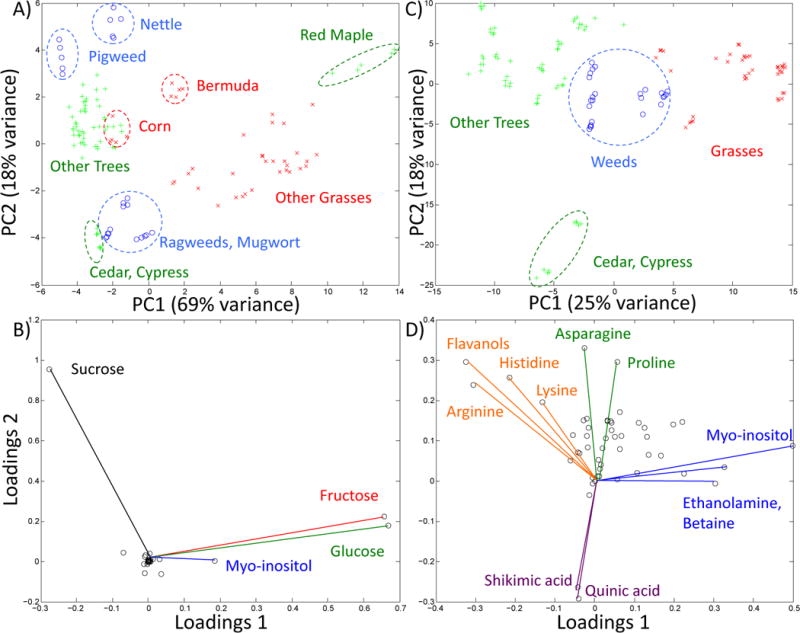
Principal component analysis of pollen extracts. A) Principal components 1 and 2 utilizing the quantity of all 52 metabolites from 26 pollens, 5 preparations per species: grasses (red x), weeds (blue o), and trees (green +). Dashed circles and names annotate the various clusters. B) Loading plot for principal components 1 and 2 of panel A. Important compounds are labeled. C) Principal components 1 and 2 using a log2 transform of metabolite concentrations (see text). D) Loading plot for principal components 1 and 2 of panel C. Important compounds are labeled.
Since the high abundance metabolites appeared to dominate the evaluations in Figures 3A and 3B, a second multivariate analysis was performed to look for more subtle metabolite differences using a log base 2 transform of all the concentrations. As can be seen in the PCA plot in Figure 3C this analysis gives a very clean separation of the trees, grasses, and weeds. The loadings plot in Figure 3D reports the metabolites most responsible for the separation. The trees contain higher levels of certain amino acids and flavonols, while the grasses are higher in methanol, betaine, and myo-inositol. The Cupressaceae can be easily identified by the presense of quinic and shikimic acids. Also of note, the vector labeled Flavanol, and the data in Supplementary Table 2, refers to an unknown flavanol compound that resembled quercitin, but the shifts were outside of the tolerance limits for quercitin, and were variable in the different pollens. This data should be regarded as an approximate measure of the most abundant flavanol in the pollens where it is noted. Given the interest in adenosine, the data was examined for other common metabolites in which the concentrations were correlated. Among metabolites that occurred in at least half the pollen extracts, adenosine most strongly correlated with methanol and choline (r=0.55–56). Using the log2 transform of the concentrations, adenosine again correlated strongly with choline (r=0.69) (See supplemental Figure 2)
Adenosine measurements
Supplementary Figure 3 shows two selected downfield regions of the spectra that contain peaks corresponding to adenosine. Of note, the downfield region of the spectra was especially sparse in the Cupressaceae, with the exception of the shikimate peak, that was confirmed by the presence of the corresponding upfield peaks centered at 4.4, 2.8, 2.7, and 2.2 ppm (data not shown). Figure 4 presents a bar graph of the adenosine concentrations for each pollen extract. Adenosine was barely detectable in the loblolly pine (4.7 μM) and not detected in the western pines, nor the nettle, Urtica dioica. The highest concentrations of adenosine (~ 45 μM) were in the grass and elm pollen extract. Where it was detectable, adenosine ranged roughly an order of magnitude from 5–56 μM. The average adenosine concentration was highest for grasses (45 μM) followed by trees (23 μM) and weeds (19 μM).
Figure 4.
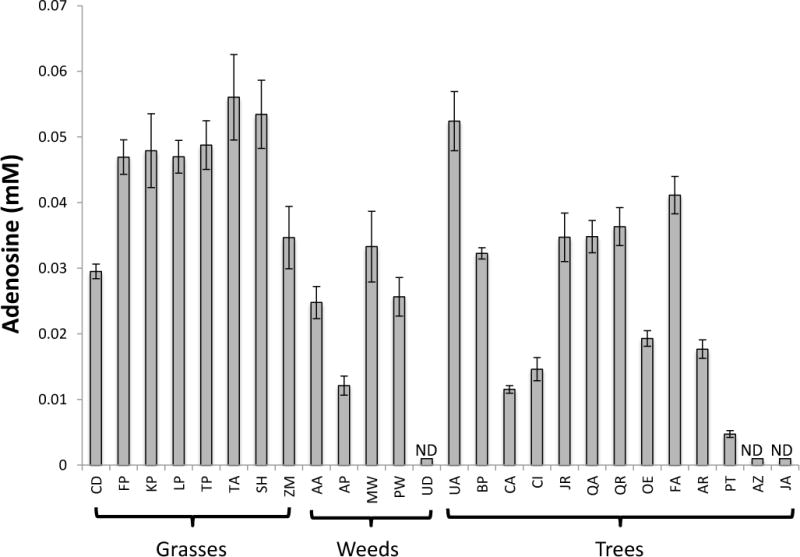
Adenosine concentration in the pollen extracts. ND refers to samples where adenosine was Not Detected. The abbreviations for the species names are shown in Supplementary Table 1.
Example Seasonal and Geographical Pollen Load
To provide perspective on pollen exposure from different geographic locales and seasonal variations, pollen data was acquired from publicly available sources or kindly provided for the following five cities: Raleigh, NC, Dayton, OH, Minneapolis, MN, Springfield MO, and Houston TX. The data was divided into tree, grass, and weed pollen. Figure 5 overlays the pollen levels on a log scale for three recent years as a scatter plot, since continuous data was not available in all locales for all days. The years were 2012–2014, for Raleigh and Houston, while the other three were 2013–2015. The plots show the relative contribution of the tree, grass, and weed pollens over the course of the year. The peak levels of tree pollen grains in the spring are typically an order of magnitude greater than the peak levels of weed pollen in the fall. Peak levels of grass pollen are typically 100 times less than the peak levels of tree pollen, although in Springfield and Houston, the grass season can peak at 10 fold less than that of the tree pollen. In summary, the peak of tree season contributes the highest pollen load. For modeling the maximum adenosine exposure, the peak days for each season are modeled as 103, 103, and 104 grains/m3 for grasses, weeds, and trees respectively.
Figure 5.
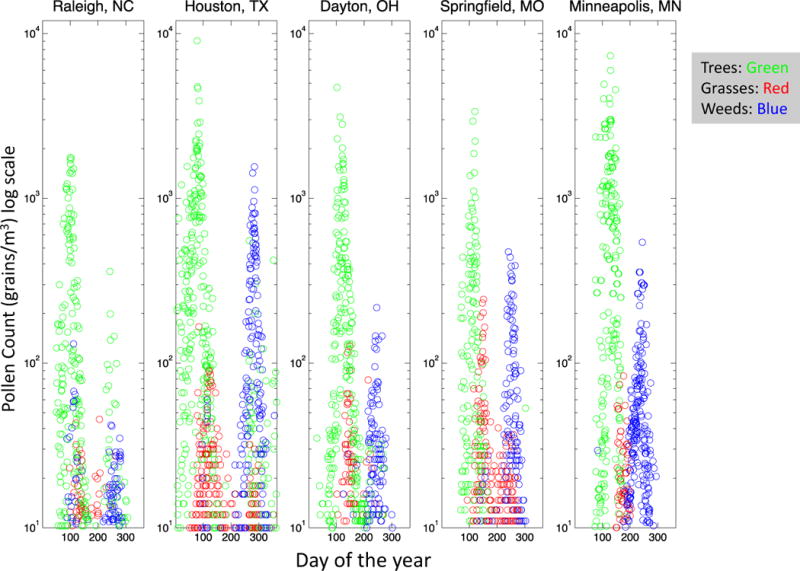
Pollen counts for various North American Cities over a recent 3 year period. Pollen count data in grains/m3 is overlayed for 3 consecutive recent years. See text for details. Count data is colored red for grasses, blue for weeds, and green for trees.
Modeling Pollen-derived Adenosine Exposure
Studies with personal air samplers have provided evidence that the background pollen count is a reasonable proxy for personal exposure.(Peel et al. 2013) Pollen counts measure the grains/m3, while the adenosine concentration measured here can be easily converted to grams of adensosine/gram of pollen. Therefore a conversion of grams per grain of pollen is needed. Supplementary Figure 4 shows the data from many grass, weed, and tree pollens.(Brown and Irving 1973) A similar range of values is reported in other studies.(Gunawan et al. 2008) Most pollens are approximately 100 grains per microgram, with a few notable exceptions. Nettle pollen is 10 fold less dense, but this should not affect the adenosine modeling since there was no detectable levels of adenosine in Urtica dioica. At the other extreme, corn pollen is more than ten times denser.(Porter 1981) This however is also likely not to be problematic for general exposure calculations since denser pollen will fall out of the air faster reducing human exposure. Eliminating the extreme values of nettle and corn, the mean values from Brown and Irving utilized in this model are 1 grain = 12 × 10−9, 6 × 10⁻⁹, and 16 × 10−9 grams for trees, grasses, and weeds, respectively.
Three models for personal exposure were created, detailed in Supplementary Table 3. The first is a daily dose (DD) that uses the pollen count from the peak day of each class (above) and assumes a breathing rate of 10 liters per minutes, which converts to 14.4 m3/day. The second model is the peak 2-hour (P2) exposure that assumes the same breathing rate. However, pollen is not released continuously and the peak hours are 4–10 times the daily reported average.(Barnes et al. 2001; Davies 1985; Skjoth et al. 2008). The P2 model uses a factor of 10 to exaggerate the effect. For comparison, environmental exposure units generally target 3.5 × 10³ grains/m3 for grass and weed pollens, (Ellis et al. 2015; Ellis et al. 2013) so the P2 model using 105, 104, and 104 for tree, grass, and weed, respectively, is rather high. The third model (EX) uses the same peak pollen count, but assumes exercise for 1 hour that increases the volume of air 7 fold, (Berry et al. 1996) which we consider a rather extreme exposure model. The example of exercise is only intended to set a reasonable upper limit for respiration in 1 hour. Table 1 presents the results of the exposure calculations separately for trees, grasses and weeds. At the peaks of tree, grass, and weed season the pollen-derived adenosine daily dose (DD) is likely to only be 1.1 0.11, and 0.12 μg, respectively. The microgram to sub-microgram dosage of adenosine derived from pollen per day calculated here is in stark contrast to the 0.1–5mg dose previously suggested. (Gilles et al. 2011) The total dose for the other two models, P2 and EX, changes only slightly due to the fact that while the pollen count is higher, the time of exposure is reduced.
Table 1.
Pollen-Derived Adenosine Exposure Levels
| DD: Daily Dose | P2: Peak 2 hour | EX: Exercise during peak hour | ||||
|---|---|---|---|---|---|---|
| Mass | Nasal Fluid Concentration | Mass | Nasal Fluid Concentration | Mass | Nasal Fluid Concentration | |
| (μg) | (nM) | (μg) | (nM) | (μg) | (nM) | |
| Tree | 1.06 | 3.97 | 0.89 | 39.7 | 3.1 | 278 |
| Grass | 0.11 | 0.40 | 0.09 | 3.97 | 0.31 | 27.8 |
| Weed | 0.12 | 0.40 | 0.10 | 4.38 | 0.34 | 30.6 |
To model a concentration of adenosine due to pollen, the following factors are utilized. Most pollen particles are deposited in the nasal cavity, (Okuda et al. 2005) which can produce up to 1 liter of nasal fluid per day.(Parent 1992; Brofeldt et al. 1987) Therefore, the volume of dilution assumed for the various models are 1 l, 0.083 l, and 0.042 l for DD, P2, and EX respectively. At the peak of tree season the DD model calculates 4.0 nM adenosine, which is sub-physiological, (Ramakers et al. 2008; Zhang et al. 2011) but the validity of this model is questionable. The P2 and EX models show much higher concentrations due the higher pollen count due to much lower volumes of nasal fluid per unit time. EX suggests that rapid respiration during the very peak hour of tree season could add 278 nM exogenous adenosine, although this model is an extreme case. Normal levels in human plasma are around 200 nM.(Zhang et al. 2011)
Discussion
Motivated by reports that the adenosine content of pollen could affect allergic sensitization, the initial goal of this study was to measure the adenosine content from a variety of pollens.(Gilles et al. 2011; Wimmer et al. 2015) While utilizing NMR methods to assess the adenosine levels, the content of other highly abundant metabolites could be directly evaluated as well. These comparisons showed that various groups of pollens could be differentiated primarily by the sugar content similar to the NMR based classifier developed for Vaccinium leaf extracts.(Markus et al. 2014) This may be useful in developing an automated pollen classifier in the future. A literature search was performed on the list of assessed compounds from aqueous extract (Supplementary Table 2) for other possible connections to allergic disease and adenosine appeared to be the most relevant compound in the current literature.
The range of measured values of adenosine was 5–56 μM in 10 mg pollen/ml of aqueous extract. Compared to the previously reported values determined using mass spectrometry and UPLC, the Timothy grass pollen adenosine levels were nearly were 2-fold higher.(Gilles et al. 2011) Ragweed-derived adenosine was about 4-fold higher measured by NMR. Using comparable amounts of pollen, Gilles et al report values for Birch pollen derived adenosine from 4–45 μM, with a mean of 17, utilizing several different sources of pollen and species of Birch. Our study relied on multiple measurements from a single batch purchased from Greer Laboratories, and we found that the adenosine concentration in Birch pollen extract was 32±1 μM, which appears in the range of natural variation reported previously. Previous in vitro studies of Japanese cedar and cypress required sonication to extract allergens and eicosanoids from the pollen grains, (Gunawan et al. 2008) which may be related to the lack of adenosine, as well as the paucity of compounds extracted from the related Cupressaceae pollens. Figure 4 presents the adenosine values for all 26 pollens and the values range from 5 to 56 μM, where 5 is close to the limit of detection. Given this narrow range of values, and assuming that human exposure is unlikely due to a single species, it seemed reasonable to use averages for tree, weed, and grass pollens in modeling exposure.
Using this data on the amount of adenosine present in pollen, we sought to estimate the human exposure to pollen-derived adenosine from pollen count data on a geographic and seasonal basis. This was not intended to be an all-encompassing review of pollen exposure in N. America, rather it was intended to evaluate two main hypotheses. First, the major pollen load is derived from trees, and second the extreme values of pollen used in the exposure model are temporally rare. These points are discussed in further detail below.
References to other geographic locales
Studies from Washington DC and Florida, which is a tropical biome, confirm that trees produce 80–90% of the total pollen load.(Jelks 1990; Kosisky et al. 2010) This confirms the observations in Figure 5 that the pollen load from trees is 5–10 times that of the grasses and weeds. The five cities studied in Figure 5 are located in the East and Mid-West of the United States. Data from San Diego, CA also showed that the grass allergies were much more prevalent, but the tree pollen load was much higher.(Street and Hamburger 1976) Studies from Tucson, AZ showed that planted vegetation contributed significantly to the pollen load, and again the highest values were from trees.(Sneller et al. 1993) In this case the maximum values were 3–5 times the levels of weeds and grasses. Data from Frenz and coworkers confirms that the ragweed pollen counts can be very high in other parts of Texas and Nebraska, in the high hundreds of grains per m3, and in Tulsa, OK can be in the thousands.(Frenz et al. 1995; Frenz 1999) (The DD model set weed pollen at 103 grains/m3 and the P2 and EX models used 104.) The overarching conclusion is that the pollen load is dominated by trees, followed by weeds, and then grasses. This runs counter to the rates of sensitization of allergens in the United States with grass allergens more important than weeds, followed lastly by trees.(Salo et al. 2014) In other words the dose response of pollen-derived adenosine and pollen in general does not track with the prevalence of allergen sensitization.
Timing of adenosine exposure
The second point above was that high levels of adenosine derived from pollen will only occur rarely. The exposure model developed here suggests that in only a few days per year during the tree season would a person experience levels of exogenous adenosine from pollen approaching physiological relevance. Wimmer et al in fact modeled acute dosages of ragweed extract and found aggravated allergic lung inflammation compared to adenosine-depleted ragweed extract.(Wimmer et al. 2015) The mice were exposed by nasal lavage with 20 μl of ragweed extract (10 mg of pollen/ml) per day. Using the 25 μM adenosine measured in Figure 4 in ragweed extract, this would correspond to 133 ng of pollen-derived adenosine. A 20 g mouse is 3,500-fold smaller than a 70 kg person, which would correspond to a human exposure of 468 μg. Using the EX exposure model, this is over 100 fold higher than our estimate for pollen-derived adenosine at the peak of tree season and almost 1,000 times higher than our estimate for the peak of weed season. In addition to the total dose, lavage may also represent an unphysiologically rapid presentation of a high concentration (25 μM) of adenosine.
Adenosine exposure model
The part of this exposure model with greatest uncertainty is the concentration of the adenosine in the human nasal passage, which is subject to more assumptions, and the daily time dependence of pollen exposure could be highly variable. The textbook by Parent calculates that a human nose secretes 365–875 μl/min/nose, which translates to 0.5–1.2 l/day, but the resting evaporative water loss is estimated at 0.25 l/day (Parent 1992), which would vary with humidity. So there is a complex dynamic to estimating exposure concentration. Diffusion may be slower in thicker mucus and this may affect local concentrations surrounding a pollen grain. However, Okuda and co-workers found that 80% of pollen grains deposited in the nasal passage were cleared within 30 minutes by mucocilliary action.(Okuda et al. 2005) This demonstrates that there is a rapid turnover of fluids and particles and elution from the pollen could be dispersed across a significant area. We cannot completely exclude the possibility that local concentrations in the vicinity of the grains could be higher than expected. More research will be needed to better understand the kinetics of small molecule and allergen elution from pollen, and the corresponding diffusion rates in mucus to accurately model these local factors.
Based on our most extreme exposure model above (EX), the concentration of adenosine estimated is near physiological at 278 nM – about 2-fold lower than the previous estimate of 500 nM.(Gilles et al. 2011) However, this would be an unlikely event, and is only possible due to a very high load of tree pollen exposure in one hour with rapid respiration. The data suggests that these high levels are much less likely to result from exposure to grass or weed pollens. On the other hand, the overall prevalence of allergen sensitization is not 100%, so perhaps local factors or the occasional very high dose may skew the balance of adenosine toward allergic disease in susceptible individuals.
Conclusions
Pollen extracts can be classified from NMR metabolomics data primarily based on sugar content and other metabolites. Adenosine was detectable in most pollens in the range of 5–56 μM in 10mg of pollen/ml extract. Two primary factors appear to disfavor the hypothesis that pollen-derived adenosine is significant in allergic sensitization. First, the dose response of pollen-derived adenosine does not track with the prevalence of allergen sensitization. Second, the conditions required to generate a supra-physiological level of adenosine appear unlikely based on our exposure models.
Supplementary Material
Supplementary Figure 1- Comparisons of various metabolites. The mean concentration of A) Arginine, B) Betaine, C) Methanol, and D) Proline in each pollen extract is shown. Bars are colored red for grasses, blue for weeds, and green for trees. Standard deviations were determined from 5 samples. The abbreviations for the species names are shown in Supplementary Table 1. Arginine was found prominently in tree pollens, with the exception of the Cupressaceae (Panel A), while betaine was rare in the tree pollens (Panel B). Methanol was more prominent in the grass pollens (panel C), while there was a rather high concentration of proline in most pollens (panel D).
Supplementary Figure 2- Correlations with Adenosine Concentration- Panels A an B show the correlation coefficient of adenosine with the concentration of other common metabolites, using either the raw data (A) or the log2 transform of the concentrations (B).
Supplementary Figure 3- Adenosine peaks used for quantitation. Expanded region of the NMR spectra for A) Birch, B) Cypress, C) Ragweed, and D) Timothy with the adenosine peaks. Inset arrows and molecule are color coded to associate the peaks with the attached proton that gives rise to the signal.
Supplementary Figure 4- Data on the density of pollen derived primarily from Brown and Irving (1973), The Y-axis is plotted on a log scale for easy visual comparison.
Acknowledgments
This research was supported by Research Project Number Z01- ES102885-01 to REL in the Intramural Research Program of the National Institute of Environmental Health Sciences, National Institutes of Health.
Footnotes
The authors affirm that no conflicts of interest exist. The authors have complied with all ethical requirements.
References
- Amarante TD, da Silva JKL, Garcia GJM. Effects of airway surface liquid height on the kinetics of extracellular nucleotides in airway epithelia. Journal of Theoretical Biology. 2014;363:427–435. doi: 10.1016/j.jtbi.2014.08.030. [DOI] [PubMed] [Google Scholar]
- Barnes C, Pacheco F, Landuyt J, Hu F, Portnoy J. Hourly variation of airborne ragweed pollen in Kansas City. Annals of Allergy Asthma & Immunology. 2001;86(2):166–171. doi: 10.1016/S1081-1206(10)62686-5. [DOI] [PubMed] [Google Scholar]
- Behrendt H, Kasche A, von Eschenbach CE, Risse U, Huss-Marp J, Ring J. Secretion of proinflammatory eicosanoid-like substances precedes allergen release from pollen grains in the initiation of allergic sensitization. International Archives of Allergy and Immunology. 2001;124(1–3):121–125. doi: 10.1159/000053688. [DOI] [PubMed] [Google Scholar]
- Berry MJ, Dunn CJ, Pittman CL, Kerr WC, Adair NE. Increased ventilation in runners during running as compared to walking at similar metabolic rates. European Journal of Applied Physiology and Occupational Physiology. 1996;73(3–4):245–250. doi: 10.1007/Bf02425483. [DOI] [PubMed] [Google Scholar]
- Blume C, Swindle EJ, Gilles S, Traidl-Hoffmann C, Davies DE. Low molecular weight components of pollen alter bronchial epithelial barrier functions. Tissue Barriers. 2015;3(3):e1062316. doi: 10.1080/15476286.2015.1062316. [DOI] [PMC free article] [PubMed] [Google Scholar]
- Brofeldt S, Ingstrup MH, Niebuhr M, Mygind N, Marriot C. A study of nasal secretions sampled from the anterior and posterior parts of the human nose. Acta Otolaryngol., (Stockholm) 1987 [Google Scholar]
- Brown HM, Irving KR. Size and Weight of Common Allergenic Pollens – Investigation of Their Number Per Microgram and Size Distribution. Acta Allergologica. 1973;28(2):132–137. doi: 10.1111/j.1398-9995.1973.tb01319.x. [DOI] [PubMed] [Google Scholar]
- Davies HJ. Exposure of Hay-Fever Subjects to an Indoor Environmental Grass-Pollen Challenge System. Clinical Allergy. 1985;15(5):419–427. doi: 10.1111/j.1365-2222.1985.tb02291.x. [DOI] [PubMed] [Google Scholar]
- Ellis AK, North ML, Walker T, Steacy LM. Environmental exposure unit: a sensitive, specific, and reproducible methodology for allergen challenge. Annals of Allergy Asthma & Immunology. 2013;111(5):323–328. doi: 10.1016/j.anai.2013.07.019. [DOI] [PubMed] [Google Scholar]
- Ellis AK, Steacy LM, Hobsbawn B, Conway CE, Walker TJB. Clinical validation of controlled grass pollen challenge in the Environmental Exposure Unit (EEU) Allergy Asthma and Clinical Immunology. 2015;11 doi: 10.1186/s13223-015-0071-3. ARTN 5. [DOI] [PMC free article] [PubMed] [Google Scholar]
- Frenz DA. Volumetric ragweed pollen data for eight cities in the continental United States. Annals of Allergy Asthma & Immunology. 1999;82(1):41–46. doi: 10.1016/S1081-1206(10)62658-0. [DOI] [PubMed] [Google Scholar]
- Frenz DA, Palmer MA, Hokanson JM, Scamehorn RT. Seasonal Characteristics of Ragweed Pollen Dispersal in the United-States. Annals of Allergy Asthma & Immunology. 1995;75(5):417–422. [PubMed] [Google Scholar]
- Gilles S, Fekete A, Zhang X, Beck I, Blume C, Ring J, et al. Pollen metabolome analysis reveals adenosine as a major regulator of dendritic cell-primed T-H cell responses. Journal of Allergy and Clinical Immunology. 2011;127(2):454–U1705. doi: 10.1016/j.jaci.2010.12.1082. [DOI] [PubMed] [Google Scholar]
- Gilles S, Mariani V, Bryce M, Mueller MJ, Ring J, Behrendt H, et al. Pollen allergens do not come alone: pollen associated lipid mediators (PALMS) shift the human immune systems towards a T(H)2-dominated response. Allergy, asthma, and clinical immunology : official journal of the Canadian Society of Allergy and Clinical Immunology. 2009;5(1):3. doi: 10.1186/1710-1492-5-3. [DOI] [PMC free article] [PubMed] [Google Scholar]
- Gunawan H, Takai T, Kamijo S, Wang XL, Ikeda S, Okumura K, et al. Characterization of Proteases, Proteins, and Eicosanoid-Like Substances in Soluble Extracts from Allergenic Pollen Grains. International Archives of Allergy and Immunology. 2008;147(4):276–288. doi: 10.1159/000144035. [DOI] [PubMed] [Google Scholar]
- Iriyama T, Sun KQ, Parchim NF, Li J, Zhao C, Song AR, et al. Elevated Placental Adenosine Signaling Contributes to the Pathogenesis of Preeclampsia. Circulation. 2015;131(8):730–741. doi: 10.1161/Circulationaha.114.013740. [DOI] [PMC free article] [PubMed] [Google Scholar]
- Jelks ML. Florida Pollen Review. Allergy Proceedings. 1990;11(6):273–280. doi: 10.2500/108854190778879747. [DOI] [PubMed] [Google Scholar]
- Jenner P, Mori A, Hauser R, Morelli M, Fredholm BB, Chen JF. Adenosine, adenosine A(2A) antagonists, and Parkinson’s disease. Parkinsonism & Related Disorders. 2009;15(6):406–413. doi: 10.1016/j.parkreldis.2008.12.006. [DOI] [PubMed] [Google Scholar]
- Kosisky SE, Marks MS, Nelson MR. Pollen aeroallergens in the Washington, DC, metropolitan area: a 10-year volumetric survey (1998–2007) Annals of Allergy Asthma & Immunology. 2010;104(3):223–235. doi: 10.1016/j.anai.2010.01.005. [DOI] [PubMed] [Google Scholar]
- Liu H, Xia Y. Beneficial and detrimental role of adenosine signaling in diseases and therapy. Journal of Applied Physiology. 2015;119(10):1173–1182. doi: 10.1152/japplphysiol.00350.2015. [DOI] [PMC free article] [PubMed] [Google Scholar]
- Mariani V, Gilles S, Jakob T, Thiel M, Mueller MJ, Ring J, et al. Immunomodulatory mediators from pollen enhance the migratory capacity of dendritic cells and license them for Th2 attraction. Journal of Immunology. 2007;178(12):7623–7631. doi: 10.4049/jimmunol.178.12.7623. [DOI] [PubMed] [Google Scholar]
- Markus MA, Ferrier J, Luchsinger SM, Yuk J, Cuerrier A, Balick MJ, et al. Distinguishing Vaccinium Species by Chemical Fingerprinting Based on NMR Spectra, Validated with Spectra Collected in Different Laboratories. Planta Medica. 2014;80(8–9):732–739. doi: 10.1055/s-0034-1368569. [DOI] [PMC free article] [PubMed] [Google Scholar]
- Okuda M, Ohkubo K, Gotoh M, Hiroshima K, Ishida Y, Hori K. Dynamics of airborne pollen particles from inhalation to allergic reaction in the nose. Rhinology. 2005;43(1):29–33. [PubMed] [Google Scholar]
- Parent RA. Treatise on Pulmonary Toxicology: Comparative Biology of the Normal Lung. Vol. 1. CRC Press; 1992. [Google Scholar]
- Peel RG, Hertel O, Smith M, Kennedy R. Personal exposure to grass pollen: relating inhaled dose to background concentration. Annals of Allergy Asthma & Immunology. 2013;111(6):548–554. doi: 10.1016/j.anai.2013.09.002. [DOI] [PubMed] [Google Scholar]
- Plotz SG, Traidl-Hoffman C, Feussner L, Kasche A, Feser M, Ring J, et al. Chemotaxis and activation of human peripheral blood eosinophils induced by pollen-associated lipid mediators. Journal of Allergy and Clinical Immunology. 2004;113(6):1152–1160. doi: 10.1016/j.jaci.2004.03.011. [DOI] [PubMed] [Google Scholar]
- Porter EK. Origins and Genetic Nonvariability of the Proteins Which Diffuse from Maize Pollen. Environmental Health Perspectives. 1981;37(Jan):53–59. doi: 10.2307/3429250. [DOI] [PMC free article] [PubMed] [Google Scholar]
- Ramakers BP, Pickkers P, Deussen A, Rongen GA, van den Broek P, van der Hoeven JG, et al. Measurement of the Endogenous Adenosine Concentration in Humans In Vivo: Methodological Considerations. Current Drug Metabolism. 2008;9(8):679–685. doi: 10.2174/138920008786049249. [DOI] [PubMed] [Google Scholar]
- Salo PM, Arbes SJ, Jaramillo R, Calatroni A, Weir CH, Sever ML, et al. Prevalence of allergic sensitization in the United States: Results from the National Health and Nutrition Examination Survey (NHANES) 2005–2006. Journal of Allergy and Clinical Immunology. 2014;134(2):350–359. doi: 10.1016/J.Jaci.2013.12.1071. [DOI] [PMC free article] [PubMed] [Google Scholar]
- Skjoth CA, Sommer J, Brandt J, Hvidberg M, Geels C, Hansen KM, et al. Copenhagen – a significant source of birch (Betula) pollen? International Journal of Biometeorology. 2008;52(6):453–462. doi: 10.1007/s00484-007-0139-y. [DOI] [PubMed] [Google Scholar]
- Sneller MR, Hayes HD, Pinnas JL. Pollen Changes during 5 Decades of Urbanization in Tucson, Arizona. Annals of Allergy. 1993;71(6):519–524. [PubMed] [Google Scholar]
- Street DH, Hamburger RN. Atmospheric Pollen and Spore Sampling in San Diego, California .1. Meteorological Correlations and Potential Clinical Relevance. Annals of Allergy. 1976;37(1):32–40. [PubMed] [Google Scholar]
- Wimmer M, Alessandrini F, Gilles S, Frank U, Oeder S, Hauser M, et al. Pollen-derived adenosine is a necessary cofactor for ragweed allergy. Allergy. 2015;70(8):944–954. doi: 10.1111/all.12642. [DOI] [PubMed] [Google Scholar]
- Zhang YJ, Dai YB, Wen JM, Zhang WR, Grenz A, Sun H, et al. Detrimental effects of adenosine signaling in sickle cell disease. Nature Medicine. 2011;17(1):79–U252. doi: 10.1038/nm.2280. [DOI] [PMC free article] [PubMed] [Google Scholar]
- Zuo PY, Picher M, Okada SF, Lazarowski ER, Button B, Boucher RC, et al. Mathematical model of nucleotide regulation on airway epithelia – Implications for airway homeostasis. Journal of Biological Chemistry. 2008;283(39):26805–26819. doi: 10.1074/jbc.M801516200. [DOI] [PMC free article] [PubMed] [Google Scholar]
Associated Data
This section collects any data citations, data availability statements, or supplementary materials included in this article.
Supplementary Materials
Supplementary Figure 1- Comparisons of various metabolites. The mean concentration of A) Arginine, B) Betaine, C) Methanol, and D) Proline in each pollen extract is shown. Bars are colored red for grasses, blue for weeds, and green for trees. Standard deviations were determined from 5 samples. The abbreviations for the species names are shown in Supplementary Table 1. Arginine was found prominently in tree pollens, with the exception of the Cupressaceae (Panel A), while betaine was rare in the tree pollens (Panel B). Methanol was more prominent in the grass pollens (panel C), while there was a rather high concentration of proline in most pollens (panel D).
Supplementary Figure 2- Correlations with Adenosine Concentration- Panels A an B show the correlation coefficient of adenosine with the concentration of other common metabolites, using either the raw data (A) or the log2 transform of the concentrations (B).
Supplementary Figure 3- Adenosine peaks used for quantitation. Expanded region of the NMR spectra for A) Birch, B) Cypress, C) Ragweed, and D) Timothy with the adenosine peaks. Inset arrows and molecule are color coded to associate the peaks with the attached proton that gives rise to the signal.
Supplementary Figure 4- Data on the density of pollen derived primarily from Brown and Irving (1973), The Y-axis is plotted on a log scale for easy visual comparison.