

Summary
Oxygen availability, along with the abundance of nutrients (such as glucose, glutamine, lipids, and albumin), fluctuates significantly during tumor evolution and the recruitment of blood vessels, leukocytes, and reactive fibroblasts to complex tumor microenvironments. As such, hypoxia and concomitant nutrient scarcity affect large gene expression programs, signaling pathways, diverse metabolic reactions, and a variety of stress responses. This review will summarize our current understanding of how these myriad adaptations are integrated in O2 limited cells, and their role in disease progression.
Introduction
Molecular oxygen (O2) is an essential nutrient, serving as a key substrate for mitochondrial ATP production and numerous intracellular biochemical reactions. The maintenance of O2 homeostasis is, therefore, essential for the survival of most prokaryotic and eukaryotic species. O2 deprivation (hypoxia) triggers complex adaptive responses at cellular, tissue, and organismal levels to match O2 supply with metabolic and bioenergetic demand1. When faced with hypoxia, multiple evolutionarily conserved molecular responses are engaged, including those mediated by the HIF transcriptional regulators, mTORC1, autophagy, ER stress responses, a large family of O2 (2-oxoglutarate) dependent dioxygenases, and other O2 sensing mechanisms (e.g. reactions that introduce double bonds into long chain fatty acids)2. These promote altered metabolism, cell motility, angiogenesis, inflammation, and systemic changes in erythropoiesis, respiration, and cardiac function3. As such, responses to changes in O2 and nutrient availability play a central role in development, physiology, and diseases like cancer. Solid tumors, in particular, develop oxygen/nutrient deprived microenvironments as cancer cells outgrow O2 supply via native blood vessels, and aberrant angiogenic signaling disrupts normal blood vessel recruitment2. When faced with hypoxic and/or ischemic conditions, cancer cells utilize O2-sensing pathways to adapt to microenvironmental stresses. Additionally, hypoxia correlates with therapeutic resistance, to both cytotoxic drugs and radiation therapy4,5. Here we describe how these responses affect intracellular metabolism, and the impact of altered metabolism on the progression of solid tumors. We will also review the current state of hypoxia-targeted therapeutics, and potential clinical applications for these agents.
Part I: HIFs and metabolic adaptations in cancer cells
The notion that HIF stabilization under tumor hypoxia (Figure 1) provides adaptive advantages to cancer cells by altering gene expression and metabolism has ample support3. However, this is almost certainly too simple, as it fails to account for (1) differential oncogenic and tumor suppressor effects downstream of HIF expression in specific cancer types, (2) the paucity of activating HIF mutations in human cancers, (3) a lack of universal concordance between patterns of HIF protein expression and measurable hypoxia in solid tumors, and (4) basal HIF accumulation in many cancer cell lines under atmospheric conditions. It is clear that HIF stabilization and activation are highly responsive to both environmental cues (hypoxia, redox stress, etc.), as well as genetic alterations in signaling (oncogene/tumor suppressor) pathways that create a background context for HIF function2,3. Furthermore, the traditional model places HIF atop a transcriptional program that, in part, alters metabolic “wiring” to support tumor cell survival, growth, and proliferation. However, recent data reveal a more intricate relationship in which metabolic enzymes, as well as their substrates and products, reciprocally modulate HIF activity through a variety of complex feedback mechanisms.
Figure 1. Post-translational regulation of HIFα subunits under normoxic and hypoxic conditions.

Left: Under normoxic conditions, HIF-1α and HIF-2α are degraded. The prolyl hydroxylase (PHD also referred to as “EgLN”) family of enzymes hydroxylate proline residues on the HIFα subunits, which are recognized by the pVHL subunit of an E3 ubiquitin ligase complex. Of note, this reaction requires oxygen, 2-oxoglutarate, ascorbate, and iron as cofactors. FIH hydroxylates an asparagine residue, inhibiting HIFα recruitment of p300/CBP cofactors. Of note, the precise contributions of ascorbate and iron to normoxic PHD2 enzymology is still under active investigation (see text).
Right: Under hypoxic conditions, HIFα’s are not hydroxylated and instead translocate to the nucleus where they bind to their constitutively expressed partner ARNT. p300/CBP serve as transcriptional cofactors. HIFα/ARNT recognizes hypoxic response elements (HREs) throughout the genome and promote the transcription of 100s of genes involved in cellular adaptations to hypoxic stress. While HIF-1α and HIF-2α recognize the same HRE, they clearly promote the expression of mostly non-overlapping genes in certain contexts.
HIFs, metabolism, and mitochondrial ROS
It is well established that increased rates of glycolysis in cancer cells and rapidly dividing normal cells in O2 abundant tissues (the “Warburg effect”) generate critical biosynthetic intermediates required for the production of NADPH, nucleotides, amino acids, lipids, and glycogen, as well as ATP and other compounds essential for cell growth and division6. HIF stabilization in response to environmental cues (hypoxia, redox stress) and/or alterations in oncogene signaling, contributes in myriad ways to a pro-growth glycolytic metabolic program, by synchronizing proliferation rates with O2 availability2,7. Initially identified by its ability to regulate the erythropoietin (EPO) gene, HIF-1α was soon found to induce the expression of genes encoding glycolytic enzymes and glucose transporters8,9, implicating HIF-1α as an important contributor to the Warburg effect. In contrast to many other HIF transcriptional targets, HIF-2α complexes surprisingly do not generally induce the expression of glycolytic enzyme genes regulated by HIF-1α, but may achieve similar effects indirectly by enhancing the activity of c-Myc or other factors that also promote glycolysis10.
In addition to increasing glycolytic activity, suppressing ROS production by the mitochondrial electron transport chain (ETC) appears to be a fundamental HIF function11,12. Mitochondrial ROS levels paradoxically increase under hypoxic conditions and have been proposed to contribute to HIF-α stabilization, although controversy on this point persists13–15. Recently, Ras-driven redox stress was reported to cause EglN1 (herein referred to as “PHD2”) protein dimerization though disulfide bond formation, inactivating the enzyme and stabilizing HIF-α subunits16. However, it should be noted that Ras was overexpressed in these studies, and whether physiological Ras levels would do so remains unclear. Whether induced by hypoxia or oncogenic signaling (e.g. via activating mutations in Ras), HIF suppresses oxidative stress through a variety of mechanisms: for example, HIF-1α induces the expression of pyruvate dehydrogenase kinase 1 (PDK1), which phosphorylates and inhibits mitochondrial pyruvate dehydrogenase (PDH)11,12. PDH converts glycolytic pyruvate to mitochondrial NADH and acetyl-CoA, thereby promoting oxidative mitochondrial metabolism. Inhibiting HIF-mediated PDK1 expression increases mitochondrial NADH levels, flux through the ETC, and formation of toxic ROS. Intriguingly, breast cancer cells require HIF-1α-dependent PDK1 expression for efficient metastatic colonization of the liver, as opposed to bone or lung metastasis17. Here, the liver-metastatic breast cancer cells are characterized by increased conversion of glucose-derived pyruvate into lactate, and decreased mitochondrial metabolism. Moreover, human liver metastatic lesions from breast cancer patients exhibit increased PDK1 abundance relative to other organ sites. HIF-1α also directly regulates the expression of the enzyme lactate dehydrogenase (LDHA), which converts glycolytic pyruvate to lactate, and the MCT-4 cells surface transporter, which effluxes lactate from the cell18. Together, LDHA and MCT-4 direct pyruvate away from oxidative metabolism, while LDHA inhibition increases intracellular ROS levels and redox stress.
HIF-1α also alters mitochondrial metabolism indirectly, in part by stimulating the replacement of the cytochrome c oxidase subunit COX4-1 with COX4-2, which transfers electrons to O2 more efficiently under hypoxic conditions, thereby lowering ROS levels19. Similarly, HIF-1α induced expression of NDUFA4L2 inhibits ETC Complex I activity and reduces O2 consumption and ROS production20. Moreover, HIF-1α inhibits c-Myc-dependent mitochondrial biogenesis though multiple complex processes21,22, and reduces mitochondrial number by inducing the expression of BNIP3, which promotes mitophagy7. A related mechanism was recently reported for HIF-2α, which promotes selective autophagy of peroxisomes in pVHL-deficient clear cell renal cell carcinoma (ccRCC) cells23. Peroxisomes play a key role in cholesterol and bile acid synthesis and lipid degradation, generating large amounts of ROS in liver and other tissues, although the degree to which selective HIF-mediated peroxisome autophagy regulates cancer cell metabolism is as yet unknown.
The anti-oxidant glutathione is critical to maintaining intracellular redox balance, and its synthesis requires NADPH generated in the oxidative pentose phosphate pathway (PPP). Hypoxia promotes PPP activity, in part by inducing O-GlcNAcylation of glucose-6-phosphate dehydrogenase (G6PD), the first committed step in the PPP24. Interestingly, PFK1 O-GlcNAcylation inhibits its activity and also redirects glycolytic carbon into the PPP25. It is intriguing that O-GlcNAcylation of multiple enzymes is associated with increased PPP activity, although the mechanisms by which hypoxia and (possibly) HIFs contribute to these effects remain to be determined. HIF has also been reported to promote mitochondrial localization of the p53 target TIGAR, which functions as a fructose 2,6-bisphosphatase, resulting in elevated hexokinase 2 activity and increased PPP flux26. Finally, hypoxia redirects glucose toward glycogen accumulation27, which provides glucose to the PPP. Glycogen synthase (GYS1) expression is rapidly induced by hypoxia, followed by a subsequent increase in glycogen phosphorylase (PYGL) expression, which is required for glycogen catabolism. Interfering with PYGL expression correlates with increased ROS accumulation and p53-dependent senescence27. As many oncogenic pathways promote glycolysis (BCR-ABL, Akt, Myc, PTEN and others), through both HIF-dependent and –independent means, the ability of HIF to modulate carbon flow and limit damaging ROS production may prove to be its most critical metabolic function in cancer cells, irrespective of oncogenic context.
HIF regulation by metabolic enzymes
Collectively, the data described above support a model in which HIFs are activated by hypoxia or oncogenic signaling (e.g. downstream of mTORC1) to alter the expression of metabolic enzymes, thereby redirecting carbon flow and modulating ROS levels in cancer cells. Interestingly, recent evidence indicates that some of these same enzymes feedback-regulate HIF complexes through direct physical interaction. For example, HIF-1α binds to and stimulates the expression of the pyruvate kinase M (PKM) gene28, which encodes alternatively spliced mRNAs encoding PKM1 and PKM2 isoforms. Extensive work has demonstrated that PKM2 is preferentially expressed in cancer (and rapidly dividing normal) cells, and has lower enzymatic activity that PKM1, thereby reducing pyruvate production and redirecting glycolytic carbon to biosynthetic pathways to support cell growth6. Semenza and colleagues reported that PKM2, but not PKM1, physically binds to HIF-1α, promotes its recruitment to HREs, and stimulates HIF transcriptional activity28. Remarkably, this effect requires PHD3, which appears to hydroxylate specific proline residues on PMK2. A similar relationship was observed in macrophages, where LPS stimulation induces PKM2 expression, which then forms a complex with HIF-1α to mediate a switch from oxidative metabolism to a highly glycolytic program29. Furthermore, PKM2 promotes HIF-1α dependent interleukin 1β (IL-1β) secretion. Although the precise role of PKM2 in tumor growth and progression remains unclear30–33, it remains the subject of active investigation.
Both HIF-1α and HIF-2α also appear to interact physically with fructose-1,6-bisphosphatase 1 (FBP1), which catalyzes the first committed step in gluconeogenesis within liver and kidney tissue and is encoded by a direct HIF-1α target gene34. Metabolomic analyses of human ccRCC cells indicate that intermediates in the gluconeogenic pathway are significantly repressed relative to normal kidney tissue. Furthermore, expression of FBP1 and other key gluconeogenic enzymes is greatly reduced in ccRCCs, with FBP1 depleted in >1000 samples tested to date. Some of these effects may be explained by loss of FBP1 enzymatic activity and consequent routing of carbon toward glucose catabolism, thereby opposing elevated gluconeogenic flux. Surprisingly, however, catalytically inert FBP1 mutant protein also suppresses ccRCC growth in a HIF-dependent manner. Li and colleagues demonstrated that FBP1 assembles with chromatin-bound HIF complexes and inhibits their activity through binding to a previously described, but poorly understood, negative regulatory region in the HIF TAD. Silencing FBP1 expression therefore results in elevated HIF activity, with consequent effects on glycolysis, PPP flux, and proliferation, and appears to be a critical step in ccRCC etiology. These two examples indicate that at least some HIF-regulated enzymes can interact directly with HIF proteins to modulate their function through positive and negative feedback loops. The degree to which this mechanism extends to other HIF-regulated metabolic enzymes is currently under active investigation.
HIF activation by metabolites
Increasing evidence reveals that HIF-α stabilization and activity is controlled indirectly by Krebs cycle intermediates, and contributes to cancer cell metabolism. For example, mutations in genes encoding fumarate hydratase (FH) or succinate dehydrogenase (SDH) are associated with hereditary leiomyomatosis and renal cell carcinoma (HLRCC) or hereditary paraganglioma/pheochomocytoma syndrome, respectively35,36. Succinate and fumarate accumulate to high levels in these tumors and can increase HIF-1α levels, and HIF target gene expression, in part by competitive inhibition of 2-OG dependent PHD enzymes37,38. The degree to which these and other Krebs cycle intermediates regulate PHD (or FIH) activity in other tumor types is unclear, but these observations indicate that the relative levels of the canonical substrates (2-OG, ascorbate, Fe) versus structurally similar compounds can influence HIF activity. It is also interesting that PHD and FIH enzymes appear to be differentially responsive to inhibition by fumarate, citrate, and ROS39,40.
It is also clear that increased levels of fumarate or succinate (or other intermediates) have HIF-independent roles in cancer cells. For example, mice with engineered fumurate hydratase (FH) mutations develop renal cysts; however, HIFs appear to be dispensable for cyst formation, whereas antioxidant signaling by Nrf2 plays a critical role41. Moreover, PHD and FIH enzymes are part of a much larger (≥70) group of 2-OG dependent dioxygenases that control epigenetic states, including DNA, RNA, and histone demethylases (eg, TET, FTO, Jumonji enzymes)42. Interestingly, FH and SDH loss is associated with increased DNA and histone methylation in multiple cancer cell types42. Recently, fumarate and succinate were shown to be direct inhibitors of TET1 and TET2 enzymes, resulting in DNA hypermethylation and reduced HIF target gene expression43. Finally, mutations in genes encoding the isocitrate dehydrogenases IDH1 and IDH2 lead to accumulation of the novel “oncometabolite” 2-hydroxyglutarate (2-HG), which inhibits TET2, and JMJD2A, and alters epigenetic gene regulation in gliomas, AML, and other tumor types44,45. 2-HG was been reported to activate PHD2 and reduce HIF-1α protein accumulation in an enantiomer-specific manner46, although these data somewhat remain controversial47.
HIF activity is also regulated by intracellular iron, in that the maintenance of Fe2+ by ascorbate at the PHD catalytic center may be required for enzymatic activity, in certain contexts48–50. Increased cellular ascorbate levels correlate with elevated PHD hydroxylase activity and reduced HIF accumulation, and are associated with a less aggressive phenotype in endometrial51 and colorectal52 cancers. In another example of reciprocal regulation, HIF-2α plays a primary role in iron absorption and homeostasis53,54, in part by regulating the expression of the iron transporter DMT-1, duodenal ferric reductase (DcytB), and ferroportin. HIF-2α accumulation itself is regulated by iron regulatory proteins (IRPs) that bind to HIF-2α mRNA to increase its translation in an iron-dependent manner55. This arrangement appears to coordinate erythropoiesis by matching HIF-2α dependent EPO production56,57 with iron availability53,54. To what degree iron availability, transport, and oxidation state regulate HIF responses in cancer cells, and alters their redox and metabolic states, is an exciting area for future investigation.
Part II. The influence of O2 availability on intracellular biochemical reactions
Oncogenic events, such as activation of oncogenes or loss of tumor suppressors, can imbue cancer cells with deregulated growth rates and uncontrolled proliferation. Therefore, cancer cells must simultaneously confront the compound challenges of accelerated growth rates and limited and/or variable O2 and nutrient supplies. Compared with normal cells, malignant cells exhibit significant metabolic alterations regarding critical nutrients and substrates, such as glucose, glutamine, and fatty acids, and the hypoxic tumor microenvironment plays a central role in their uptake and utilization.
Metabolic reprograming in hypoxic cells
As described above, HIFs mediate many adaptive responses to reduced O2 availability, including but not limited to enhanced glucose and glutamine uptake, glycolysis, and glycogen synthesis, and reduced pyruvate catabolism and O2 consumption by mitochondria1. For example, O2 deprivation creates a deficit of glucose-derived acetyl-CoA needed for lipid synthesis, due to elevated PDK1 activity inhibiting conversion of pyruvate to acetyl-CoA for entry into the TCA cycle6. This could result in decreased levels of TCA cycle intermediates needed for multiple biosynthetic reactions. Fatty acid generation begins with cleavage of TCA cycle-derived citrate into acetyl-CoA and oxaloacetate (Figure 2), and subsequent carboxylation of acetyl-CoA to produce malonyl-CoA, which is further assembled into long chain fatty acids by fatty acid synthase (FASN). In addition to supplying citrate, the TCA cycle also generates precursors for the synthesis of nonessential amino acids like aspartate and asparagine. Thus, to maintain citrate and amino acid biosynthesis, their production is balanced by the ultimate conversion of glutamine to 2-OG (α-ketoglutarate) during TCA cycle “anaplerosis”6. Glutamine-derived 2-OG generates oxaloacetate and malate for the production of citrate as well as NADPH via malic enzyme (ME1), independent of glucose entry into the cycle. When hypoxia creates a deficit of glucose-derived acetyl-CoA, “reductive carboxylation” of 2-OG reverses a section of the TCA cycle, converting mitochondrial 2-OG into citrate, which enters the cytosol to generate acetyl-CoA for fatty acid and cholesterol biosynthesis58–60. Hypoxic cells therefore exhibit increased rates of glutamine uptake to compensate for decreased entry of glucose-derived carbons into the mitochondrion. Moreover, hypoxia shifts glutamine metabolism from oxidation to reductive carboxylation by HIF-1α mediated turnover of the E1 subunit 2-OG dehydrogenase (via SIAH2 ubiquitination), which is required for more typical conversion of 2-OG to succinate61.
Figure 2. Glycolysis, the TCA cycle, and lipid synthesis.

Lipids (e.g. fatty acids, cholesterol, phospholipids, and triglycerides) can be synthesized de novo from glucose or glutamine or taken up by cell surface transporters. Decreased oxygen levels promote glucose import, glycolysis, glutamine uptake, and glutaminolysis. Hypoxic cells also exhibit increased rates of reductive carboxylation. Moreover, hypoxia increases the expression of Fructose-1,6-bisphosphatase (FBP1). The tumor microenvironment can decrease stearoyl-CoA desaturase-1 (SCD1) desaturase activity. Thus, unsaturated lipids in particular are affected by changes in oxygen availability. Hypoxia results in increased lipid uptake, which counteracts the affects of SCD1 inhibition.
Abbreviations: PKM1/2: pyruvate kinase M1/2; FASN: fatty acid synthase; HMGCR: HMG Co-A reductase; ACL: ATP citrate lyase; ACC: acetyl-CoA carboxylase.
Recently, extracellular acetate has been shown to be used by some cancer cells (e.g. glioblastoma, breast cancer brain metastases) as an alternate source of acetyl-CoA needed for anabolic processes, such as de novo fatty acid synthesis62–64. Here, imported acetate is converted to acetyl-CoA by acetyl-CoA synthetase 2 (ACSS2). As such, decreased cytosolic acetyl-CoA levels imposed by hypoxia can be replenished by increasing the catabolism of free acetate from plasma and interstitial fluid, in addition to TCA cycle 2-OG reductive carboxylation when O2 is limiting. While HIF amplifies many of these metabolic adaptations by upregulating PDK1 and 2-OG dehydrogenase, it should be noted that such metabolic adaptations to hypoxia can also occur in HIF-deficient cells11,12. Thus, changes in intracellular biochemical pathways downstream of low O2 are both HIF-dependent and HIF-independent.
Additional hypoxic influences on lipid homeostasis
In addition to increased demand for nucleotides, amino acids, and reducing equivalents like NADPH, proliferating cancer cells require abundant pools of multiple lipid species needed for membrane synthesis, lipid based signaling reactions, and other processes65. Fatty acids are derived from endogenous citrate (and sometimes exogenous acetate), or taken up from extracellular sources. Elevated rates of lipid synthesis typically occur through increased expression of multiple lipogenic enzymes, downstream of mTORC1, for example66,67. Cancer cell survival depends on enhanced lipid production, and FASN overexpression is strongly correlated with the progression of breast cancer and other malignancies68,69. Fatty acids can be incorporated into membranes as phospholipids, stored in lipid droplets, or used for the synthesis of signaling lipids, such as sphingosine 1-phosphate65. They can also be catabolized by mitochondrial β-oxidation as an alternative means of ATP production when glucose and glutamine are limiting. The requirement for fatty acids and cholesterol is largely met by synthesis from glucose-derived carbon, but can also depend on fatty acid uptake, especially in hypoxic conditions. To obtain free fatty acids from plasma, chylomicron triglycerides and low-density lipoprotein particles are hydrolyzed by lipoprotein lipase and imported via the CD36 fatty acid channel protein, among other mechanisms70.
We have shown that multiple cancer cells exhibiting constitutive mTORC1 activity (due to TSC2 deficiency, or other oncogenic events) die in ischemic conditions where O2, glucose, and blood borne nutrients (serum) are limiting, due specifically to decreased pools of unsaturated lipids71. This programmed cell death occurs because the desaturation of de novo synthesized fatty acids by stearoyl-CoA desaturases (SCDs) are O2 consuming biochemical reactions. Oxygen limitation inhibits these enzymatic reactions, rendering cells dependent on exogenous lipids to avoid a critical unsaturated lipid deficiency, causing cell death downstream of endoplasmic reticulum (ER) stress and a “toxic” unfolded protein response (UPR). Cellular unsaturated to saturated lipid ratios and cholesterol availability are necessary for membrane homeostasis of the ER and other organelles72. Furthermore, the ER provides an important platform for the biosynthesis of both protein and lipids65. If oncogenic drivers of anabolic metabolism result in protein overproduction while the ER is unable to expand due to lack of membrane “fluidity”, a “terminal” UPR is engaged followed by cell death71. Along these lines, hypoxic cells exhibit increased uptake of lysophospholipids, in particular, to bypass their need for fatty acid desaturation73. How these lipids are imported and distributed intracellularly remains an important area of research. Lipid droplets, composed of phospholipid monolayers and perilipin coat proteins, represent important reservoirs in O2 limited cells, and the perilipins are HIF target genes in renal cancer and glioblastoma cells74,75.
Novel metabolites imparting cellular adaptations to low O2
During the TCA cycle, isocitrate is converted to 2-OG and thereafter succinate, via several NADP+-dependent enzymes. As stated above, mutations in the genes encoding IDH1 and IDH2 have been documented in multiple malignancies. Mutant IDH1 and IDH2 enzymes exhibit “neomorphic” activity where isocitrate is instead converted to D(R)-2-hydroxyglutarate (D-2HG), an “oncometabolite” that inhibits 2-OG/O2 dependent enzymes, including TET1 and TET276–78. TETs promote the removal of methyl groups from 5-methylcytosine residues in DNA, altering gene expression in leukemias and solid tumors of the brain and cartilage. However, cells harboring wild type IDHs produce elevated levels of L(S)-2-hydroxyglutarate (the enantiomer of D-2HG) under hypoxia. Recent work from two independent research groups has shown that L(S)-2-hydoxyglutarate (L-2HG) produced in hypoxic glioblastoma, neuroblastoma, and renal carcinoma cells as well as blood vessel components is largely HIF-independent, and has a number of downstream effects79,80.
Intlekofer et al.79 demonstrated that elevated L-2HG levels result in increased methylation of histone repressive marks (e.g. histone 3 lysine 9, and lysine 27) in response to hypoxia, due to inhibition of the epigenetic modifier KDM4C, a Jumonji family histone demethylase. Oldham et al.80 showed that hypoxia specifically increases L-2HG in additional cell types, such as pulmonary endothelial and smooth muscles cells, maintaining cellular and mitochondrial redox balance. Surprisingly, the source of L-2HG is not IDH enzymatic activity, but malate dehydrogenase (MDH) and LDHA metabolism. In cancer cells, L-2HG arises via promiscuous substrate usage by LDHA, with some input from MDH1 and MDH 2. LDHA and MDH reduction of 2-OG to L-2HG is NADH-dependent, and most of the 2-OG is derived from imported glutamine in hypoxic cells. However, malignant cells are more dependent on LDHA for L-2HG production, while endothelial and smooth muscle cells are more reliant on the MDHs. The relevant roles of these metabolic enzymes in distinct cell types (e.g. normal versus cancerous?) remain unclear. Nevertheless, these findings have therapeutic implications for hypoxic tumors, as glutamine catabolism can be inhibited by small molecule inhibitors of glutaminase81. Moreover, unbiased metabolomics identified elevated L-2HG in clear cell renal cancers, due to reduced expression of L-2HG dehydrogenase82. Restored L-2HG dehydrogenase expression increased 5-methylcytosine accumulation and suppressed renal tumor growth. Overall, based on these findings, glutamine not only contributes to the biosynthesis of cholesterol and fatty acids, but is also critical for redox homeostasis and maintenance of the epigenome in O2 limited cells.
In addition to HIF-independent L-2HG production by hypoxic cells, the accumulation of lactate can stabilize NDRG3 (NDRG family member 3) by inhibiting the PHD2/pVHL degradation machinery in an O2-regulated fashion83. Here, NDRG3 (a novel pVHL substrate) directly binds excess lactate, which builds up during hypoxia, inhibiting its ubiquitination and protesomal degradation by disrupting the NDRG3-pVHL interaction. Stabilized NDRG3 protein then binds c-Raf, activating the Raf-ERK pathway to promote angiogenesis, breast cancer cell proliferation, and tumor growth. NDRG3 is also highly induced in a variety of other cancer cell types when O2 levels decline83. As lactate is a glycolytic end-product, NDRG3 accumulation is indirectly dependent on HIF-1α, which regulates LDHA expression in hypoxic cells. Nevertheless, these findings imply that the PHD2/pVHL system can regulate both HIF-dependent and HIF-independent responses downstream of low O2, and raise the question of whether other proteins respond to lactate buildup during prolonged hypoxia.
Beyond PHDs and FIH, are additional 2-OG dependent dioxygenases influenced by O2 levels typical of the tumor microenvironment?
The human genome encodes an estimated 60–70 O2 consuming, ferrous iron and 2-OG dependent dioxygenases with diverse biochemical roles involving oxidative reactions associated with fatty acid metabolism, carnitine biosynthesis, and phytanic acid catabolism84. However, the identified reactions thus far mostly involve protein hydroxylations and demethylation of N-methylated groups in proteins and nucleic acids, via their initial hydroxylation (Figure 3). At first, it was suggested that the HIF hydroxylases (PHDs, FIH) have special biochemical properties endowing their O2 sensing properties which set them apart from other 2-OG dioxygenases85. Specifically, the KmO2 (oxygen concentration required for half maximal catalytic rate) for PHD2 was initially reported to be 200–250 μm, which is unusually high for this class of enzymes. This could make HIF hydroxylases particularly “sensitive” to fluctuations in O2 concentrations detected in both physiological and pathological situations. Subsequent biochemically superior assays (where larger HIF-α fragments were employed as substrates as opposed to short polypeptides), however, determined that PHDs actually have lower KmO2 values, i.e. approximately 100 μm, which are similar to those reported for other 2-OG dioxygenases86. Therefore, many of the broader 2-OG dependent enzyme family members reside at physiological tissue pO2 levels predicted to be below even the lower KmO2 estimates, while intracellular oxygen gradients can create further decreased O2 levels. This makes many of the 2-OG dioxygenases potential “oxygen sensors”, if their catalytic activity is rate limiting for the overall biochemical pathway they function in.
Figure 3. The mTORC1 and mTORC2 pathways and their interaction with hypoxia.

Key activators (green) and inhibitors (red) of the mTORC1/2 pathway are shown. A diverse array of extracellular inputs, such as insulin, growth factors, and amino acids can promote mTOR activity. These signals lead to the inactivation of the TSC1/2 complex, an upstream inhibitor of mTORC1. They can also activate mTORC2 through PIP3 and AKT. For mTORC1, the main outputs are increased ribosomal biogenesis, CAP-dependent mRNA translation, and a series of anabolic pathways, such as purine, pyrimidine, and lipid synthesis. mTORC2 is associated with pro-survival activity, as well as modification of the cytoskeleton and other metabolic adaptations. Hypoxia can inhibit mTORC1 through REDD1 or REDD2, which are HIF-1α target genes. Additionally, hypoxia leads to energy deficiency (elevated AMP/ATP ratios), which can inhibit mTORC1 through AMPK. Interestingly, HIF-2α enhances mTORC2 activity by promoting amino acid import through the transporter SLC7A5. It should be noted that REDD1 can be phosphorylated and activated ahead of increased abundance downstream of HIF-1α, so it in and of itself is an “O2 sensor”.
It has also been suggested that the 2-OG dioxygenases (especially the PHDs) simultaneously sense changes in intracellular concentrations of oxygen and TCA cycle intermediates, namely 2-OG itself38,87. The use of O2 and 2-OG in the hydroxylation reaction would therefore link hypoxic and metabolic signaling in a very appealing way. However, it remains unclear if intracellular 2-OG levels ever become limiting for the HIF and other hydroxylases3. Instead, the availability of Fe2+ as a cofactor may be more variable and therefore important for modulating dioxygenase enzymatic activity, allowing them to detect changes in cellular iron levels as well as redox signals85. As stated above, there is substantial evidence that the PHDs and FIH are inhibited by oxidant stress. Moreover, while 2-OG abundance may not be a limiting factor for dioxygenase activity, overproduction of other TCA cycle metabolites (fumarate and succinate) clearly serve as competitive inhibitors for the hydroxylase reactions37,38,88.
Post-translational hydroxylation of prolyl and lysyl residues by 2-OG dioxygenases was first identified for collagen maturation, followed by their prolyl and asparaginyl hydroxylation of HIFs84. The ability of 2-OG dioxygenases to catalyze N-demethylation (via hydroxylation) of N-methylated histone lysyl residues (especially the H3 N-terminal tail) and 5-methyl cytosine links the family to epigenetic regulation. If the KmO2 ‘s for histone and nucleic acid hydroxylases prove to be similar for those measured for the PHDs, it suggests that steep O2 gradients, fluctuating O2 availability, and changes in fumarate and succinate concentrations typical of solid tumor microenvironments may impart more durable changes in the epigenome of cancer cells, along with influencing the HIF pathway and deposition of extracellular matrix.
Part III. Interface between hypoxia, mTOR and calcium signaling
In addition to the HIF pathway, cells maintain their metabolic homeostasis through independent, but closely linked molecular signaling networks. One major sensor of nutrient availability is the mTOR (mechanistic target of rapamycin) pathway89. In brief, mTOR integrates energy and nutrient sensing inputs by the cell, and controls cellular growth and proliferation (Figure 4). In mammals, there are two separate mTOR catalytic units, called mTOR complex 1 (mTORC1) and mTOR complex 2 (mTORC2). Both complexes share a catalytic mTOR subunit, mLST8, DEPTOR, and Tti1/Tel2 complex. mTORC1 also contains raptor and PRAS40, while mTORC2 Rictor, mSIn1, and protor1/2 proteins. When mTORC1 is activated under energy or nutrient replete conditions, it enhances cell growth and protein synthesis through phosphorylation of ribosomal S6 kinase 1 (S6K1), and the eukaryotic initiation factor 4E binding protein (4E-BP1). In contrast, mTORC2 signaling, while much less understood, appears insensitive to nutrient conditions but does respond to growth factors. One major output of mTORC2 signaling is phosphorylation and activation of Akt at Ser473, whose activity can ultimately lead to mTORC1 activation90. It is not surprising that cancer cells co-opt mTOR’s pro-growth outputs, either through modulating direct or indirect (e.g. p53 or PTEN loss; Akt or Ras activation) regulators of the pathway6,91.
Figure 4. Oxygen consuming, 2-oxoglutarate (α-ketoglutarate) dependent dioxygenases and diverse biochemical reactions they regulate.

Beyond the PHDs and FIH, 60–70 2-OG dependent dioxygenases have either been biochemically confirmed or predicted based on sequencing the human genome. Their relative KmO2 for molecular oxygen and dependence on Fe2+ indicate that their activities could increase or decrease, based on pO2 levels and concentrations of succinate, fumarate, and 2(L)-HG accumulation in the tumor microenvironment. As shown, they a have variety of enzymatic functions in cells which impact the extracellular matrix, methylation status of histones and nucleic acids, and components of the translation machinery, along with pivotal roles in maintaining oxygen homeostasis by hydroxylating HIFα subunits.
Numerous internal and external stresses can alter mTOR signaling in tumor cells, including O2 availability. One of the first connections identified between hypoxia and mTOR demonstrated that andenosine monophosphate-activated protein kinase (AMPK) phosphorylates TSC2 and inhibits mTORC1 in response to low energy or hypoxic states92. Furthermore, mTORC1 promotes glycolysis by enhancing both the transcription and translation of HIF-1α66,93. Loss of LKB1, the upstream kinase of AMPK, increases HIF-1α accumulation via increased reactive oxygen species as well as mTORC1 activity94. However, HIF can also provide feedback inhibition of the mTORC1 pathway in an AMPK independent manner, through its target gene Regulation of DNA damage response 1 (REDD1)95,96. The isoform REDD2 is also hypoxically induced and inhibits mTORC1, however its expression is restricted to certain tissues97,98. Interestingly, HIF-2α affects mTORC1 in an independent manner from HIF-1α99. In the context of pVHL-deficient mouse tissue and renal cell carcinoma lines, HIF-2α promotes mTORC1 activity by increasing the expression of the amino acid transporter SLC7A5, which functions as an antiporter by effluxing L-glutamine while importing L-leucine. One theory for this differential effect on mTORC1 postulates that distinct kinetics of HIF-1α versus HIF-2α stabilization are responsible for these observations. HIF-2α stabilization occurs at higher O2 concentrations over longer periods of hypoxia100, and cells may therefore require some basal activity of mTOR to survive this longer-term stress. In contrast, HIF-1α is stabilized at lower O2 levels but its induction is short-lived compared to HIF-2α, and therefore inhibiting mTORC1 acutely might be more beneficial for cell survival100.
In addition to the above-mentioned inputs that regulate mTOR, calcium availability and its downstream signaling also promote mTORC1 activity. Amino acids, as critical stimulators of mTORC1 activity, induce a rise in intracellular calcium concentrations, triggering mTORC1 activation through calmodulin (CaM) and the lipid kinase hVps34101,102. In addition, calcium can regulate mTORC1 through Ca2+/calmodulin-dependent protein kinase II (CaMKII)103,104. Phosphorylation of CaMKII leads to activation of mTORC1, although the specific mechanism(s) are not well defined. Nakazawa et al. have recently determined that HIF-2α can act upstream of Ca2+ effects on mTORC1, in the setting of soft tissue sarcomas; however, how broadly applicable to other tumor types remains to be determined105.
Part IV: Hypoxic regulation of autophagy
Autophagy is a cellular process whereby cells engulf and degrade proteins, organelles, and cytoplasm, recycling them to provide themselves with substrates for energy production and to sustain cellular metabolism106. Under a variety of stress conditions, including nutrient or growth factor depravation, cytotoxic agents, and low O2 availability, cells activate autophagy. Depending on the cellular context and type of cancer, autophagy can either promote or inhibit tumor growth107,108. In malignant cells, stress-induced autophagy appears to be protective against adverse microenvironmental stresses and cytotoxic therapies. In healthy tissues, autophagy mediates tumor suppressive functions by preventing the accumulation of cellular stressors such as uncoupled mitochondria, peroxisomes, and damaged ER.
Several molecular sensors are responsible for detecting and translating such homeostatic perturbations into a pro-autophagy signal. For example, AMPK, which responds to increases in cellular AMP/ATP ratios, directly phosphorylates ULK1, an autophagy initiation kinase, while also inhibiting mTORC1109. Misfolded proteins in the ER can activate autophagy through PERK as well110. Another complex which activates autophagy is Vps34-p150-Beclin 1, where Beclin 1’s autophagic function is inhibited by the anti-apoptotic protein Bcl2111,112. Once the pro-autophagy signal is activated, an autophagosome (a double membrane microvesicle) is initiated and elongated by other proteins, such as members of the ATG family (e.g. ATG5, ATG7, ATG12, ATG16), and LC3 conjugated to PE (LC3-II), which ultimately close the autophagosome around the targets to be degraded106. The autophagosome subsequently fuses to a lysosome, creating an autolysosome, which ultimately degrades the contents held inside.
Several chemical inhibitors of autophagy block different steps along the autolysosome formation pathway113. One of the best characterized is chloroquine (or hydroxychloroquine), which was initially clinically approved as an anti-malarial treatment114. Chloroquine is a lysosomotropic agent, and accumulates in acidic compartments such as endosomes and lysosomes. There, it prevents acidification of the endosome, which in turn inhibits lysosomal enzymes that require low pH to function. This effect inhibits fusion and degradation of the lysosome with the autophagosome, thus preventing degradation of the products inside. Bafilomycin A, another commonly used autophagy inhibitor, inhibits autophagy at a similar step in the pathway115. Additionally, more specific inhibitors of autophagy are under investigation (e.g. ATG7 inhibitors), but are still at the preclinical stage of development113.
Although O2 availability affects mTORC1, one of the main suppressors of autophagy as described above, it also impacts autophagy regulators directly. For example, BNIP3 and BNIP3L (NIX) are upregulated by HIF-1α116. Although these proteins are implicated in apoptosis, it has also been shown that they disrupt Bcl-2:Beclin 1 complexes, freeing Beclin 1 to activate autophagy in hypoxic cells. BNIP3 and BNIP3L have also been shown to be important in autophagy-mediated mitochondrial degradation, also termed mitophagy113.
Cancer therapeutics targeting oxygen sensing pathways
As outlined above, the HIFs play important roles in promoting tumor growth and progression through metabolic reprogramming, making them an attractive therapeutic target in cancer117. However, specifically inhibiting these transcription factors has been challenging. In the past, drugs have been developed that inhibit the HIF-α subunits, however with little specificity between the two subunits118. These drugs range in their specific mechanisms of action. For example, some HIF inhibitors block transcriptional activity and DNA binding through inhibiting dimerization of HIF-α with ARNT, or by inhibiting p300 recruitment. Other HIF inhibitory drugs indirectly affect HIF-1α translation, often through pathways that impinge on mTORC1 or EGFR/PI3K signaling. The full list of HIF inhibitors currently under clinical investigation are reviewed elsewhere (see ref.113), but are still an area of active investigation.
Relatively recently, a highly selective HIF-2α inhibitor has been developed, which specifically interrupts HIF-2α and ARNT heterodimerization119. This drug targets a large hydrophobic cavity within HIF-2α. The analogous pocket in HIF-1α is smaller, giving the compound its HIFα isoform specificity, and has promising therapeutic potential for treating cancers such as clear cell renal cell carcinoma, where it has been demonstrated that HIF-2α is particularly critical for disease progression, while HIF-1α is actually a tumor suppressor3. Recently, the crystal structures of HIF-α/ARNT heterodimers have been resolved, confirming the location where the drug inhibits HIF-2α/ARNT dimerization120. Interestingly, Wu and colleagues show that the overall architecture of both HIF-α/ARNT heterodimers is the same, with similar domains interacting at similar sites with ARNT120. However, now that the structure of HIF-α/ARNT binding has been established, new “druggable” sites beyond the hydrophilic pocket in HIF-2α/ARNT may be elucidated. Moreover, selective degradation approaches where targets are ubiquitinated via chemical linkers to E3 ligase machinery components could ultimately allow HIF to be effectively inhibited in a broad spectrum of cancers.
More recent approaches have employed “evofosfamide” or “TH-302”, a pro-drug engaged by hypoxic tumor microenvironments, as a means of treating pancreatic cancer121–123. Here, cytotoxic DNA alkylating agents are activated upon O2 depletion in malignant pancreatic lesions, in an effort to specifically target the most oxygen limited domains of tumors beyond inhibiting HIF itself. The efficacy of this approach, and stratifying patients most likely to respond, are ongoing investigations in the clinic.
Concluding Remarks
Overall, the influence of O2 and nutrient availability on the metabolism of both malignant cells and stromal components of the tumor microenvironment are considerable, and extend well beyond the pVHL/PHD2/HIF axis. Future efforts should reveal how other O2-regulated metabolic adaptations impact the cancer epigenome, cross talk between cancer cells and recruited leukocytes, reactive fibroblasts, and blood vessels, and local invasion/metastasis. All of this integrated information will greatly accelerate the development of novel therapies targeting not only mutated cancer cells, but diploid T cells, B cells, macrophages, etc. and the extracellular matrix, to impart more durable responses to patients with numerous solid and hematological malignancies. As “drugging” genetically and epigenetically unstable cancer cells will likely result in acquired resistance over time, impacting stromal metabolism may be the best option to promote stable disease or remission. Finally, metabolic interventions could be combined with immunotherapeutic approaches, to treat a broad spectrum of malignancies with diverse genetic or epigenetic alterations, in the future.
Figure 5. The autophagic pathway and its regulators.
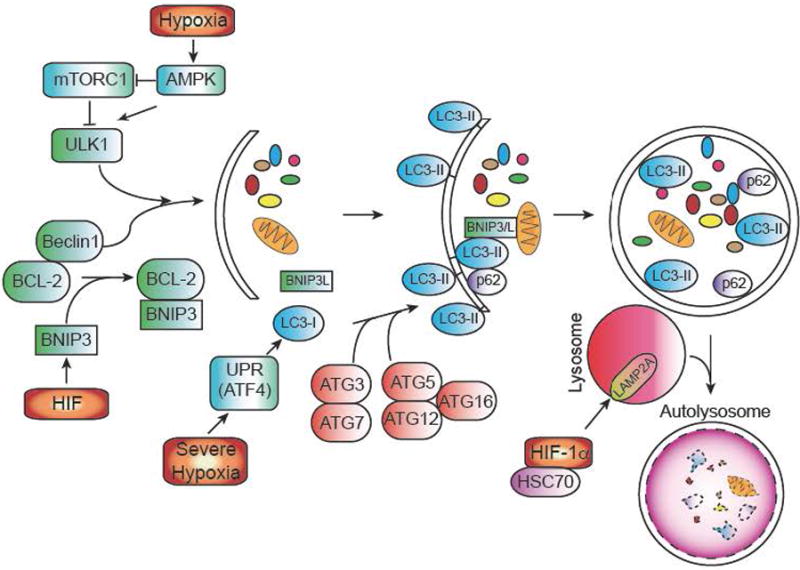
Autophagy (or macroautophagy) is a catabolic process in which double membrane vesicles called autophagosomes sequester and degrade organelles, proteins, and other cytoplasmic constituents in response to cellular stress. The autophagic pathway consists of several steps, including nucleation and sequestration of a phagophore, formation of an autophagosome, and its fusion with a lysosome to form an autolysosome. Initiation and nucleation of the autophagophore begins when several proteins, including ULK1 and Beclin-1, which are inhibited by mTORC1 activity and BCL-2 respectively. BNIP3, a hypoxically induced protein, displaces Beclin 1 from BCL-2. After nucleation, several ATG proteins are involved in the conjugation of phosphatidylethanolamine (PE) to LC3, to form LC3-II. LC3-II is necessary for autophagic membrane expansion, recognition of autophagic cargo, and the fusion of lysosomes to autophagosomes. Another hypoxically induced protein, BNIP3L, is involved in sequestering mitochondria to the autophagosome. p62 functions as an autophagy cargo receptor, which is ultimately degraded when autolysosome forms. Severe hypoxia (<.01% O2) can also activate autophagy in a HIF-independent mechanism through the UPR. Once the autophagosome has formed, it fuses with a lysosome to generate an autolysosome, leading to the degradation of the products inside. Autophagy can also modulate HIF-1α levels as well. Chaperone-mediated autophagy proteins HSC70 and LAMP2A traffic HIF-1α to lysosomes, where it is subsequently degraded.
References
- 1.Lee KE, Simon MC. Snapshot: Hypoxia-Inducible Factors. Cell. 2015 doi: 10.1016/j.cell.2015.11.011. in press. [DOI] [PubMed] [Google Scholar]
- 2.Qiu B, Simon MC. Oncogenes strike a balance between cellular growth and homeostasis. Sem Cell Dev Biol. 2015 doi: 10.1016/j.semcdb.2015.08.005. in press. [DOI] [PMC free article] [PubMed] [Google Scholar]
- 3.Ratcliffe PJ. Oxygen sensing and hypoxia signalling pathways in animals: the implications of physiology for cancer. J Physiol. 2013;591:2027–2042. doi: 10.1113/jphysiol.2013.251470. [DOI] [PMC free article] [PubMed] [Google Scholar]
- 4.Brizel DM, et al. Tumor oxygenation predicts for the likelihood of distant metastases in human soft tissue sarcoma. Cancer Res. 1996;56:941–943. [PubMed] [Google Scholar]
- 5.Hockel M, et al. Intratumoral pO2 predicts survival in advanced cancer of the uterine cervix. Radiother Oncol. 1993;26:45–50. doi: 10.1016/0167-8140(93)90025-4. [DOI] [PubMed] [Google Scholar]
- 6.Pavlova NN, Thompson CB. The Emerging Hallmarks of Cancer Metabolism. Cell Metab. 2016;23:27–47. doi: 10.1016/j.cmet.2015.12.006. [DOI] [PMC free article] [PubMed] [Google Scholar]
- 7.Semenza GL. HIF-1 mediates metabolic responses to intratumoral hypoxia and oncogenic mutations. J Clin Invest. 2013;123:3664–3671. doi: 10.1172/JCI67230. [DOI] [PMC free article] [PubMed] [Google Scholar]
- 8.Semenza GL, et al. Hypoxia response elements in the aldolase A, enolase 1, and lactate dehydrogenase A gene promoters contain essential binding sites for hypoxia-inducible factor 1. J Biol Chem. 1996;271:32529–32537. doi: 10.1074/jbc.271.51.32529. [DOI] [PubMed] [Google Scholar]
- 9.Iyer NV, et al. Cellular and developmental control of O2 homeostasis by hypoxia-inducible factor 1 alpha. Genes Dev. 1998;12:149–162. doi: 10.1101/gad.12.2.149. [DOI] [PMC free article] [PubMed] [Google Scholar]
- 10.Gordan JD, Thompson CB, Simon MC. HIF and c-Myc: sibling rivals for control of cancer cell metabolism and proliferation. Cancer Cell. 2007;12:108–113. doi: 10.1016/j.ccr.2007.07.006. [DOI] [PMC free article] [PubMed] [Google Scholar]
- 11.Kim JW, Tchernyshyov I, Semenza GL, Dang CV. HIF-1-mediated expression of pyruvate dehydrogenase kinase: a metabolic switch required for cellular adaptation to hypoxia. Cell Metab. 2006;3:177–185. doi: 10.1016/j.cmet.2006.02.002. [DOI] [PubMed] [Google Scholar]
- 12.Papandreou I, Cairns RA, Fontana L, Lim AL, Denko NC. HIF-1 mediates adaptation to hypoxia by actively downregulating mitochondrial oxygen consumption. Cell Metab. 2006;3:187–197. doi: 10.1016/j.cmet.2006.01.012. [DOI] [PubMed] [Google Scholar]
- 13.Guzy RD, et al. Mitochondrial complex III is required for hypoxia-induced ROS production and cellular oxygen sensing. Cell Metab. 2005;1:401–408. doi: 10.1016/j.cmet.2005.05.001. [DOI] [PubMed] [Google Scholar]
- 14.Mansfield KD, et al. Mitochondrial dysfunction resulting from loss of cytochrome c impairs cellular oxygen sensing and hypoxic HIF-alpha activation. Cell Metab. 2005;1:393–399. doi: 10.1016/j.cmet.2005.05.003. [DOI] [PMC free article] [PubMed] [Google Scholar]
- 15.Chandel NS, et al. Reactive oxygen species generated at mitochondrial complex III stabilize hypoxia-inducible factor-1alpha during hypoxia: a mechanism of O2 sensing. J Biol Chem. 2000;275:25130–25138. doi: 10.1074/jbc.M001914200. [DOI] [PubMed] [Google Scholar]
- 16.Lee G, et al. Oxidative Dimerization of PHD2 is Responsible for its Inactivation and Contributes to Metabolic Reprogramming via HIF-1alpha Activation. Sci Rep. 2016;6:18928. doi: 10.1038/srep18928. [DOI] [PMC free article] [PubMed] [Google Scholar]
- 17.Dupuy F, et al. PDK1-Dependent Metabolic Reprogramming Dictates Metastatic Potential in Breast Cancer. Cell Metab. 2015;22:577–589. doi: 10.1016/j.cmet.2015.08.007. [DOI] [PubMed] [Google Scholar]
- 18.Doherty JR, Cleveland JL. Targeting lactate metabolism for cancer therapeutics. J Clin Invest. 2013;123:3685–3692. doi: 10.1172/JCI69741. [DOI] [PMC free article] [PubMed] [Google Scholar]
- 19.Fukuda R, et al. HIF-1 regulates cytochrome oxidase subunits to optimize efficiency of respiration in hypoxic cells. Cell. 2007;129:111–122. doi: 10.1016/j.cell.2007.01.047. [DOI] [PubMed] [Google Scholar]
- 20.Tello D, et al. Induction of the mitochondrial NDUFA4L2 protein by HIF-1alpha decreases oxygen consumption by inhibiting Complex I activity. Cell Metab. 2011;14:768–779. doi: 10.1016/j.cmet.2011.10.008. [DOI] [PubMed] [Google Scholar]
- 21.Hervouet E, et al. A new role for the von Hippel-Lindau tumor suppressor protein: stimulation of mitochondrial oxidative phosphorylation complex biogenesis. Carcinogenesis. 2005;26:531–539. doi: 10.1093/carcin/bgi001. [DOI] [PubMed] [Google Scholar]
- 22.Zhang H, et al. HIF-1 inhibits mitochondrial biogenesis and cellular respiration in VHL-deficient renal cell carcinoma by repression of C-MYC activity. Cancer Cell. 2007;11:407–420. doi: 10.1016/j.ccr.2007.04.001. [DOI] [PubMed] [Google Scholar]
- 23.Walter KM, et al. Hif-2alpha promotes degradation of mammalian peroxisomes by selective autophagy. Cell Metab. 2014;20:882–897. doi: 10.1016/j.cmet.2014.09.017. [DOI] [PubMed] [Google Scholar]
- 24.Rao X, et al. O-GlcNAcylation of GP6PD promotes the pentose phosphate pathway and tumor growth. Nat Commun. 2015;6:8468. doi: 10.1038/ncomms9468. [DOI] [PMC free article] [PubMed] [Google Scholar]
- 25.Yi W, et al. Phosphofructokinase 1 glycosylation regulates cell growth and metabolism. Science. 2012;337:975–980. doi: 10.1126/science.1222278. [DOI] [PMC free article] [PubMed] [Google Scholar]
- 26.Cheung EC, Ludwig RL, Vousden KH. Mitochondrial localization of TIGAR under hypoxia stimulates HK2 and lowers ROS and cell death. Proc Natl Acad Sci U S A. 2012;109:20491–20496. doi: 10.1073/pnas.1206530109. [DOI] [PMC free article] [PubMed] [Google Scholar]
- 27.Favaro E, et al. Glucose Utilization via Glycogen Phosphorylase Sustains Proliferation and Prevents Premature Senescence in Cancer Cells. Cell Metab. 2012;16:751–764. doi: 10.1016/j.cmet.2012.10.017. [DOI] [PubMed] [Google Scholar]
- 28.Luo W, et al. Pyruvate Kinase M2 Is a PHD3-Stimulated Coactivator for Hypoxia-Inducible Factor 1. Cell. 2011;145:732–744. doi: 10.1016/j.cell.2011.03.054. [DOI] [PMC free article] [PubMed] [Google Scholar]
- 29.Palsson-McDermott EM, et al. Pyruvate kinase M2 regulates Hif-1alpha activity and IL-1beta induction and is a critical determinant of the warburg effect in LPS-activated macrophages. Cell Metab. 2015;21:65–80. doi: 10.1016/j.cmet.2014.12.005. [DOI] [PMC free article] [PubMed] [Google Scholar]
- 30.Yang W, et al. EGFR-induced and PKCepsilon monoubiquitylation-dependent NF-kappaB activation upregulates PKM2 expression and promotes tumorigenesis. Mol Cell. 2012;48:771–784. doi: 10.1016/j.molcel.2012.09.028. [DOI] [PMC free article] [PubMed] [Google Scholar]
- 31.Jiang Y, et al. PKM2 regulates chromosome segregation and mitosis progression of tumor cells. Mol Cell. 2014;53:75–87. doi: 10.1016/j.molcel.2013.11.001. [DOI] [PMC free article] [PubMed] [Google Scholar]
- 32.Jiang Y, et al. PKM2 phosphorylates MLC2 and regulates cytokinesis of tumour cells. Nat Commun. 2014;5:5566. doi: 10.1038/ncomms6566. [DOI] [PMC free article] [PubMed] [Google Scholar]
- 33.Israelsen WJ, et al. PKM2 Isoform-Specific Deletion Reveals a Differential Requirement for Pyruvate Kinase in Tumor Cells. Cell. 2013;155:397–409. doi: 10.1016/j.cell.2013.09.025. [DOI] [PMC free article] [PubMed] [Google Scholar]
- 34.Li B, et al. Fructose-1,6-bisphosphatase opposes renal carcinoma progression. Nature. 2014;513:251–255. doi: 10.1038/nature13557. [DOI] [PMC free article] [PubMed] [Google Scholar]
- 35.Pollard PJ, Wortham NC, Tomlinson IP. The TCA cycle and tumorigenesis: the examples of fumarate hydratase and succinate dehydrogenase. Ann Med. 2003;35:632–639. doi: 10.1080/07853890310018458. [DOI] [PubMed] [Google Scholar]
- 36.Tomlinson IP, et al. Germline mutations in FH predispose to dominantly inherited uterine fibroids, skin leiomyomata and papillary renal cell cancer. Nat Genet. 2002;30:406–410. doi: 10.1038/ng849. [DOI] [PubMed] [Google Scholar]
- 37.Selak MA, et al. Succinate links TCA cycle dysfunction to oncogenesis by inhibiting HIF-alpha prolyl hydroxylase. Cancer Cell. 2005;7:77–85. doi: 10.1016/j.ccr.2004.11.022. [DOI] [PubMed] [Google Scholar]
- 38.Isaacs JS, et al. HIF overexpression correlates with biallelic loss of fumarate hydratase in renal cancer: Novel role of fumarate in regulation of HIF stability. Cancer Cell. 2005;8:143–153. doi: 10.1016/j.ccr.2005.06.017. [DOI] [PubMed] [Google Scholar]
- 39.Koivunen P, et al. Inhibition of hypoxia-inducible factor (HIF) hydroxylases by citric acid cycle intermediates: possible links between cell metabolism and stabilization of HIF. J Biol Chem. 2007;282:4524–4532. doi: 10.1074/jbc.M610415200. [DOI] [PubMed] [Google Scholar]
- 40.Masson N, William C, Maxwell PH, Pugh CW, Ratcliffe PJ. Independent function of two destruction domains in hypoxia-inducible factor-alpha chains activated by prolyl hydroxylation. Embo J. 2001;20:5197–5206. doi: 10.1093/emboj/20.18.5197. [DOI] [PMC free article] [PubMed] [Google Scholar]
- 41.Adam J, et al. Renal cyst formation in Fh1-deficient mice is independent of the Hif/Phd pathway: roles for fumarate in KEAP1 succination and Nrf2 signaling. Cancer Cell. 2011;20:524–537. doi: 10.1016/j.ccr.2011.09.006. [DOI] [PMC free article] [PubMed] [Google Scholar]
- 42.Markolovic S, Wilkins SE, Schofield CJ. Protein Hydroxylation Catalyzed by 2-Oxoglutarate-dependent Oxygenases. J Biol Chem. 2015;290:20712–20722. doi: 10.1074/jbc.R115.662627. [DOI] [PMC free article] [PubMed] [Google Scholar]
- 43.Laukka T, et al. Fumarate and Succinate Regulate Expression of Hypoxia-inducible Genes via TET Enzymes. J Biol Chem. 2016;291:4256–4265. doi: 10.1074/jbc.M115.688762. [DOI] [PMC free article] [PubMed] [Google Scholar]
- 44.Xu W, et al. Oncometabolite 2-hydroxyglutarate is a competitive inhibitor of alpha-ketoglutarate-dependent dioxygenases. Cancer Cell. 2011;19:17–30. doi: 10.1016/j.ccr.2010.12.014. [DOI] [PMC free article] [PubMed] [Google Scholar]
- 45.Ward PS, et al. The common feature of leukemia-associated IDH1 and IDH2 mutations is a neomorphic enzyme activity converting alpha-ketoglutarate to 2-hydroxyglutarate. Cancer Cell. 2010;17:225–234. doi: 10.1016/j.ccr.2010.01.020. [DOI] [PMC free article] [PubMed] [Google Scholar]
- 46.Koivunen P, et al. Transformation by the (R)-enantiomer of 2-hydroxyglutarate linked to EGLN activation. Nature. 2012;483:484–488. doi: 10.1038/nature10898. [DOI] [PMC free article] [PubMed] [Google Scholar]
- 47.Tarhonskaya H, et al. Non-enzymatic chemistry enables 2-hydroxyglutarate-mediated activation of 2-oxoglutarate oxygenases. Nat Commun. 2014;5:3423. doi: 10.1038/ncomms4423. [DOI] [PMC free article] [PubMed] [Google Scholar]
- 48.Nytko KJ, et al. Vitamin C is dispensable for oxygen sensing in vivo. Blood. 2011;117:5485–5493. doi: 10.1182/blood-2010-09-307637. [DOI] [PMC free article] [PubMed] [Google Scholar]
- 49.Knowles HJ, Raval RR, Harris AL, Ratcliffe PJ. Effect of ascorbate on the activity of hypoxia-inducible factor in cancer cells. Cancer Res. 2003;63:1764–1768. [PubMed] [Google Scholar]
- 50.Knowles HJ, Mole DR, Ratcliffe PJ, Harris AL. Normoxic stabilization of hypoxia-inducible factor-1alpha by modulation of the labile iron pool in differentiating U937 macrophages: effect of natural resistance-associated macrophage protein 1. Cancer Res. 2006;66:2600–2607. doi: 10.1158/0008-5472.CAN-05-2351. [DOI] [PubMed] [Google Scholar]
- 51.Kuiper C, Dachs GU, Currie MJ, Vissers MC. Intracellular ascorbate enhances hypoxia-inducible factor (HIF)-hydroxylase activity and preferentially suppresses the HIF-1 transcriptional response. Free Radic Biol Med. 2014;69:308–317. doi: 10.1016/j.freeradbiomed.2014.01.033. [DOI] [PubMed] [Google Scholar]
- 52.Kuiper C, et al. Increased Tumor Ascorbate is Associated with Extended Disease-Free Survival and Decreased Hypoxia-Inducible Factor-1 Activation in Human Colorectal Cancer. Front Oncol. 2014;4:10. doi: 10.3389/fonc.2014.00010. [DOI] [PMC free article] [PubMed] [Google Scholar]
- 53.Ramakrishnan SK, Shah YM. Role of Intestinal HIF-2alpha in Health and Disease. Annu Rev Physiol. 2016;78:301–325. doi: 10.1146/annurev-physiol-021115-105202. [DOI] [PMC free article] [PubMed] [Google Scholar]
- 54.Mastrogiannaki M, Matak P, Peyssonnaux C. The gut in iron homeostasis: role of HIF-2 under normal and pathological conditions. Blood. 2013;122:885–892. doi: 10.1182/blood-2012-11-427765. [DOI] [PMC free article] [PubMed] [Google Scholar]
- 55.Zimmer M, et al. Small-molecule inhibitors of HIF-2a translation link its 5′UTR iron-responsive element to oxygen sensing. Mol Cell. 2008;32:838–848. doi: 10.1016/j.molcel.2008.12.004. [DOI] [PMC free article] [PubMed] [Google Scholar]
- 56.Gruber M, et al. Acute postnatal ablation of Hif-2alpha results in anemia. Proc Natl Acad Sci U S A. 2007;104:2301–2306. doi: 10.1073/pnas.0608382104. [DOI] [PMC free article] [PubMed] [Google Scholar]
- 57.Rankin EB, et al. Hypoxia-inducible factor-2 (HIF-2) regulates hepatic erythropoietin in vivo. J Clin Invest. 2007;117:1068–1077. doi: 10.1172/JCI30117. [DOI] [PMC free article] [PubMed] [Google Scholar]
- 58.Wise DR, et al. Hypoxia promotes isocitrate dehydrogenase-dependent carboxylation of alpha-ketoglutarate to citrate to support cell growth and viability. Proc Natl Acad Sci U S A. 2011;108:19611–19616. doi: 10.1073/pnas.1117773108. [DOI] [PMC free article] [PubMed] [Google Scholar]
- 59.Metallo CM, et al. Reductive glutamine metabolism by IDH1 mediates lipogenesis under hypoxia. Nature. 2012;481:380–384. doi: 10.1038/nature10602. [DOI] [PMC free article] [PubMed] [Google Scholar]
- 60.Mullen AR, et al. Oxidation of alpha-ketoglutarate is required for reductive carboxylation in cancer cells with mitochondrial defects. Cell Rep. 2014;7:1679–1690. doi: 10.1016/j.celrep.2014.04.037. [DOI] [PMC free article] [PubMed] [Google Scholar]
- 61.Sun RC, Denko NC. Hypoxic regulation of glutamine metabolism through HIF1 and SIAH2 supports lipid synthesis that is necessary for tumor growth. Cell Metab. 2014;19:285–292. doi: 10.1016/j.cmet.2013.11.022. [DOI] [PMC free article] [PubMed] [Google Scholar]
- 62.Schug ZT, et al. Acetyl-CoA synthetase 2 promotes acetate utilization and maintains cancer cell growth under metabolic stress. Cancer Cell. 2015;27:57–71. doi: 10.1016/j.ccell.2014.12.002. [DOI] [PMC free article] [PubMed] [Google Scholar]
- 63.Comerford SA, et al. Acetate dependence of tumors. Cell. 2014;159:1591–1602. doi: 10.1016/j.cell.2014.11.020. [DOI] [PMC free article] [PubMed] [Google Scholar]
- 64.Mashimo T, et al. Acetate is a bioenergetic substrate for human glioblastoma and brain metastases. Cell. 2014;159:1603–1614. doi: 10.1016/j.cell.2014.11.025. [DOI] [PMC free article] [PubMed] [Google Scholar]
- 65.Ackerman D, Simon MC. Hypoxia, lipids, and cancer: surviving the harsh tumor microenvironment. Trends Cell Biol. 2014;24:472–478. doi: 10.1016/j.tcb.2014.06.001. [DOI] [PMC free article] [PubMed] [Google Scholar]
- 66.Duvel K, et al. Activation of a metabolic gene regulatory network downstream of mTOR complex 1. Mol Cell. 2010;39:171–183. doi: 10.1016/j.molcel.2010.06.022. [DOI] [PMC free article] [PubMed] [Google Scholar]
- 67.Porstmann T, et al. SREBP activity is regulated by mTORC1 and contributes to Akt-dependent cell growth. Cell Metab. 2008;8:224–236. doi: 10.1016/j.cmet.2008.07.007. [DOI] [PMC free article] [PubMed] [Google Scholar]
- 68.Zaidi N, et al. Lipogenesis and lipolysis: the pathways exploited by the cancer cells to acquire fatty acids. Prog Lipid Res. 2013;52:585–589. doi: 10.1016/j.plipres.2013.08.005. [DOI] [PMC free article] [PubMed] [Google Scholar]
- 69.Menendez JA, Lupu R. Fatty acid synthase and the lipogenic phenotype in cancer pathogenesis. Nat Rev Cancer. 2007;7:763–777. doi: 10.1038/nrc2222. [DOI] [PubMed] [Google Scholar]
- 70.Kuemmerle NB, et al. Lipoprotein lipase links dietary fat to solid tumor cell proliferation. Mol Cancer Ther. 2011;10:427–436. doi: 10.1158/1535-7163.MCT-10-0802. [DOI] [PMC free article] [PubMed] [Google Scholar]
- 71.Young RM, et al. Dysregulated mTORC1 renders cells critically dependent on desaturated lipids for survival under tumor-like stress. Genes Dev. 2013;27:1115–1131. doi: 10.1101/gad.198630.112. [DOI] [PMC free article] [PubMed] [Google Scholar]
- 72.Wang D, Wei Y, Pagliassotti MJ. Saturated fatty acids promote endoplasmic reticulum stress and liver injury in rats with hepatic steatosis. Endocrinology. 2006;147:943–951. doi: 10.1210/en.2005-0570. [DOI] [PubMed] [Google Scholar]
- 73.Kamphorst JJ, et al. Hypoxic and Ras-transformed cells support growth by scavenging unsaturated fatty acids from lysophospholipids. PNAS. 2013;110:8882–8887. doi: 10.1073/pnas.1307237110. [DOI] [PMC free article] [PubMed] [Google Scholar]
- 74.Qiu B, et al. HIF-2alpha dependent lipid storage promotes endoplasmic reticulum homeostasis in clear cell renal cell carcinoma. Cancer Discov. 2015;5:652–657. doi: 10.1158/2159-8290.CD-14-1507. [DOI] [PMC free article] [PubMed] [Google Scholar]
- 75.Bensaad K, et al. Fatty acid uptake and lipid storage induced by HIF-1alpha contribute to cell growth and survival after hypoxia-reoxygenation. Cell Rep. 2014;9:349–365. doi: 10.1016/j.celrep.2014.08.056. [DOI] [PubMed] [Google Scholar]
- 76.Lu C, et al. IDH mutation impairs histone demethylation and results in a block to cell differentiation. Nature. 2012;483:474–478. doi: 10.1038/nature10860. [DOI] [PMC free article] [PubMed] [Google Scholar]
- 77.Chowdhury R, et al. The oncometabolite 2-hydroxyglutarate inhibits histone lysine demethylases. EMBO Rep. 2011;12:463–469. doi: 10.1038/embor.2011.43. [DOI] [PMC free article] [PubMed] [Google Scholar]
- 78.Losman JA, et al. (R)-2-hydroxyglutarate is sufficient to promote leukemogenesis and its effects are reversible. Science. 2013;339:1621–1625. doi: 10.1126/science.1231677. [DOI] [PMC free article] [PubMed] [Google Scholar]
- 79.Intlekofer AM, et al. Hypoxia Induces Production of L-2-Hydroxyglutarate. Cell Metab. 2015;22:304–311. doi: 10.1016/j.cmet.2015.06.023. [DOI] [PMC free article] [PubMed] [Google Scholar]
- 80.Oldham WM, Clish CB, Yang Y, Loscalzo J. Hypoxia-Mediated Increases in L-2-hydroxyglutarate Coordinate the Metabolic Response to Reductive Stress. Cell Metab. 2015;22:291–303. doi: 10.1016/j.cmet.2015.06.021. [DOI] [PMC free article] [PubMed] [Google Scholar]
- 81.Harris ALA. New Hydroxy Metabolite of 2-Oxoglutarate Regulates Metabolism in Hypoxia. Cell Metab. 2015;22:198–200. doi: 10.1016/j.cmet.2015.07.016. [DOI] [PubMed] [Google Scholar]
- 82.Shim EH, et al. l-2-Hydroxyglutarate: An Epigenetic Modifier and Putative Oncometabolite in Renal Cancer. Cancer Discov. 2014;4:1290–1298. doi: 10.1158/2159-8290.CD-13-0696. [DOI] [PMC free article] [PubMed] [Google Scholar]
- 83.Lee DC, et al. A lactate-induced response to hypoxia. Cell. 2015;161:595–609. doi: 10.1016/j.cell.2015.03.011. [DOI] [PubMed] [Google Scholar]
- 84.Loenarz C, Schofield CJ. Expanding chemical biology of 2-oxoglutarate oxygenases. Nat Chem Biol. 2008;4:152–156. doi: 10.1038/nchembio0308-152. [DOI] [PubMed] [Google Scholar]
- 85.Hirsila M, et al. Effect of desferrioxamine and metals on the hydroxylases in the oxygen sensing pathway. Faseb J. 2005 doi: 10.1096/fj.04-3399fje. [DOI] [PubMed] [Google Scholar]
- 86.Koivunen P, Hirsila M, Kivirikko KI, Myllyharju J. The length of peptide substrates has a marked effect on hydroxylation by the hypoxia-inducible factor prolyl 4-hydroxylases. J Biol Chem. 2006;281:28712–28720. doi: 10.1074/jbc.M604628200. [DOI] [PubMed] [Google Scholar]
- 87.Hewitson KS, et al. Structural and mechanistic studies on the inhibition of the hypoxia-inducible transcription factor hydroxylases by tricarboxylic acid cycle intermediates. J Biol Chem. 2007;282:3293–3301. doi: 10.1074/jbc.M608337200. [DOI] [PubMed] [Google Scholar]
- 88.Pan Y, et al. Multiple factors affecting cellular redox status and energy metabolism modulate hypoxia-inducible factor prolyl hydroxylase activity in vivo and in vitro. Mol Cell Biol. 2007;27:912–925. doi: 10.1128/MCB.01223-06. [DOI] [PMC free article] [PubMed] [Google Scholar]
- 89.Laplante M, Sabatini DM. mTOR Signaling in Growth Control and Disease. Cell. 2012;149:274–293. doi: 10.1016/j.cell.2012.03.017. [DOI] [PMC free article] [PubMed] [Google Scholar]
- 90.Sarbassov DD, Guertin DA, Ali SM, Sabatini DM. Phosphorylation and regulation of Akt/PKB by the rictor-mTOR complex. Science. 2005;307:1098–1101. doi: 10.1126/science.1106148. [DOI] [PubMed] [Google Scholar]
- 91.Deberardinis RJ, Sayed N, Ditsworth D, Thompson CB. Brick by brick: metabolism and tumor cell growth. Curr Opin Genet Dev. 2008;18:54–61. doi: 10.1016/j.gde.2008.02.003. [DOI] [PMC free article] [PubMed] [Google Scholar]
- 92.Liu L, et al. Hypoxia-induced energy stress regulates mRNA translation and cell growth. Mol Cell. 2006;21:521–531. doi: 10.1016/j.molcel.2006.01.010. [DOI] [PMC free article] [PubMed] [Google Scholar]
- 93.Brugarolas JB, Vazquez F, Reddy A, Sellers WR, Kaelin WG., Jr TSC2 regulates VEGF through mTOR-dependent and -independent pathways. Cancer Cell. 2003;4:147–158. doi: 10.1016/s1535-6108(03)00187-9. [DOI] [PubMed] [Google Scholar]
- 94.Faubert B, et al. Loss of the tumor suppressor LKB1 promotes metabolic reprogramming of cancer cells via HIF-1alpha. Proc Natl Acad Sci U S A. 2014;111:2554–2559. doi: 10.1073/pnas.1312570111. [DOI] [PMC free article] [PubMed] [Google Scholar]
- 95.Brugarolas J, et al. Regulation of mTOR function in response to hypoxia by REDD1 and the TSC1/TSC2 tumor suppressor complex. Genes Dev. 2004;18:2893–2904. doi: 10.1101/gad.1256804. [DOI] [PMC free article] [PubMed] [Google Scholar]
- 96.Reiling JH, Hafen E. The hypoxia-induced paralogs Scylla and Charybdis inhibit growth by down-regulating S6K activity upstream of TSC in Drosophila. Genes Dev. 2004;18:2879–2892. doi: 10.1101/gad.322704. [DOI] [PMC free article] [PubMed] [Google Scholar]
- 97.Corradetti MN, Inoki K, Guan KL. The stress-inducted proteins RTP801 and RTP801L are negative regulators of the mammalian target of rapamycin pathway. J Biol Chem. 2005;280:9769–9772. doi: 10.1074/jbc.C400557200. [DOI] [PubMed] [Google Scholar]
- 98.Miyazaki M, Esser KA. REDD2 is enriched in skeletal muscle and inhibits mTOR signaling in response to leucine and stretch. Am J Physiol Cell Physiol. 2009;296:C583–592. doi: 10.1152/ajpcell.00464.2008. [DOI] [PMC free article] [PubMed] [Google Scholar]
- 99.Elorza A, et al. HIF2alpha Acts as an mTORC1 Activator through the Amino Acid Carrier SLC7A5. Mol Cell. 2012;48:681–691. doi: 10.1016/j.molcel.2012.09.017. [DOI] [PubMed] [Google Scholar]
- 100.Keith B, Johnson RS, Simon MC. HIF1alpha and HIF2alpha: sibling rivalry in hypoxic tumour growth and progression. Nat Rev Cancer. 2012;12:9–22. doi: 10.1038/nrc3183. [DOI] [PMC free article] [PubMed] [Google Scholar]
- 101.Sancak Y, et al. The Rag GTPases bind raptor and mediate amino acid signaling to mTORC1. Science. 2008;320:1496–1501. doi: 10.1126/science.1157535. [DOI] [PMC free article] [PubMed] [Google Scholar]
- 102.Kim E, Goraksha-Hicks P, Li L, Neufeld TP, Guan KL. Regulation of TORC1 by Rag GTPases in nutrient response. Nat Cell Biol. 2008;10:935–945. doi: 10.1038/ncb1753. [DOI] [PMC free article] [PubMed] [Google Scholar]
- 103.Gulati P, et al. Amino acids activate mTOR complex 1 via Ca2+/CaM signaling to hVps34. Cell Metab. 2008;7:456–465. doi: 10.1016/j.cmet.2008.03.002. [DOI] [PMC free article] [PubMed] [Google Scholar]
- 104.Chen S, et al. CaMKII is involved in cadmium activation of MAPK and mTOR pathways leading to neuronal cell death. J Neurochem. 2011;119:1108–1118. doi: 10.1111/j.1471-4159.2011.07493.x. [DOI] [PMC free article] [PubMed] [Google Scholar]
- 105.Nakazawa MS, et al. Epigenetic re-expression of HIF-2alpha suppresses soft tissue sarcoma growth. Nat Commun. 2016;7:10539. doi: 10.1038/ncomms10539. [DOI] [PMC free article] [PubMed] [Google Scholar]
- 106.Mathew R, Karantza-Wadsworth V, White E. Role of autophagy in cancer. Nat Rev Cancer. 2007;7:961–967. doi: 10.1038/nrc2254. [DOI] [PMC free article] [PubMed] [Google Scholar]
- 107.Levine B, Kroemer G. Autophagy in the pathogenesis of disease. Cell. 2008;132:27–42. doi: 10.1016/j.cell.2007.12.018. [DOI] [PMC free article] [PubMed] [Google Scholar]
- 108.Morselli E, et al. Anti- and pro-tumor functions of autophagy. Biochim Biophys Acta. 2009;1793:1524–1532. doi: 10.1016/j.bbamcr.2009.01.006. [DOI] [PubMed] [Google Scholar]
- 109.Egan DF, et al. Phosphorylation of ULK1 (hATG1) by AMP-activated protein kinase connects energy sensing to mitophagy. Science. 2011;331:456–461. doi: 10.1126/science.1196371. [DOI] [PMC free article] [PubMed] [Google Scholar]
- 110.Rouschop KM, et al. The unfolded protein response protects human tumor cells during hypoxia through regulation of the autophagy genes MAP1LC3B and ATG5. J Clin Invest. 2010;120:127–141. doi: 10.1172/JCI40027. [DOI] [PMC free article] [PubMed] [Google Scholar]
- 111.Maiuri MC, Zalckvar E, Kimchi A, Kroemer G. Self-eating and self-killing: crosstalk between autophagy and apoptosis. Nat Rev Mol Cell Biol. 2007;8:741–752. doi: 10.1038/nrm2239. [DOI] [PubMed] [Google Scholar]
- 112.Pattingre S, et al. Bcl-2 antiapoptotic proteins inhibit Beclin 1-dependent autophagy. Cell. 2005;122:927–939. doi: 10.1016/j.cell.2005.07.002. [DOI] [PubMed] [Google Scholar]
- 113.Rubinsztein DC, Codogno P, Levine B. Autophagy modulation as a potential therapeutic target for diverse diseases. Nat Rev Drug Discov. 2012;11:709–730. doi: 10.1038/nrd3802. [DOI] [PMC free article] [PubMed] [Google Scholar]
- 114.Gupta A, et al. Autophagy inhibition and antimalarials promote cell death in gastrointestinal stromal tumor (GIST) Proc Natl Acad Sci U S A. 2010;107:14333–14338. doi: 10.1073/pnas.1000248107. [DOI] [PMC free article] [PubMed] [Google Scholar]
- 115.Yamamoto A, et al. Bafilomycin A1 prevents maturation of autophagic vacuoles by inhibiting fusion between autophagosomes and lysosomes in rat hepatoma cell line, H-4-II-E cells. Cell Struct Funct. 1998;23:33–42. doi: 10.1247/csf.23.33. [DOI] [PubMed] [Google Scholar]
- 116.Bellot G, et al. Hypoxia-induced autophagy is mediated through hypoxia-inducible factor induction of BNIP3 and BNIP3L via their BH3 domains. Mol Cell Biol. 2009;29:2570–2581. doi: 10.1128/MCB.00166-09. [DOI] [PMC free article] [PubMed] [Google Scholar]
- 117.Bertout JA, Patel SA, Simon MC. The impact of O2 availability on human cancer. Nat Rev Cancer. 2008;8:967–975. doi: 10.1038/nrc2540. [DOI] [PMC free article] [PubMed] [Google Scholar]
- 118.Semenza GL. HIF-1 inhibitors for cancer therapy: from gene expression to drug discovery. Curr Pharm Des. 2009;15:3839–3843. doi: 10.2174/138161209789649402. CPD-G. L. Semenza (Kietzman) [pii] [DOI] [PubMed] [Google Scholar]
- 119.Scheuermann TH, et al. Allosteric inhibition of hypoxia inducible factor-2 with small molecules. Nat Chem Biol. 2013;9:271–276. doi: 10.1038/nchembio.1185. [DOI] [PMC free article] [PubMed] [Google Scholar]
- 120.Wu D, Potluri N, Lu J, Kim Y, Rastinejad F. Structural integration in hypoxia-inducible factors. Nature. 2015;524:303–308. doi: 10.1038/nature14883. [DOI] [PubMed] [Google Scholar]
- 121.Pourmorteza M, Rahman ZU, Young M. Evofosfamide, a new horizon in the treatment of pancreatic cancer. Anticancer Drugs. 2016 doi: 10.1097/CAD.0000000000000386. [DOI] [PubMed] [Google Scholar]
- 122.Lohse I, et al. Targeting hypoxic microenvironment of pancreatic xenografts with the hypoxia-activated prodrug TH-302. Oncotarget. 2016 doi: 10.18632/oncotarget.9654. [DOI] [PMC free article] [PubMed] [Google Scholar]
- 123.Zhang X, et al. MR Imaging Biomarkers to Monitor Early Response to Hypoxia-Activated Prodrug TH-302 in Pancreatic Cancer Xenografts. PLoS One. 2016;11:e0155289. doi: 10.1371/journal.pone.0155289. [DOI] [PMC free article] [PubMed] [Google Scholar]