

Abstract
In countries with low mortality rates, the quality of the years of life is more important to consider than total life expectancy (TLE). Disability-free life expectancy (DFLE) is one of the most relevant indicators of health and the quality of life. This paper aims to estimate TLE and DFLE with four levels of severity of disability and to explore gender and educational differences in older French people. In this cohort study, four levels of disability severity were distinguished, disability being evaluated for mobility, instrumental and basic activities of daily living. For each level, TLE and DFLE were calculated using multi-state models from transition probabilities. From the population of two areas of South West France 3,777 subjects were randomly selected from the electoral rolls. At the baseline, they were aged 65 years and over, living in the community and were interviewed 6 times over the 10-year follow-up. At age 65, women lived longer than men (4.5 extra years), but shorter fully independent lives (−2.2 years). They also lived longer in each of the three degrees of disability (+4.2 years with moderate or severe disability). The higher educated lived longer (1.3 extra years at age 65), with the additional years free of disability. Regardless of age, gender and education, there appeared to be a 1-year incompressible time spent with severe disability. To conclude, these are the first health expectancies based on the longitudinal data for France. Whilst most of the studies were based on cross-sectional data, this paper gives a more realistic indicator of the health and socio-economic inequalities in France in the 1990 s.
Keywords: Disability-free life expectancy, Longitudinal survey, Markov chains, Education, Aged
Introduction
Many countries worldwide are experiencing an ageing of their populations and France is no exception. Indeed, France has one of the highest life expectancies in the world and the highest within Europe (Cambois and Robine 1996; Robine et al. 2002). There is much evidence worldwide for inequities in life expectancy by gender (lower for men than women) or socially disadvantaged groups (lower for the less educated or black people) (Guralnik et al. 1993; Jitapunkul et al. 2003; Robine et al. 2002; Valkonen et al. 1997). However, the important question is no longer whether inequities in life expectancy exist but rather the quality of the extra years lived. In countries with low mortalityrates, there is a fear of an Expansion of morbidity (Gruenberg 1977), the increase in life expectancy in good health being not as great as the mortality decline. The classic health indicators based on mortality or on morbidity are insufficient to rigorously study the population’s health. Health expectancies bringing together mortality and morbidity indicators are currently the most relevant indicators. Disability-free life expectancy (DFLE), which is relatively easy to calculate, is one of the most widely accepted and used indicator to describe health status and monitor trends, to study health inequalities in different population groups and to evaluate health needs (Gutierrez-Fisac et al. 2000). Such data for France is sparse, though a recent World Health Organization report comparing 191 countries found that France had the third highest healthy life expectancy after Japan and Australia (Mathers et al. 2001), results that were confirmed in Europe in the European Community Household Panel (Robine et al. 2002). Several reports have stated that the extra years gained by women are spent with disability or in poorer health (Crimmins et al. 1996; Robine et al. 1999), but we are not clear whether the additional years gained by socially advantaged groups are spent in good or poor health. Most studies would suggest that the socially advantaged have longer total and healthy life expectancy and that inequalities are greater for healthy life than for total life expectancy (TLE) (Crimmins and Cambois 2003).
However, there are two important limitations with the current literature on differentials in healthy life expectancy by socio-demographic disadvantage, which this paper aims to address. First, most are based on cross-sectional data, which are less costly and more readily available than panel surveys. Here we used longitudinal data that give a much more realistic indicator of health over a time period, as multi-state life tables explicitly take into account the onset of ill-health as well as the possibility of recovery as people age (Laditka and Haywards 2003). Second, most studies view disability as a dichotomy (with and without). Though this can elucidate whether compression or expansion of disability is present, it cannot examine the scenario of Manton (1982) where disability as a whole may increase though the severity may lessen.
Therefore, we aim to describe in an older French population gender and educational differentials in TLE and DFLE with longitudinal data, thus observing older people moving through a range of severities of disability as they age.
Methods
Study population
We used data from the PAQUID (“Personnes Agées QUID”) cohort, a study of cognitive and functional ageing. The sample was randomly selected from the electoral rolls in 1988 from Gironde and Dordogne, two administrative areas of south–west France. This sample included 3,777 subjects aged 65 years and over at the baseline, living in the community and was representative of the age–sex distribution of the elders of the area (Dartigues et al. 1991). This research has been approved by the ethics committee of the Centre Hospitalo–Universitaire of Bordeaux, and conformed to the principles embodied in the Declaration of Helsinki. The participants were initially interviewed at home by a psychologist and similarly re-interviewed 1, 3, 5, 8 and 10 years after the baseline visit. Socio-demographic, environmental and health related factors were collected at each follow-up. The general methodology has been described previously (Barberger-Gateau et al. 1992; Dartigues et al. 1991).
Disability indicators
We used a four-grade hierarchic indicator of disability (Barberger-Gateau et al. 2000), combining three disability scales: basic and instrumental activities of daily living (ADL and IADL) and mobility. The ADL of the Katz scale evaluated the ability for bathing, dressing, toileting, transferring and feeding (Katz et al. 1970). The IADL included telephoning, shopping, use of transport, responsibility for one’s own medication and the ability to handle finances (Lawton and Brody 1969). As recommended by Lawton, the ability for three supplementary activities was evaluated only for women: meal preparation, housekeeping and doing laundry (Lawton and Brody 1969). Mobility was evaluated by three activities of the Rosow’s scale: doing heavy work around the house, walking half a mile and moving up and down to the second floor (Rosow and Breslau 1966). For each scale, the subjects were considered as disabled if they could not perform at least one activity without help. If disability was missing in at least one scale, the hierarchic indicator could not be used, but this case concerned less than 20 subjects at each visit. The development of the disability indicator has been described in more detail (Barberger-Gateau et al. 2000). This hierarchic indicator of disability ranges from full independence (independence in each of the three scales) to severe disability (mobility- and IADL- and ADL-disability). Mild disability is defined as the restriction in only mobility, whereas moderate disability is the restriction in mobility and IADL. This hierarchic scale fitted 99.3% of the subjects at the baseline and is an almost perfect Guttmann scale (Barberger-Gateau et al. 2000). We successively calculated TLE and DFLE by gender and educational level; the higher educated were those achieving at least the Certificat d’Etudes Primaires (CEP), the first French diploma corresponding to about 7 years of schooling. Four levels of disability severity were distinguished: none, mild, moderate and severe disability. Since most of the subjects were mobility-restricted (74%) and those that were only restricted (i.e. mild disability) were relatively independent in daily living, we also analysed disability as a dichotomy, distinguishing “active” and “inactive” state. As defined by Manton and Stallard (1991), we defined “Active” Life expectancy (ALE) by the number of years a person can expect to live free of “serious” disability. Thus, we defined “active” as having none or mild disability and “inactive” as having moderate or severe disability, these definitions resulting in estimates of active life expectancy and inactive life expectancy (ILE).
Statistical analyses
Life expectancies were calculated using the IMaCh (Interpolated Markov Chain) software version 0.94 (Lievre et al. 2003), which fits a multinomial logistic regression to model the transition probabilities to and from disability and to death with age. IMaCh used these transition probabilities in a multi-state life table to calculate life expectancies in each disability state. This computer program can deal with different delays between waves for each individual or missing data. The information is thus not rounded or lost, but taken into account by interpolation or extrapolation. Using the data collected over the 10-year follow-up during the 6 successive visits, the incidence data in the consecutive follow-up intervals collapsed in the analyses. These calculations provided estimations of TLE, DFLE and 95% confidence intervals were calculated from the standard deviations of the life expectancies. Chi-square tests were used to analyse statistical associations of vital status with sex and education.
Results
Sample description
Among the 3,777 initial participants of PAQUID, we excluded 293 subjects who survived but had only one interview. Those were subjects younger, more often women, less educated, less often disabled at the baseline (36.0% were fully independent vs 24.7% of the others) and had a very low mortality rate compared with the others (19.1% over the 10-year follow-up vs 45.6%). The sample studied here included 3,484 subjects with a mean age of 75.5 years at the baseline (SD=6.9), 58.3% were women and 35.5% were less educated. At the baseline, 24.7% were fully independent, 44.5% mildly disabled (only mobility-disabled), 26.0% moderately disabled (mobility and IADL-disabled) and 4.8% severely disabled (mobility- and IADL- and ADL-disabled). Table 1 presents the description of the 6 visits by age, gender, education, disability and vital status. At each visit, subjects who refused to participate or were lost to follow-up were significantly more often women and were less educated, but no differences were observed by age. Over the 10-year follow-up, 1,606 subjects died (46.1%), death being significantly more frequent among men (49.7 vs 37.4% in women, P<0.0001) and those with less education (50.1 vs 38.4% in the higher educated, P<0.0001).
Table 1.
Description of the 6 waves over the 10-year follow-up by age, gender, education, disability and vital status—the PAQUID cohort, 1988–1998
| Visit at T0 | Visit at T1 | Visit at T3 | Visit at T5 | Visit at T8 | Visit at T10 | |||||||
|---|---|---|---|---|---|---|---|---|---|---|---|---|
| N | % | N | % | N | % | N | % | N | % | N | % | |
| Visited | 3,484 | 1,849a | 74.6b | 2,311 | 77.3b | 2,080 | 79.1b | 1,566 | 72.0b | 1,461 | 77.8b | |
| Refusals, lost to follow-up | 169 | 4.5 | 963 | 25.5 | 814 | 21.6 | 921 | 24.4 | 747 | 19.8 | ||
| Deceased | 0 | 172 | 4.9 | 493 | 14.1 | 856 | 24.6 | 1,309 | 37.6 | 1,606 | 46.1 | |
| Age (standard deviation) | 75.5 | (6.9) | 76.1 | (6.9) | 77.8 | (6.5) | 79.1 | (6.1) | 81.0 | (5.7) | 82.7 | (5.4) |
| Female gender | 2,031 | 58.3 | 1,081 | 58.5 | 1,335 | 57.8 | 1,241 | 59.7 | 941 | 60.1 | 923 | 63.2 |
| Low level of education | 1,237 | 35.5 | 555 | 30.0 | 716 | 31.0 | 627 | 30.1 | 456 | 29.1 | 422 | 28.9 |
| Disability | ||||||||||||
| Full independence | 858 | 24.7 | 435 | 23.8 | 618 | 26.7 | 596 | 29.0 | 351 | 22.7 | 226 | 15.7 |
| Mild disability | 1,546 | 44.5 | 864 | 47.3 | 905 | 39.2 | 713 | 34.8 | 539 | 34.9 | 510 | 35.4 |
| Moderate disability | 903 | 26.0 | 452 | 24.8 | 645 | 27.9 | 589 | 28.7 | 497 | 32.2 | 505 | 35.1 |
| Severe disability | 168 | 4.8 | 75 | 4.1 | 142 | 6.2 | 153 | 7.5 | 158 | 10.2 | 199 | 13.8 |
aThe visit at T1 was only conducted on the subjects selected in the Gironde area
bProportion of subjects visited among the survivors at each follow-up
Gender differentials
In terms of transition probabilities, women were more likely to transit towards disability or more severe disability than men, especially from full independence. The probabilities obtained at age 65 are presented Table 2. The transition probabilities from full independence to any level of disability (0→123) were 11% in men and 19% in women at age 65, this difference increasing with age to reach 35 and 51%, respectively, at age 85 (data not shown). Women were more likely to recover from disability than men, except for recovering full independence, with 34% of recovery in men versus 24% in women at age 65. Finally, the probability of death was higher in men than in women (almost twice higher) irrespective of functional status.
Table 2.
Transition probabilities between 65 and 66 years of age according to the three different thresholds of disability by gender and education—the PAQUID cohort, 1988–1998

Women lived more years in total than men (20.7 years at age 65 vs 16.1, respectively) (Table 3), but lived fewer years fully independent (2.2 years less than men, 95%CI 1.51–2.89) and longer in each of the three disability status, with the differences greater at younger ages (Fig. 1). It should be noted that the differences observed by gender in the lifetime lived with mild disability strongly declined with age and reversed at age 79. The additional years were mostly lived inactive, that is with moderate or severe disability. At age 65, as presented in Fig. 2a, of the 4.5 extra years of life (95% CI 3.61–5.39), women lived 4.2 years (95% CI 3.63–4.77) longer inactive and after the age of 70 the inactive lifetime overtook the additional years of life. ILE as a proportion of remaining life dramatically increased with age. At age 65, women lived more than one third of the remaining life inactive (i.e., with moderate or severe disability) and this increased to over 80% by age 85 (Table 3). Similar increases were found for men, although men spent only one fifth of their life inactive at age 65. Irrespective of age, the time lived with severe disability was constant, around 0.7 years in men and 1.8 in women.
Table 3.
Total active and inactive life expectancies (TLE, ADL and ILE) with 95% confidence intervals, at ages 65, 75 and 85, by sex and education—the PAQUID cohort, 1988–1998
| Ages | Total life expectancy | Active life expectancy | Inactive life expectancy | ||||||||
|---|---|---|---|---|---|---|---|---|---|---|---|
| TLE | 95% CI | ALEa | 95% CI | % of TLE | ILEb | 95% CI | % of TLE | ||||
| Men (N=1,453) | |||||||||||
| 65 | 16.12 | 15.44 | 16.79 | 12.84 | 12.25 | 13.42 | (79.6) | 3.28 | 2.95 | 3.61 | (20.4) |
| 75 | 9.52 | 9.13 | 9.90 | 6.11 | 5.75 | 6.47 | (64.2) | 3.41 | 3.11 | 3.71 | (35.8) |
| 85 | 4.82 | 4.53 | 5.11 | 1.81 | 1.56 | 2.05 | (37.5) | 3.01 | 2.73 | 3.29 | (62.5) |
| Women (N=2,031) | |||||||||||
| 65 | 20.67 | 20.10 | 21.25 | 13.17 | 12.71 | 13.63 | (63.7) | 7.50 | 7.04 | 7.97 | (36.3) |
| 75 | 12.65 | 12.23 | 13.08 | 5.51 | 5.21 | 5.82 | (43.5) | 7.14 | 6.75 | 7.53 | (56.5) |
| 85 | 6.76 | 6.41 | 7.11 | 1.12 | 0.97 | 1.28 | (16.6) | 5.64 | 5.27 | 6.00 | (83.4) |
| Low educated (N=1,237) | |||||||||||
| 65 | 17.08 | 16.21 | 17.96 | 11.16 | 10.50 | 11.82 | (65.3) | 5.92 | 5.33 | 6.51 | (34.7) |
| 75 | 10.22 | 9.73 | 10.71 | 4.47 | 4.06 | 4.87 | (43.7) | 5.75 | 5.31 | 6.21 | (56.3) |
| 85 | 5.35 | 5.00 | 5.70 | 0.85 | 0.68 | 1.03 | (15.9) | 4.50 | 4.12 | 4.87 | (84.1) |
| Higher educated (N=2,247) | |||||||||||
| 65 | 18.43 | 17.79 | 19.07 | 13.59 | 13.11 | 14.08 | (73.7) | 4.84 | 4.45 | 5.22 | (26.3) |
| 75 | 11.32 | 10.88 | 11.75 | 6.40 | 6.07 | 6.73 | (56.5) | 4.92 | 4.56 | 5.28 | (43.5) |
| 85 | 6.02 | 5.65 | 6.39 | 1.73 | 1.51 | 1.97 | (28.7) | 4.29 | 3.92 | 4.65 | (71.3) |
aALE, without any or with mild disability
bILE, with moderate or severe disability
Fig. 1.
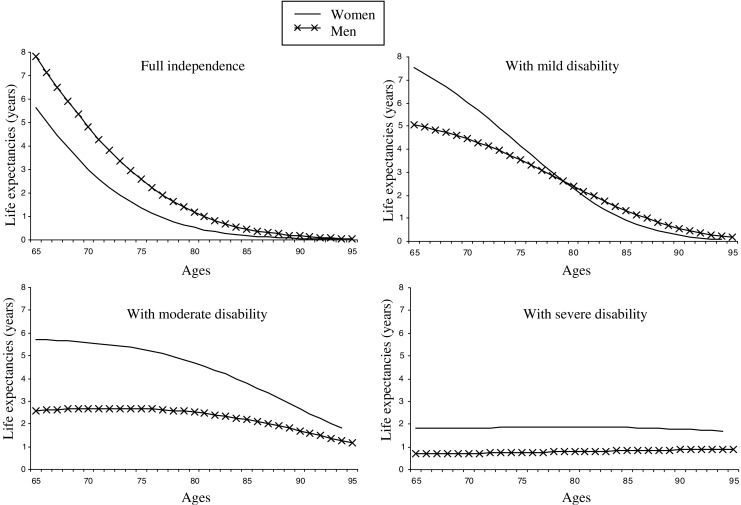
Life expectancy in each level of disability by age, according to gender—the PAQUID cohort, 1988–1998
Fig. 2.
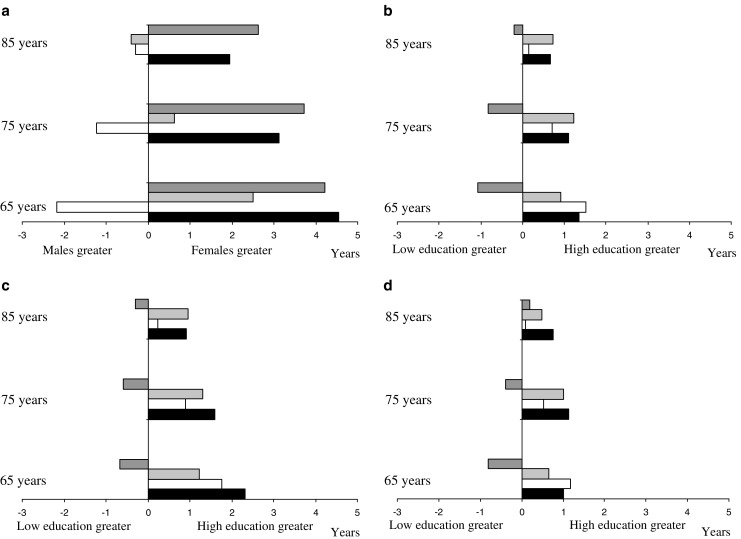
Differentials in total and active life expectancy at ages 65, 75 and 85 by sex and education—the PAQUID cohort, 1988–1998. a Gender differentials. b Educational differentials. c Educational differentials in men. d Educational differentials in women. Dark grey bar difference in LE with moderate or severe disability (ILE), light grey bar difference in LE with mild disability, white bar difference in LE without any disability, black bar difference in total LE
Educational differentials
Higher educated subjects were less likely to transit towards disability and also more likely to recover from disability. At age 65, the probability of transition from full independence to any level of disability was 14% in the higher educated compared to 17% in the others (Table 2). The probability of recovery of full independence was 29% in the higher educated subjects versus 23% among the less educated ones. No educational differences were observed for the transitions from the most severe disability and for the probability of death.
When compared to those with a low level of education, the higher educated subjects lived more years in total and more years active (2.4 years longer at age 65, 95% CI 1.58–3.22), both in absolute terms and in the proportion of remaining life spent active (Table 3). This was in contrast to gender differences where women lived longer but longer inactive. Differences in ALE between the low and high levels of education were greater than the differences in TLE (Fig. 2b). Less educated subjects appeared to live longer with moderate disability, but only at younger ages (Fig. 3).
Fig. 3.
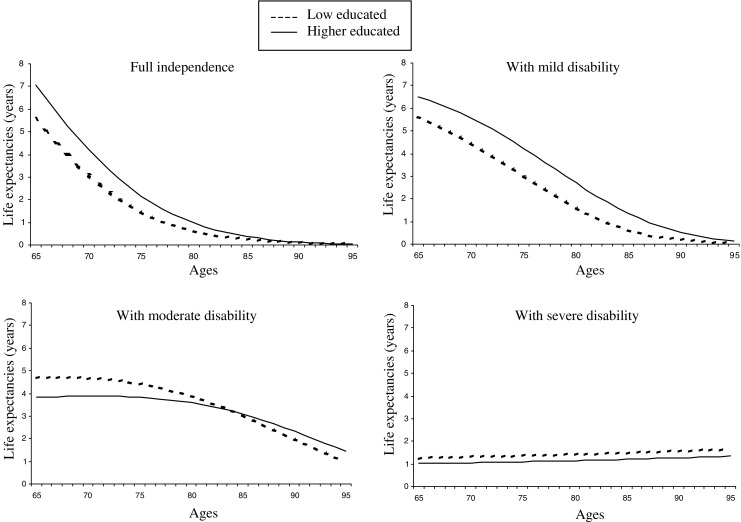
Life expectancy in each level of disability by age, according to education—the PAQUID cohort, 1988–1998
When men and women were analysed separately, the differences between education groups remained with similar patterns in men and women, but with larger differences in men (Fig. 2c, d). At 65 years of age and compared to those with less education, higher educated men could expect to live 2.3 years longer (95%CI −0.51–5.11) and 3.0 years longer active (95%CI 1.74–4.26), whilst the equivalent figures for women were 1.0 years (95%CI −0.26–2.26) and 1.8 years (95%CI 0.83–2.76), respectively (Fig. 2c, d). Again, differences in ALE (i.e., without any disability or with mild disability) exceeded differences in TLE.
Discussion
This paper reports the first disability-free life expectancies based on longitudinal data in an aged French population. Our calculations, using multi-state models and based on the incidence of disability, give a closer and more realistic estimate of the true health expectancy of the period studied, that is, the 1990 s here, than do methods based on the prevalence of the cross-sectional data (Lievre et al. 2003). The latter methods mostly measure the history of health conditions, whilst the estimations provided by the multi-state method reflect the current conditions. The estimations based on the incidence of disability allow taking into account period effects such as improvement in medical management of a disabling pathology, whilst such an improvement will only have a slight impact on the prevalence of disability (Lievre et al. 2003). However, estimations based on longitudinal data are more influenced by survey design and analytic strategies than those based on cross-sectional data (Saito et al. 1992). The multi-state method used in this paper also models the possibility of recovery from disability, whilst ignoring this transition could lead to misleading conclusions (Liu et al. 1995). Reversibility of disability is also essential when exploring differentials between social groups, since they may arise from differences in mortality, in the onset of and recovery from disability or some combination of these transitions (Crimmins et al. 1994). Moreover, whilst most previous studies focused on disability as a dichotomy, our data covered the full spectrum of disability, distinguishing it with four levels of disability, showing notably the considerable weight that the threshold of disability has on the conclusions drawn. Indeed, to simplify the presentation of the results, we chose to present disability as a dichotomy (active vs inactive) and if the active state had been defined as full independence, gender inequalities would have been much larger than with our definition, which included mild disability.
Our findings confirm the high life expectancy of older French people compared to others (Cambois and Robine 1996; Robine et al. 2002) albeit with both gender and education differences in the years spent free of disability. However, the inequalities by education differed from those by gender in terms of the lifetime spent with disability. Women paid longer longevity by poorer quality of life, whereas the early life advantage in terms of higher levels of education did not pay this price for longer life, living with both higher “quantity” and quality of life.
Our results also suggest that the expected years spent inactive (with moderate or severe disability) are incompressible, as reported by others (Branch et al. 1991; Crimmins et al. 1996; Guralnik et al. 1993). In particular, regardless of age, gender or education, around 1 year is spent with basic ADL-disability, a level of severity that requires substantial assistance. This period probably represents a state of severely deteriorating health preceding death.
As discussed above, longitudinal data provide many advantages, and yet there are limitations mainly from the inevitable attrition that occurs. If subjects with poorer health are at higher risk of refusal, we may have overestimated ALE. Indeed, in this study, the refusals were more often women and less educated subjects, well-known risk factors of disability, but were not significantly older. However, as vital status was available for each participant of PAQUID, loss-to-follow-up could not have biased TLE. This was confirmed by the similarity of our results to those reported for France in a recent European study (Robine et al. 2002) and also confirms the high representativity of the PAQUID sample.
Gender differentials
Consistent with many previous studies (Branch et al. 1991; Crimmins et al. 1996; Jitapunkul et al. 2003), we found a large gap in TLE by sex, favouring women, though the additional years were lived with disability, especially with the most severe disability. In the CLESA European project, a cross-national comparison of DFLE in six longitudinal studies in Europe, similar results were obtained (Minicuci et al. 2004). In the Longitudinal Study of Aging (Crimmins et al. 1996), women not only lived longer than men in each of the three levels of disability that were distinguished, as in PAQUID, but also fully independent, which is contrary to our results. Our findings suggest that, as long as men are fully independent, they live longer than women, but once their health begins to deteriorate (reflected by the onset of disability), the progression of disability and the onset of death are faster in men. The main explanation for this is the gender differences in diseases and associated mortality (Verbrugge 1989). Men tend to suffer from fatal diseases, rapidly disabling but also rapidly lethal, such as cardiovascular diseases or stroke, whilst women are more likely to suffer from non-fatal but chronic disabling conditions such as Alzheimer’s disease, arthritis or osteoporosis. Moreover, Deeg et al. (2002) reported that women also live longer than men having the same disease. As females have a lower risk of premature death, they are consequently at a higher risk of developing disability with age. But in PAQUID, the disablement process seemed to begin at younger ages in women than in men and our results suggest that women have a higher level of resistance to death despite a worsened health.
Educational differentials
The patterns of DFLE across groups of education were completely different from those observed across gender and remained so even after controlling for gender, suggesting that the mechanisms involved in gender inequalities differ from those by education. As reported in the previous studies, we observed that educational inequalities are more focused on the “quality” of lifespan rather than the “quantity” with the differentials in active LE exceeding those in TLE (Crimmins and Cambois 2003; Crimmins et al. 1996; Doblhammer and Kytir 1998; Guralnik et al. 1993; Gutierrez-Fisac et al. 2000; Valkonen et al. 1997). In contrast to Guralnik who reported a longer lifespan with disability in the more educated subgroups associated with higher TLE (Guralnik et al. 1993), the higher educated subjects in PAQUID do not pay for their longer life by poorer health. Educational differentials in LE may arise from poorer conditions earlier in life, from consequences of occupational conditions and from diseases related to higher risk behaviours in less socially advantaged subjects (such as tobacco and alcohol consumption, nutrition, physical activity). Finally, higher educated subjects have better access to medical care (allowing earlier diagnosis and treatments), and are more likely to adhere to health promotion and preventive messages. Kunst et al. (1998) reported that among middle-aged men, the higher educated subjects were more proactive in managing their disease and its consequences after the onset of the disease. In PAQUID, educational differences are much greater in men than in women, as reported by Crimmins and Saito (2001). These findings may reflect that educational level is a less relevant indicator of living conditions in women than in men, with few women of these aged generations having achieved more than a basic level of education. With a more relevant indicator of socio-economic status such as household income, occupational class or socioeconomic category, which was not available in PAQUID, stronger health inequalities could have been observed, especially in women.
Our findings represent the first health expectancies based on longitudinal data in an aged French population. They confirm the high life expectancy compared to other countries and highlight differentials by gender and education across four disability severity levels. Whilst higher educated subjects live longer and longer active, women pay the price for additional years of life by longer life with disability and also by fewer years fully independent. These data are an important contribution to describe the health of the aged French population in the 1990 s and are a firm foundation to monitor whether health gaps in older age continue in the current decade.
Acknowledgements
The PAQUID project was funded by: ARMA (Bordeaux); Caisse Nationale d’Assurance Maladie des Travailleurs Salariés (CNAMTS); Conseil Général de la Dordogne; Conseil Général de la Gironde; Conseil Régional d’Aquitaine; Fondation de France; France Alzheimer (Paris); GIS Longévité; Institut National de la Santé et de la Recherche Médicale (INSERM); Mutuelle Générale de l’Education Nationale (MGEN); Mutualité Sociale Agricole (MSA); NOVARTIS Pharma (France); SCOR Insurance (France).
Contributor Information
Karine Pérès, Phone: +33-55-757-4515, FAX: +33-55-757-1486, Email: karine.peres@isped.u-bordeaux2.fr.
Carol Jagger, Email: cxj@le.ac.uk.
Agnès Lièvre, Email: lievre@ined.fr.
Pascale Barberger-Gateau, Email: pascale.barberger-gateau@isped.u-bordeaux2.fr.
References
- Barberger-Gateau P, Chaslerie A, Dartigues JF, Commenges D, Gagnon M, Salamon R. Health measures correlates in a French elderly community population: the PAQUID study. J Gerontol. 1992;47:S88–S95. doi: 10.1093/geronj/47.2.s88. [DOI] [PubMed] [Google Scholar]
- Barberger-Gateau P, Rainville C, Letenneur L, Dartigues JF. A hierarchical model of domains of disablement in the elderly: a longitudinal approach. Disabil Rehabil. 2000;22:308–317. doi: 10.1080/096382800296665. [DOI] [PubMed] [Google Scholar]
- Branch LG, Guralnik JM, Foley DJ, Kohout FJ, Wetle TT, Ostfeld A, Katz S. Active life expectancy for 10,000 Caucasian men and women in three communities. J Gerontol B Psychol Sci Soc Sci. 1991;46:M145–M150. doi: 10.1093/geronj/46.4.m145. [DOI] [PubMed] [Google Scholar]
- Cambois E, Robine JM. An international comparison of trends in disability-free life expectancy. Dev Health Econ Public Policy. 1996;5:11–23. doi: 10.1007/978-1-4615-4096-0_2. [DOI] [PubMed] [Google Scholar]
- Crimmins EM, Saito Y. Trends in healthy life expectancy in the United States, 1970–1990: gender, racial, and educational differences. Soc Sci Med. 2001;52:1629–1641. doi: 10.1016/S0277-9536(00)00273-2. [DOI] [PubMed] [Google Scholar]
- Crimmins EM, Cambois E. Social inequalities in health expectancy. In: Robine JM, Jagger C, Mathers CD, Crimmins EM, Suzman RM, editors. Determining health expectancies. Chichester: Wiley; 2003. pp. 111–125. [Google Scholar]
- Crimmins EM, Hayward MD, Saito Y. Changing mortality and morbidity rates and the health status and life expectancy of the older population. Demography. 1994;31:159–175. doi: 10.2307/2061913. [DOI] [PubMed] [Google Scholar]
- Crimmins EM, Hayward MD, Saito Y. Differentials in active life expectancy in the older population of the United States. J Gerontol B Psychol Sci Soc Sci. 1996;51:S111–S120. doi: 10.1093/geronb/51b.3.s111. [DOI] [PubMed] [Google Scholar]
- Dartigues JF, Gagnon M, Michel P, Letenneur L, Commenges D, Barberger-Gateau P, Auriacombe S, Rigal B, Bedry R, Alperovitch A. [The Paquid research program on the epidemiology of dementia. Methods and initial results] Rev Neurol (Paris) 1991;147:225–230. [PubMed] [Google Scholar]
- Deeg DJ, Portrait F, Lindeboom M. Health profiles and profile-specific health expectancies of older women and men: the Netherlands. J Women Aging. 2002;14:27–46. doi: 10.1300/J074v14n01_03. [DOI] [PubMed] [Google Scholar]
- Doblhammer G, Kytir J. Social inequalities in disability-free and healthy life expectancy in Austria. Wien Klin Wochenschr. 1998;110:393–396. [PubMed] [Google Scholar]
- Gruenberg EM. The failures of success. Milbank Mem Fund Q Health Soc. 1977;55:3–24. doi: 10.2307/3349592. [DOI] [PubMed] [Google Scholar]
- Guralnik JM, Land KC, Blazer D, Fillenbaum GG, Branch LG. Educational status and active life expectancy among older blacks and whites. N Engl J Med. 1993;329:110–116. doi: 10.1056/NEJM199307083290208. [DOI] [PubMed] [Google Scholar]
- Gutierrez-Fisac JL, Gispert R, Sola J. Factors explaining the geographical differences in disability free life expectancy in Spain. J Epidemiol Community Health. 2000;54:451–455. doi: 10.1136/jech.54.6.451. [DOI] [PMC free article] [PubMed] [Google Scholar]
- Jitapunkul S, Kunanusont C, Phoolcharoen W, Suriyawongpaisal P, Ebrahim S. Disability-free life expectancy of elderly people in a population undergoing demographic and epidemiologic transition. Age Ageing. 2003;32:401–405. doi: 10.1093/ageing/32.4.401. [DOI] [PubMed] [Google Scholar]
- Katz S, Downs TD, Cash HR, Grotz RC. Progress in development of the index of ADL. Gerontologist. 1970;10:20–30. doi: 10.1093/geront/10.1_part_1.20. [DOI] [PubMed] [Google Scholar]
- Kunst AE, Groenhof F, Mackenbach JP, Health EW. Occupational class and cause specific mortality in middle aged men in 11 European countries: comparison of population based studies. EU Working Group on Socioeconomic Inequalities in Health. BMJ. 1998;316:1636–1642. doi: 10.1136/bmj.316.7145.1636. [DOI] [PMC free article] [PubMed] [Google Scholar]
- Laditka SB, Haywards MD. The evolution of demographic methods to calculate health expectancies. In: Robine JM, Jagger C, Mathers CD, Crimmins EM, Suzman RM, editors. Determining health expectancies. Chichester: Wiley; 2003. pp. 221–234. [Google Scholar]
- Lawton MP, Brody EM. Assessment of older people: self-maintaining and instrumental activities of daily living. Gerontologist. 1969;9:179–186. [PubMed] [Google Scholar]
- Lievre A, Brouard N, Heathcote C. The estimation of health expectancies from cross-longitudinal surveys. Math Popul Stud. 2003;10:211–248. doi: 10.1080/713644739. [DOI] [Google Scholar]
- Liu X, Liang J, Muramatsu N, Sugisawa H. Transitions in functional status and active life expectancy among older people in Japan. J Gerontol B Psychol Sci Soc Sci. 1995;50:S383–S394. doi: 10.1093/geronb/50b.6.s383. [DOI] [PubMed] [Google Scholar]
- Manton KG. Changing concepts of morbidity and mortality in the elderly population. Milbank Mem Fund Q Health Soc. 1982;60:183–244. doi: 10.2307/3349767. [DOI] [PubMed] [Google Scholar]
- Manton KG, Stallard E. Cross-sectional estimates of active life expectancy for the US elderly and oldest-old populations. J Gerontol B Psychol Sci Soc Sci. 1991;46:S170–S182. doi: 10.1093/geronj/46.3.s170. [DOI] [PubMed] [Google Scholar]
- Mathers CD, Sadana R, Salomon JA, Murray CJ, Lopez AD. Healthy life expectancy in 191 countries, 1999. Lancet. 2001;357:1685–1691. doi: 10.1016/S0140-6736(00)04824-8. [DOI] [PubMed] [Google Scholar]
- Minicuci N, Noale M, Pluijm SMF, Zunzunegui MV, Blumstein T, Deeg DJH, Bardage C, Jylhä M, the working group CLESA. Disability-free life expectancy: a cross-national comparison of six longitudinal studies on aging. The CLESA project. Eur J Ageing. 2004;1:37–44. doi: 10.1007/s10433-004-0002-5. [DOI] [PMC free article] [PubMed] [Google Scholar]
- Robine JM, Romieu I, Cambois E. Health expectancy indicators. Bull World Health Organ. 1999;77:181–185. [PMC free article] [PubMed] [Google Scholar]
- Robine JM, Jagger C, Cambois E. European perspectives on healthy aging in women. J Women Aging. 2002;14:119–133. doi: 10.1300/J074v14n01_08. [DOI] [PubMed] [Google Scholar]
- Rosow I, Breslau N. A Guttman health scale for the aged. J Gerontol B Psychol Sci Soc Sci. 1966;21:556–559. doi: 10.1093/geronj/21.4.556. [DOI] [PubMed] [Google Scholar]
- Saito Y, Crimmins EM, Hayward MD. Stabilité des estimations de l’espérance de vie sans perte d’autonomie calculées au moyen de deux méthodes de construction de tables de survie. Cah Qué Démogr. 1992;20:1–37. [Google Scholar]
- Valkonen T, Sihvonen AP, Lahelma E. Health expectancy by level of education in Finland. Soc Sci Med. 1997;44:801–808. doi: 10.1016/S0277-9536(96)00190-6. [DOI] [PubMed] [Google Scholar]
- Verbrugge LM. The twain meet: empirical explanations of sex differences in health and mortality. J Health Soc Behav. 1989;30:282–304. doi: 10.2307/2136961. [DOI] [PubMed] [Google Scholar]