

Abstract
Decades of cognitive neuroscience research have revealed two basic facts regarding task-driven brain activation patterns. First, distinct patterns of activation occur in response to different task demands. Second, a superordinate, dichotomous pattern of activation/deactivation, is common across a variety of task demands. We explore the possibility that a hierarchical model incorporates these two observed brain activation phenomena into a unifying framework. We apply a latent variable approach, exploratory bifactor analysis, to a large set of human (both sexes) brain activation maps (n = 108) encompassing cognition, perception, action, and emotion behavioral domains, to determine the potential existence of a nested structure of factors that underlie a variety of commonly observed activation patterns. We find that a general factor, associated with a superordinate brain activation/deactivation pattern, explained the majority of the variance (52.37%) in brain activation patterns. The bifactor analysis also revealed several subfactors that explained an additional 31.02% of variance in brain activation patterns, associated with different manifestations of the superordinate brain activation/deactivation pattern, each emphasizing different contexts in which the task demands occurred. Importantly, this nested factor structure provided better overall fit to the data compared with a non-nested factor structure model. These results point to a domain-general psychological process, representing a “focused awareness” process or “attentional episode” that is variously manifested according to the sensory modality of the stimulus and degree of cognitive processing. This novel model provides the basis for constructing a biologically informed, data-driven taxonomy of psychological processes.
SIGNIFICANCE STATEMENT A crucial step in identifying how the brain supports various psychological processes is a well-defined categorization or taxonomy of psychological processes and their interrelationships. We hypothesized that a nested structure of cognitive function, in terms of a canonical domain-general cognitive process, and various subfactors representing different manifestations of the canonical process, is a fundamental organization of human cognition, and we tested this hypothesis using fMRI task-activation patterns. Using a data-driven latent-variable approach, we demonstrate that a nested factor structure underlies a large sample of brain activation patterns across a variety of task domains.
Keywords: bifactor analysis, cognitive ontoloy, task fMRI, task-negative, task-positive, taxonomy
Introduction
A central goal of cognitive neuroscience is to understand cognitive processes through the analysis and examination of neuroimaging data. In the past two decades, researchers have attempted to delineate the brain activation patterns associated with various task demands to provide a neural grounding of cognitive processes. Thus far, hundreds of task fMRI studies have purported to demonstrate differential brain activation patterns associated with working memory (Curtis and D'Esposito, 2003), attention (Kanwisher and Wojciulik, 2000), inhibitory control (Liddle et al., 2001), multisensory integration (Driver and Noesselt, 2008), affective regulation (Damasio et al., 2000), and other cognitive processes. In contrast to this emphasis on linking individual cognitive processes with unique brain activation patterns, other research has demonstrated the existence of a dominant, canonical pattern of brain activation/deactivation that occurs across a variety of task demands and associated cognitive processes, sometimes referred to as “task-positive” activation (Toro et al., 2008; Duncan, 2010; Fedorenko et al., 2013; Hugdahl et al., 2015) and “task-negative” deactivation (Raichle et al., 2001; Fox et al., 2005). Researchers have argued that the canonical task activation/deactivation pattern represents a domain-general cognitive process (Duncan, 2010; Fedorenko et al., 2013; Hugdahl et al., 2015) activated in response to the presence of external stimuli, regardless of the content of the stimuli.
These observations give rise to two tenets: (1) the brain produces distinct patterns of activation in response to different task demands; and (2) the brain produces a singular, superordinate pattern of activation/deactivation across a variety of task demands. Recent work has aimed to reconcile this apparent dichotomy by exploring the extent to which different tasks share common and distinct psychological processes (Poldrack et al., 2009; Barrett and Satpute, 2013; Krienen et al., 2014). We hypothesized that these two streams of research, rather than contradictory, point to the existence of a nested structure of brain activation patterns underlying human cognition. In particular, we hypothesized that an overarching domain-general cognitive process, represented by the canonical brain activation/deactivation pattern, is present across all task demands, in agreement with previous literature, but presents in different manifestations depending on cognitive processes unique to the type of task demands. Thus, cognitive processes unique to different types of task demands are distinguished by differential subtypes of the canonical task-positive/task-negative pattern. For example, activation due to an arithmetic task is hypothesized to predominantly exhibit the canonical activation/deactivation pattern, yet also exhibit a unique manifestation of this pattern due to cognitive processes (e.g., mathematical cognition) unique to this type of task.
We tested this hypothesis with a novel application of a bifactor analytic model applied to group-level unthresholded task-activation maps from a large sample of published fMRI studies (Fig. 1). The use of unthresholded brain activation maps provides an advantage over previous studies (Toro et al., 2008; Smith et al., 2009; Lenartowicz et al., 2010; Bertolero et al., 2015; Yeo et al., 2015) examining task-general brain activation patterns that have used activation-coordinate databases, such as the BrainMap database (Fox and Lancaster, 2002) or Neurosynth (Yarkoni et al., 2011). Coordinate-based analyses are inherently limited due to their reduction of full statistic images to peak-activation coordinates (Salimi-Khorshidi et al., 2009; Poldrack and Yarkoni, 2016); and at present, there are no universal standards for reporting activation coordinates (Wager et al., 2007). The use of “full-information” activation images, rather than peak-activation coordinates, allows for more accurate assessments of the covariance between any two activation maps, and a wider variety of analytic approaches to explore the associations among a group of activation maps. Using a large-scale dataset of unthresholded brain activation maps from several task domains provided through the Human Connectome Project (HCP) (Barch et al., 2013) and NeuroVault database (Gorgolewski et al., 2015), this study directly tested the hypothesized nested or bifactor organization of brain activation patterns. In addition, we directly compared the overall fit to the collection of brain activation maps of a nested factor model of brain activation patterns with a non-nested factor model.
Figure 1.

Illustration of exploratory bifactor analysis approach. In this particular application of the bifactor analytic model, each task-activation map, representing the activation (red) associated with a particular task state (e.g., social cognition or semantic processing), is modeled as arising from direct effects of a single latent general factor and various latent subfactors (e.g., Subfactor 1 and Subfactor 2). In addition, subfactors may also be correlated with one another (double-headed arrow). These latent factors can also be represented in brain space (blue) through the computation of scores associated with factors.
Materials and Methods
HCP and NeuroVault inclusion and exclusion criteria.
Unthresholded fMRI group statistic images were used for this study. Specifically, contrast images representing group-level BOLD activity in response to blocked or event-related task onsets and offsets were of interest. Statistical images corresponding to the subtraction between two activation maps were not included in the analysis. There were two primary reasons these subtraction contrasts were not included: (1) From each collection of task contrasts, we included activation maps from control and active conditions. If the statistic image from the subtraction contrast, corresponding to the subtraction condition between the active and control condition, was included in the data analysis, along with its constituent active and control condition, the model could no longer be estimated, as the resulting data matrix would be nonpositive definite or singular, and could not be inverted. This is the result of the fact that the subtraction condition can be expressed as a linear combination of the active and control condition (a simple subtraction). (2) The estimation method of the bifactor approach is a “bottom-up,” agglomerative approach, where activation maps were “clustered” into task factors based on similarity in activation patterns. These were then interpreted in terms of task parameters held in common by each cluster of activation maps. Thus, our approach has a similar logic to conjunction analysis (Price and Friston, 1997), which infers cognitive processes based on the common conjunction of task-activation patterns. Subtractions between activation maps would amount to removing potential common activation patterns among the activation maps used by the bifactor analysis to compute the factor structure, as the full covariance estimate between the task-activation images is what the factor analysis is attempting to model.
HCP activation maps.
Neuroimaging data from 208 nontwin, healthy, right-handed adults (age, mean ± SD, 28.61 ± 3.85 years, range: 22–36 years; 103 female) made available through the HCP 2014 release were used for this study. These were the maximum number of nontwin subjects in the 2014 release (Barch et al., 2013). For each subject, ∼7 task scans (not all subjects had all task scans) were used for analysis. Here we refer to the tasks as the working memory task, gambling task, motor task, language task, social task, relational task, and emotion task. Of the 86 task contrasts made available through the HCP 2014 release, a total of 24 contrasts were task-activation maps and were used for further analyses.
NeuroVault activation maps.
At the time of the analysis (August 2016), the NeuroVault database (Gorgolewski et al., 2015) contained 369 publicly shared collections of images, where each collection contained all of the images from a single study. A collection in the NeuroVault database may contain unthresholded fMRI and PET statistic images, functional and structural parcellations, and anatomical atlases. We also excluded images derived from meta-analyses, functional connectivity analyses (seed-based, Independent Components Analysis, etc.), multivariate pattern analyses, behavioral correlation analyses, group comparison analyses, and any analyses of patient or clinical populations. To ensure the statistic images meeting this criterion were of sufficient quality, only studies using ≥20 participants were included (Desmond and Glover, 2002). Eighty-seven contrast images from 17 NeuroVault collections met these criteria and were included. Included in this total are two task contrasts from the United Kingdom Biobank study (Miller et al., 2016) (further references to “NeuroVault” contrasts include these two contrasts).
Processing of HCP and Neurovault data.
For the HCP task data, the participant-level volume-based analyses were used. The preprocessing of this task data involved gradient distortion correction, motion correction, registration to the MNI template (MNI 152 space), and grand-mean intensity normalization. In addition, spatial smoothing was applied to each task scan using an unconstrained 3D Gaussian kernel of FWHM = 4 mm. The details of the minimal preprocessing pipeline are described by Glasser et al. (2013). Session-level analyses were performed within each task for both encoding directions and are described by Barch et al. (2013): session-level activity estimates were computed using the GLM implemented in FSL's FILM (FMRIB's Improved Linear Model) with autocorrelation correction (Woolrich et al., 2001). Predictors for each task contrast were convolved with a double gamma canonical hemodynamic response function (Glover, 1999). To account for slice-timing differences and variability in the HRF delay across regions, temporal derivatives of each predictor were added as a confound term to the GLM. Time-series were then high pass filtered with a cutoff of 200 s and prewhitened within FILM to correct for autocorrelations in the timeseries. The two session-level activity estimates for each encoding direction were then combined using a fixed-effects GLM analysis implemented in FSL's FEAT to estimate average effect participant-level estimates. Group-level mixed-effect analyses treating subjects (n = 208) as a random effect were conducted for each sample with the participant-level fixed-effect estimates implemented in FSL's FLAME (FMRIB's Local Analysis of Mixed Effects) to estimate the average effects of interest across the sample (Woolrich et al., 2004). The resulting unthresholded group-level z-statistic images were used for further analyses.
Most of the contrasts in the sample chosen from NeuroVault were t-statistic images and were thus converted to z-statistic images for normalization across contrasts. To ensure the group contrast images from the NeuroVault database were adequately comparable, several steps were taken to reduce interscanner and intersubject variability. First, all NeuroVault contrasts were reregistered to a 2 mm MNI template using FSL's FLIRT (Jenkinson and Smith, 2001). Three of the 87 contrast images from the NeuroVault database failed to align to the MNI template using this process and were excluded from further analyses, leaving 108 (24 HCP and 84 NeuroVault contrasts) contrast images overall for the analysis. To further reduce interstudy variability and ensure comparability across both NeuroVault and HCP images, all images were resampled to 3 mm voxel size (voxel resolution of all contrasts ranged from 2 to 4 mm) and were spatially smoothed with a 6 mm FWHM Gaussian kernel.
All 108 contrasts from both HCP and Neurovault are described in Table 1. Classifying each of the 108 contrasts into the four behavioral domains of the BrainMap database (Laird et al., 2009), excluding the “interoception” domain, which includes perception of internal/autonomic sensations: 40% are cognition contrasts, 23% are perception contrasts, 21% are action contrasts, and 17% are emotion contrasts. This proportion of behavioral domain sampling is similar to the proportions of the four domains in the BrainMap database, where 49% are cognition experiments, 18% are perception experiments, 16% are action experiments, and 18% are emotion contrasts (as of August 2016).
Table 1.
Contrast descriptions from NeuroVault and HCP databases: activation map names, abbreviation used in the factor loading figures, and task classification
| Task database | NeuroVault task ID | N | Task classification | Task abbreviation | Contrast |
|---|---|---|---|---|---|
| NeuroVault | 25 | 32 | Semantic Priming Task | SP | Letter Strings |
| NeuroVault | 45 | 26 | Erikson Flanker Task | EF | Congruent, Correct |
| NeuroVault | 45 | 26 | Erikson Flanker Task | EF | Incongruent, Correct |
| NeuroVault | 46 | 49 | Word 1back Task | W_1Back | Words |
| NeuroVault | 46 | 49 | Word 1back Task | W_1Back | Scrambled Objects |
| NeuroVault | 46 | 49 | Word 1back Task | W_1Back | Objects |
| NeuroVault | 46 | 49 | Word 1back Task | W_1Back | Consonant Strings |
| NeuroVault | 93 | 93 | Functional Localizer | AC | Calculation, Auditory Cue |
| NeuroVault | 93 | 93 | Functional Localizer | FL | Calculation, Visual Cue |
| NeuroVault | 93 | 93 | Functional Localizer | FL | Horizontal Checkerboard |
| NeuroVault | 93 | 93 | Functional Localizer | FL | Left Button Press Auditory Cue |
| NeuroVault | 93 | 93 | Functional Localizer | FL | Left Button Press Visual Cue |
| NeuroVault | 93 | 93 | Functional Localizer | FL | Right Button Press Visual Cue |
| NeuroVault | 93 | 93 | Functional Localizer | FL | Right Button Press Visual Cue |
| NeuroVault | 93 | 93 | Functional Localizer | FL | Sentence Listening |
| NeuroVault | 93 | 93 | Functional Localizer | FL | Sentence Reading |
| NeuroVault | 93 | 93 | Functional Localizer | FL | Vertical Checkerboard |
| NeuroVault | 98 | 24 | Balloon Analog Risk Taking Task | BART | Accept Cash |
| NeuroVault | 98 | 24 | Balloon Analog Risk Taking Task | BART | Explode |
| NeuroVault | 98 | 24 | Balloon Analog Risk Taking Task | BART | Reject |
| NeuroVault | 98 | 24 | Emotional Regulation Task | ER | Rating, All |
| NeuroVault | 98 | 24 | Emotional Regulation Task | ER | Reappraisal of Negative Cue |
| NeuroVault | 98 | 24 | Emotional Regulation Task | ER | Negative Cue |
| NeuroVault | 98 | 24 | Emotional Regulation Task | ER | Neutral Cue |
| NeuroVault | 98 | 24 | Stop Signal Task | SS | Go |
| NeuroVault | 98 | 24 | Stop Signal Task | SS | Successful Stop |
| NeuroVault | 98 | 24 | Temporal Discounting Task | TD | Easy Trials, All |
| NeuroVault | 98 | 24 | Temporal Discounting Task | TD | Hard Trials, All |
| NeuroVault | 99 | 21 | Simon Task | Simon | Incongruent, Incorrect |
| NeuroVault | 99 | 21 | Simon Task | Simon | Congruent, Correct |
| NeuroVault | 99 | 21 | Simon Task | Simon | Congruent, Incorrect |
| NeuroVault | 99 | 21 | Simon Task | Simon | Incongruent, Correct |
| NeuroVault | 110 | 44 | Social Judgments of Faces Task | SJ | Age Judgment |
| NeuroVault | 110 | 44 | Social Judgments of Faces Task | SJ | Attractiveness Judgment |
| NeuroVault | 110 | 44 | Social Judgments of Faces Task | SJ | Happiness Judgment |
| NeuroVault | 110 | 44 | Social Judgments of Faces Task | SJ | Right Motor |
| NeuroVault | 110 | 44 | Social Judgments of Faces Task | SJ | Trustworthiness Judgment |
| NeuroVault | 110 | 44 | Social Judgments of Faces Task | SJ | Left Motor |
| NeuroVault | 423 | 20 | Stop Signal Task | SS | All |
| NeuroVault | 423 | 20 | Stop Signal Task, Letter Naming | SS_Letter | All |
| NeuroVault | 423 | 20 | Stop Signal Task, Pseudo Word Naming | SS_Pseudo | All |
| NeuroVault | 425 | 34 | Emotional Regulation Task | ER | Look Negative Rating |
| NeuroVault | 425 | 34 | Emotional Regulation Task | ER | Look Neutral |
| NeuroVault | 425 | 34 | Emotional Regulation Task | ER | Negative Cue |
| NeuroVault | 425 | 34 | Emotional Regulation Task | ER | Reappraisal of Negative Cue |
| NeuroVault | 426 | 33 | False Belief Task | FB | False Belief Question |
| NeuroVault | 426 | 33 | False Belief Task | FB | False Belief Story |
| NeuroVault | 426 | 33 | False Belief Task | FB | False Picture Story |
| NeuroVault | 426 | 33 | False Belief Task | FB | False Picture Question |
| NeuroVault | 446 | 21 | Match to Sample Task | MS | Match-to-Sample |
| NeuroVault | 654 | 40 | Sentence Reading | SR | Normal Word Sentences |
| NeuroVault | 654 | 40 | Sentence Reading | SR | Pseudo Word Sentences |
| NeuroVault | 657 | 32 | Visual Processing | VP | Action |
| NeuroVault | 657 | 32 | Visual Processing | VP | Digits |
| NeuroVault | 657 | 32 | Visual Processing | VP | Faces |
| NeuroVault | 657 | 32 | Visual Processing | VP | Houses |
| NeuroVault | 657 | 32 | Visual Processing | VP | Scrambled |
| NeuroVault | 657 | 32 | Visual Processing | VP | Tools |
| NeuroVault | 657 | 32 | Visual Processing | VP | Words |
| NeuroVault | 657 | 32 | Mental Calculation | MC | Subtraction Arithmetic |
| NeuroVault | 657 | 32 | Mental Calculation | MC | Saccade Movement |
| NeuroVault | 657 | 32 | Auditory Processing | AP | French Words |
| NeuroVault | 657 | 32 | Auditory Processing | AP | Korean Words |
| NeuroVault | 657 | 32 | Auditory Processing | AP | Sounds |
| NeuroVault | 723 | 20 | Food Choice Task | FC | High Energy Food Choice |
| NeuroVault | 723 | 20 | Food Choice Task | FC | Low Energy Food Choice |
| NeuroVault | 724 | 20 | Food Choice Task | FC | Self-Control Required |
| NeuroVault | 724 | 20 | Food Choice Task | FC | No Self-Control Required |
| NeuroVault | 857 | 330 | Episodic Recall | Episodic | Antonyms |
| NeuroVault | 857 | 330 | Episodic Recall | Episodic | Synonyms |
| NeuroVault | 857 | 330 | Episodic Recall | Episodic | Picture Naming |
| NeuroVault | 857 | 330 | Speech Detection | SD | Digit Symbol |
| NeuroVault | 857 | 330 | Pattern Comparison Task | PC | Letter Comparison |
| NeuroVault | 857 | 330 | Pattern Comparison Task | PC | Pattern Comparison |
| NeuroVault | 857 | 330 | Logical Reasoning Task | LR | Matrix Reasoning |
| NeuroVault | 857 | 330 | Logical Reasoning Task | LR | Paper Folding |
| NeuroVault | 857 | 330 | Logical Reasoning Task | LR | Letter Set |
| NeuroVault | 857 | 330 | Semantic Memory Task | SM | Logical Memory |
| NeuroVault | 857 | 330 | Semantic Memory Task | SM | Paired Associates |
| NeuroVault | 857 | 330 | Semantic Memory Task | SM | Word Order |
| NeuroVault | 1126 | 44 | Lexical Decision Task | LD | Fixation |
| NeuroVault | 1212 | 23 | Visually Guided Saccade Task | Saccade | Average Saccade |
| BioBank | N/A | 5285 | Emotional Face Processing | Emotion | Faces |
| BioBank | N/A | 5285 | Emotional Face Processing | Emotion | Shapes |
| HCP | N/A | 204 | Working Memory | WM | 2Back, Body Stimuli |
| HCP | N/A | 204 | Working Memory | WM | 2Back, Face Stimuli |
| HCP | N/A | 204 | Working Memory | WM | 2Back, Place Stimuli |
| HCP | N/A | 204 | Working Memory | WM | 2Back, Tool Stimuli |
| HCP | N/A | 204 | Working Memory | WM | 0Back, Body Stimuli |
| HCP | N/A | 204 | Working Memory | WM | 0Back, Face Stimuli |
| HCP | N/A | 204 | Working Memory | WM | 0Back, Place Stimuli |
| HCP | N/A | 204 | Working Memory | WM | 0Back, Tool Stimuli |
| HCP | N/A | 205 | Incentive Processing | Gambling | Mostly Punish Condition |
| HCP | N/A | 205 | Incentive Processing | Gambling | Mostly Reward Condition |
| HCP | N/A | 206 | Motor Movement | Motor | Visual Cue |
| HCP | N/A | 206 | Motor Movement | Motor | Left Foot Movement |
| HCP | N/A | 206 | Motor Movement | Motor | Left Hand Movement |
| HCP | N/A | 206 | Motor Movement | Motor | Right Foot Movement |
| HCP | N/A | 206 | Motor Movement | Motor | Right Hand Movement |
| HCP | N/A | 206 | Motor Movement | Motor | Tongue Movement |
| HCP | N/A | 201 | Language Processing | Language | Arithmetic Problems |
| HCP | N/A | 201 | Language Processing | Language | Story Comprehension |
| HCP | N/A | 203 | Theory of Mind | Social | Randomly Interacting Shapes |
| HCP | N/A | 203 | Theory of Mind | Social | Intentionally Interacting Shapes |
| HCP | N/A | 202 | Relational Processing | Relational | Match |
| HCP | N/A | 202 | Relational Processing | Relational | Relational |
| HCP | N/A | 203 | Emotion Processing | Emotion | Faces |
| HCP | N/A | 203 | Emotion Processing | Emotion | Shapes |
Experimental design and statistical analysis.
The current study examined the factor structure of task-activation contrast images (n = 108) using a novel factor analytic approach, known as exploratory bifactor analysis (for more details on the bifactor model and the logic of the approach, see Exploratory bifactor analysis). As an initial assessment of the consistency of activation patterns across all task-activation contrast images, we performed a simple conjunction analysis, summing binarized activation/deactivation patterns across all maps (for more details, see Conjunction analysis). The exploratory bifactor analysis proceeded in three stages: (1) a data reduction stage to reduce the spatial dependence between activation estimates across voxels (for more details, see Data reduction stage); (2) an initial extraction phase in which an initial factor solution is estimated and the appropriate number of factors is determined by parallel analysis (for more details, see Initial extraction phase); and (3) a bifactor analysis phase in which the factor analysis is reestimated with the estimated number of factors from the initial extraction phase and a bifactor rotation criteria (for more details, see Bifactor analysis phase). The final analysis conducted in this study tested the fit of other alternative factor structures, such as a standard (non-nested) factor structure, using a confirmatory factor analysis (for more details, see Comparison of alternative factor structures with bifactor model).
Conjunction analysis.
For a preliminary analysis of the total set of 108 group contrast images (z-statistic images), a simple conjunction analysis was performed. This allowed an overall assessment of the consistency of activation patterns across all contrast images. All contrast images were thresholded at z = 2.3 and z = −2.3 (p < 0.01) to examine the conjunction of activation and deactivation across the images, respectively, and then binarized, such that suprathreshold activation/deactivation areas were replaced with a value of 1. All activation and deactivation images were then summed across all contrasts to form activation and deactivation conjunction images, respectively.
Exploratory bifactor analysis.
The goal of all common factor analytic models, including the bifactor model, is to explain the common variability among a group of observed variables (e.g., task contrasts, brain activation maps) in terms of a smaller set of unobserved or latent variables, called factors. The individual contrast maps are modeled as causally influenced by or indicators of their respective factors (MacCallum, 2009). Thus, an implicit model of the relationship between the observed variables and unobserved factors in factor analysis is assumed (i.e., model-based analysis) in factor analysis, distinguishing this approach from principal components analysis, a similar approach. Specifically, the common factor model, including the bifactor model, represents each observed variable as a linear combination of common and unique factors as follows:
where X is the p (variables) length vector of scores for each variable; λ is the p × m (common factor) matrix of factor loadings describing the association between each variable and each common factor; θ is m length vector of factor scores; and δ is the p length vector of unique factor scores (“measurement error”) or the variance unexplained by the common factors. In the bifactor model, mathematical restrictions (described below) are placed on the factor loading matrix (λ) so as to model a general factor in one column of the matrix and subfactors in the remaining columns. In the application of the model to the current data, each group contrast map corresponding to the average BOLD activation/deactivation in response to particular processes (e.g., arithmetic calculation) or stimuli (e.g., angry faces) is modeled as a linear combination of a general latent factor that is related to all contrast maps and nested subfactors that relate to subsets or groupings of the contrast maps.
One major difference between the latent variable approach used in this study and other common latent variable approaches, such as the independent components analysis approach (Calhoun et al., 2008; Smith et al., 2009), is that the factor analytic model in this study is estimating relationships among task contrasts rather than estimating relationships among voxels across the task contrasts. The primary goal of this study was to estimate underlying factors that explain the common variance among the task contrasts, rather than the common variance among voxel activity patterns. Thus, the latent variables in this approach are computed as linear combinations of task contrasts rather than voxels. This is made possible by the use of unthresholded statistical images that allow for more accurate assessments of covariance between any two contrasts. In addition, we were interested in representative patterns of task activation/deactivation that explain as much variance as possible among the task contrasts, thus the factor analytic model extracts underlying factors that best explains the covariance in the data, rather than estimating possible independent sources underlying the associations among the task contrasts (i.e., independent components analysis).
The exploratory bifactor analysis approach in this study proceeded in three stages: (1) a data reduction stage, (2) an initial extraction phase, and (3) a bifactor analysis phase. The extraction and rotation phases were conducted using the exploratory factor analysis program in Mplus software (Muthén and Muthén, 2011).
Data reduction stage.
One assumption of the factor analysis models is independence of observations. Because of the strong spatial dependencies among voxels (n = 80,090) within a task contrast, this assumption is unlikely to hold. Thus, a high-resolution, data-driven parcellation (n = 950; Fig. 2) of the cortex was used (Craddock et al., 2012), and voxel z scores within the regions of interest (ROIs) of the parcellation were averaged together. This high-resolution parcellation included only gray matter cortical and subcortical regions of the brain, excluding brainstem regions. The brainstem was excluded in this study because it is often difficult to obtain reliable signal from this area (Brooks et al., 2013). To ensure the parcellation adequately represented the data, we conducted a between-ROI ANOVA for each contrast to determine how much of the variance in each contrast was accounted for by between-ROI variance as opposed to within-ROI (error) variance. This was a standard one-way ANOVA model with the ROI assignment of each voxel as a grouping factor. The model computed the amount of variance in voxel activation values due to variability in ROI means compared with variability in voxels within those ROIs. The results of the between-ROI ANOVA revealed that the ROI parcellation accounted for a substantial majority of variance in the data across all contrasts (mean ROIB/W = 0.829%, range: 0.665%–0.882%).
Figure 2.

Craddock high-resolution parcellation (n = 950). The a priori parcellation used as an initial data reduction before the bifactor analysis. The parcellation was computed using a spatially constrained spectral clustering technique to define cortical ROIs with homogeneous functional connectivity relationships (Craddock et al., 2012). ROIs are differentiated by integer values (1–950) differentiated by colors and visualized on a surface MNI template.
Initial extraction phase.
The ROI values for each contrast were then vectorized and placed into a matrix, where ROIs represent (n = 950) observations (i.e., rows) and columns represent variables (n = 108). Thus, the data matrix X described above corresponds to the n ROI values (950) × p contrasts (108) matrix. In the initial extraction phase of the factor analysis approach, the number of factors is estimated. To estimate the number of factors in the data, we used the parallel analysis method (O'Connor, 2000). This method involves extracting components and their associated eigenvalues (analogous to the amount of explained variance) through principal component analysis applied to permutations (n = 10,000) of the original data matrix (X) using column-wise reshuffling of the original data matrix. The mean permuted eigenvalues are then compared with the component eigenvalues extracted from the original data matrix (X) to determine the number of factors in the solution. Here, the estimated number of factors was the number of components with eigenvalues greater than the mean permuted component eigenvalues.
Bifactor analysis phase.
After the number of factors was estimated, a maximum likelihood estimator with robust standard errors (MLR) was used to estimate the bifactor model. Maximum likelihood estimation operates through an iterative search over parameters (factor loadings matrix and specific variances) that maximize a log-likelihood function, which measures the likelihood of the estimated parameters producing the sample variance-covariance matrix. However, the original maximum likelihood estimator assumes a multivariate normal distribution of the variables in estimation of model parameters, and a multivariate test of normality (Royston, 1983) (p < 1.0e-10) indicated that the joint distribution of the data did not exhibit normality. Thus, a robust maximum likelihood estimation procedure was chosen to correct standard errors for departures from non-normality. For detailed information on the implementations of these algorithms in Mplus, see Muthén and Muthén (2011). To examine possible bifactor or nested structure among the task contrasts, a bifactor rotation criterion was applied to the factor loading matrix (λ) of the initial solution (Jennrich and Bentler, 2012). Importantly, the use of rotation procedures does not alter the fit of the model to the data (MacCallum, 2009). The bifactor rotation criterion attempts to rotate the initial factor loading matrix toward a loading matrix with strong loadings of the first factor (general factor) and perfect cluster structure for the loadings on the remaining factors (subfactors). There are two types of bifactor rotation criteria: orthogonal and oblique (Jennrich and Bentler, 2012). An orthogonal rotation constrains the factors to be uncorrelated, whereas an oblique rotation allows the factors to correlate with each other. Because orthogonal rotations constrain the factors to be uncorrelated and are generally not recommended without an a priori hypothesis of independence for the factors (Costello and Osborne, 2005; MacCallum, 2009), we used the bifactor geomin rotation criteria, a commonly used oblique rotation criteria (Hendrickson and White, 1964). The bifactor geomin rotation criteria maximizes loadings for all contrast maps on the first column (corresponding to the general factor) of the factor loading matrix and minimizes a measure called complexity (the number of nonzero elements in the corresponding row of the factor loading matrix) for all contrast maps on the remaining columns of the factor loading matrix, which has the effect of enforcing sparsity on the loadings in the matrix. The output of the rotation procedure is a new “rotated” factor loading matrix (i.e., pattern matrix), representing the correlation between each contrast map and each factor, controlling for its association with the other factors. The pattern of factor loadings on each factor was then used to interpret the types of task demands/cognitive processes associated with each factor. Significance estimates are also estimated for each task contrast-factor loading pair from the estimated robust standard errors (derived from the MLR estimation procedure). The significance estimates for the factor loadings were not corrected for multiple comparisons (p < 0.05), given that the results implied by the factor analysis (10 factors underlying the substantial majority of the variance in the data) imply strong dependencies among the task contrasts.
The MLR estimation procedure also produces explained variance estimates for each factor, as well as communality estimates for each contrast map. The explained variance estimates represent the variance among all of the contrast maps that is explained by each factor. However, these estimates for each factor are approximate in an oblique solution because independent explained variance estimates for each factor are not possible when the factors are correlated. The explained variance estimate for each factor are more accurate to the degree that the factor is orthogonal (statistically uncorrelated) with the other factors in the solution. Thus, the explained variance estimates reported in the results are approximate, except for the general factor, which is orthogonal, or statistically uncorrelated with, the subfactors. The communality estimate is the proportion of variance in that variable accounted for by the extracted factors and represents the degree to which that contrast is represented in the solution.
Computation of factor scores.
To compute a brain region's (i.e., each ROI of the high-resolution parcellation) standardized “score” for each factor, we used a least-squares estimation method, known as the Bartlett method (Bartlett, 1937; Lawley and Maxwell, 1962). The Bartlett method of factor score computation is similar to the ordinary least-squares approach, where the factor score (θ vector in Eq. 1) at each region is estimated from the observed X data matrix and λ matrix of factor loadings, but the added condition that the communality estimates (described above) weight each contrast from the factor solution. Thus, brain region values from contrasts that are better captured by the factor solution contribute more to the factor score at that brain region (Bartlett, 1937). In addition, the Bartlett method computes factor scores that are highly correlated to their corresponding factor and not with the other extracted factors. The resulting factor scores for each region were then mapped back to the brain, smoothed using a 6 mm FWHM Gaussian kernel for smoother boundaries among neighboring regions of the brain, and visualized on an MNI 152 surface template using BrainNet Viewer software (Xia et al., 2013). The resulting brain maps correspond to each factor's representation in standard brain space.
Comparison of alternative factor structures with bifactor model.
To test whether alternative factor models fit the data equally well, we used a confirmatory factor analysis (CFA) approach that measured the overall fit of two alternative factor models compared with the bifactor model. CFA operates in the opposite “direction” from the exploratory factor analysis model used above and involves the fitting of an a priori factor model, with variable-factor loadings specified by the user, to the data. From a path diagram perspective, this can be conceptualized as specifying a priori links from the factors to the task contrasts. The overall fit of the a priori factor models to the data is assessed using a variety of global fit indices (Fan et al., 1999; Bentler, 2007; Iacobucci, 2010) that all measure the discrepancy between the covariance matrix implied by the factor model and the sample covariance matrix (covariance between the observed variables). Four global fit indices were used to compare the overall fit of each model to the data: root mean square error of approximation (RMSEA), comparative fit index (CFI), Tucker-Lewis index (TLI), and the standardized root mean square residual (SRMR). Lower values for the RMSEA and SRMR represent greater overall fit, and higher values for the CFI and TLI represent greater overall fit. As with the exploratory bifactor analysis, both CFA models were analyzed in Mplus.
Study/sample-specific non-nested alternative factor model.
One possible concern with combining together unthresholded statistic images across studies is that the majority of differences among the statistical images may be driven by sampling and scanner-site differences (Friedman et al., 2006). Overall, there were 19 collections of task contrasts, but four collections consisted of one task contrast and a factor with a single indicator, which was not identifiable (i.e., parameters could not be uniquely estimated) (Brown, 2015), and were not included in the CFA for either the standard non-nested alternative exploratory factor analysis model or for the bifactor model described below. Thus, the non-nested factor model included 15 orthogonal factors (no covariance between factors), corresponding to 15 collections (13 Neurovault collections, HCP, and BioBank) of task contrasts. Three factors (corresponding to three collections) consisted of two task contrasts and were not identifiable (because of the independence of the factor), and were thus allowed to arbitrarily covary with the HCP factor, the largest factor, for identification. The adding of parameters to be estimated, however arbitrary, does not decrease, but improves overall model fit.
Standard exploratory factor analysis non-nested alternative factor model.
To compare the data-driven nested bifactor model with an alternative data-driven non-nested factor model, we performed a standard non-nested exploratory factor analysis with a promax (Hendrickson and White, 1964; Cureton and Mulaik, 1975) rotation using the same MLR estimation procedure used for the bifactor analysis. Ten non-nested factors were chosen to be estimated, the same as the number of factors in the bifactor model. The resulting rotated factor loadings were then used to construct a non-nested factor model. Specifically, each task contrast was specified as loading on the factor to which it had the strongest loading. Eight nonorthogonal (allowed to covary) factors were specified in the factor model, as one factor did not have a single strongest task contrast loading and the other factor had only one strongest task contrast loading, and was not identifiable. To keep the one task contrast, “Simon_Incongruent_Incorrect,” in the factor model, it was specified as loading on the factor to which its paired task contrast, “Simon_Congruent_Incorrect,” had the strongest loading.
Nested bifactor model.
The results from the exploratory bifactor analysis were used to construct a confirmatory bifactor model. As described in Results, the bifactor model included 10 factors: a general factor and nine subfactors. For each task contrast, two factor loadings were specified: a factor loading on the single, general factor, along with a single subfactor, corresponding to its strongest subfactor loading from the exploratory bifactor analysis.
Split-half reliability analysis.
To address the replicability or stability of a potential bifactor structure among task-activation maps, we conducted a stability test of our bifactor structure by conducting an exploratory bifactor analysis on a randomly selected half of the total activation maps. This was performed 10 times. We extracted all factors with eigenvalues >1 (i.e., Kaiser criterion).
Results
Conjunction analysis
To test whether the full set of 108 brain activation maps exhibited the commonly observed superordinate, task-positive and task-negative activation pattern, we performed a conjunction analysis by summing binarized activation and deactivation estimates across all maps. The results (Fig. 3) for both activation and deactivation maps correspond closely to the classic task-positive (Duncan, 2010; Fedorenko et al., 2013; Hugdahl et al., 2015) and task-negative activity (Raichle et al., 2001; Fox et al., 2005) described in previous neuroimaging studies. The strongest areas of overlap in the brain-activation conjunction analysis included the posterior medial prefrontal cortex (pMPFC), anterior insula, superior parietal cortex, dorsolateral prefrontal cortex (dlPFC), and visual network areas. Activation overlap was strongest in the pMPFC and in the fusiform area of the visual network, with some voxels within these areas active across 90% (97 of 108) of all activation maps. The highest areas of overlap in the task-deactivation conjunction were in the default mode network, comprised of the ventromedial prefrontal cortex (vmPFC), the precuneus/posterior cingulate cortex (precuneus/PCC) and the bilateral inferior parietal cortices (IPC). Interestingly, average overlap was higher in the task-activation conjunction (MaxOverlap = 97) compared with the task-deactivation conjunction (MaxOverlap = 81), indicating that the pattern of task-related deactivation was less consistent (i.e., more variable) compared with the pattern of task-related activation.
Figure 3.

Conjunction analysis of all activation maps. The results of the conjunction analysis examining the consistency/overlap of the task-activation/deactivation across all activation maps. A, Conjunction maps visualized on an MNI surface template. Values for each voxel represent the amount of times that voxel was activated or deactivation across all 108 activation maps. B, Histogram displaying the frequency distribution of the consistency/overlap values for all voxels. The distribution follows an exponentially decreasing curve, with the majority of voxels observed to have low consistency values. As can be seen from the conjunction maps and the histograms, greater consistency values (both average and maximum consistency values) are observed in task-activation, as opposed to task-deactivation, patterns.
Initial extraction
To estimate the number of factors among the brain activation maps, a parallel analysis was conducted (Fig. 4) that involved comparison of mean “random” component eigenvalues (analogous to the amount of explained variance) from permuted versions of the original data matrix to the component eigenvalues extracted from the original data matrix. The parallel analysis indicated that a 10 factor solution best represented the data, explaining a total of 83.39% percent of the variance among the activation maps.
Figure 4.
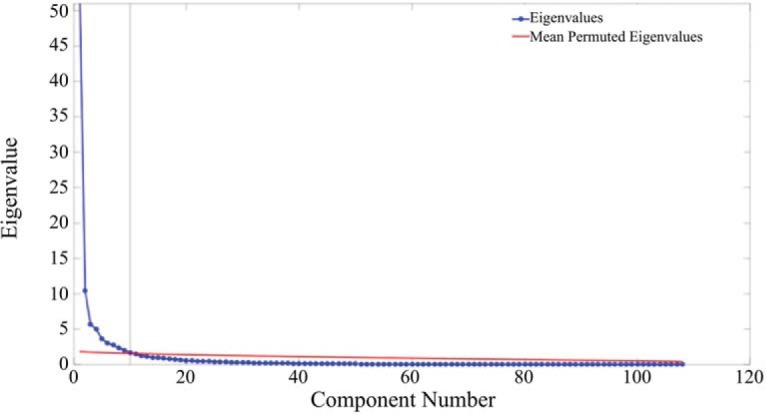
Parallel analysis. A plot of the mean permuted eigenvalues (red) and the component eigenvalues of the original data matrix. The eigenvalue is plotted along the vertical axis, and the component number is plotted along the horizontal axis. Component eigenvalues were greater than the mean permuted eigenvalues up to component 10 (horizontal black line), indicating that a 10 factor solution was appropriate.
Bifactor analysis
A bifactor model was then estimated from the data with a 10 factor solution involving one single general factor and nine subfactors. The communality estimates, representing the proportion of variance in each variable accounted for by the bifactor solution (R2), indicated that the substantial majority of activation maps were captured fairly accurately in the bifactor solution (all R2 > 0.4) (Costello and Osborne, 2005). Only four of the 108 activation maps were not adequately captured by the 10 factor solution (R2 < 0.4). Examination of the activation/deactivation patterns of the low communality activation maps revealed that these maps deviated significantly from the dominant task-positive/task-negative pattern with activation localized to the motor cortex (activation maps associated with simple motor movements) (Fig. 5). The pattern of factor loadings, representing the association between each activation map and each factor, was then examined for potential bifactor or nested structure.
Figure 5.

Brain activation maps with low communalities in bifactor solution. Z-statistic images for motor tongue movements, incorrect trials for the incongruent trial types of the Simon Task, motor left-hand movements, and average saccade movement from a saccade conflict task. Examination of activity patterns from all four contrasts reveals that they deviate from the dominant pattern of activity in Figure 2.
General factor
As hypothesized, a general factor was prevalent in the data (Fig. 6). In particular, the general factor accounted for the majority of the common variance among the brain activation maps (52.37%), and 94 of 108 maps had statistically significant loadings on the general factor. The 14 brain activation maps that did not have significant loadings on the general factor were associated with simple motor movements (e.g., finger movements in response to visual cues) and processing of simple auditory stimuli (e.g., button presses in response to an auditory cue). The strongest factor loadings on the general factor included a variety of types of task demands and stimulus types: affective facial processing, visual working memory, and visual pattern comparison. Factor score patterns (see Materials and Methods) in the cortex, representing the degree that each factor is present (positively or negatively) in each region of the brain, corresponded to the canonical task-positive/task-negative pattern observed in previous studies: positive scores (activation) in pMPFC, dlPFC, and the superior parietal cortex, along with negative scores (deactivation) in the vmPFC, P/PCC, and IPC. Activation also extended into primary visual cortex (V1), higher-order visual object processing areas in occipitotemporal areas of the brain, such as the fusiform gyrus, as well as the primary motor cortex, possibly corresponding to the common experimental setup of button responses from fingers of the right or left hand in response to visual stimuli.
Figure 6.

General factor loadings and factor score visualization. NV, NeuroVault; CNR, Cognitive Neuroscience Lifespan Repository; AP, Auditory Processing; BART, Balloon Analog Risk Taking; EF, Erikson Flanker; Episodic, Episodic Recall; ER, Emotional Regulation; FB, False Belief; FC, Food Choice; FL, Functional Localizer; LD, Lexical Decision; LR, Logical Reasoning Task; MC, Mental Calculation; MS, Match to Sample; PC, Pattern Comparison; SD, Speech Detection; Simon, Simon Task; SM, Semantic Memory; SJ, Social Judgment; SR, Sentence Reading; SS, Stop Signal; TD, Temporal Discounting; TOM, Theory of Mind; VP, Visual Processing; W_1back, Word 1Back; WM, Working Memory. A, The loading of each activation map on the general factor, which represents the association between each map and each factor. Each map is preceded by a letter (P, E, C, and A) corresponding to its proposed dominant behavioral domain (Perception, Emotion, Cognition, or Action). The activation map labels are displayed along the vertical axis. The p value of their factor loading on the general factor is presented to the right of the label (in parentheses). Loading values of each activation map are represented by a heat map. Warmer colors represent stronger loadings; cooler colors represent weaker loadings. Of 108 activation maps, 94 had significant loadings on the general factor. B, Factor scores for each region were placed in MNI coordinates and visualized on a surface MNI template. Warmer colors represent positive scores; cooler colors represent negative factor scores. The pattern of positive and negative scores for the general factor followed the canonical task-positive/task-negative activation/deactivation pattern.
Subfactors
Factor loadings exhibited strong clustering across the nine distinct subfactors (Fig. 7), with at least four brain activation maps with strong loadings solely on each subfactor. All subfactors explained a similar small amount of variance in the data (∼3%), with the exception of factor three that explained ∼9% of the data. In addition, the subfactors were relatively orthogonal (|r| = 0.08; range: −0.216–0.272), although the bifactor model allowed for correlated subfactors. Examination of the factor scores associated with each subfactor revealed a variety of task-positive/task-negative patterns. Notably, positive scores in the pMPFC, encompassing the presupplementary motor area/supplementary motor area and dorsal anterior cingulate cortex, were observed across all subfactors. High positive scores in the dlPFC and anterior insula were also observed across many of the nine subfactors as well, but with less consistency than the pMPFC. In agreement with the results of the conjunction analysis, the pattern of negative scores across the nine subfactors was much less consistent. However, strong negative scores within at least one of the areas of the DMN (vmPFC, P/PCC, and IPC) were observed across all subfactors, with the exception of factor 8.
Figure 7.

Subfactor loadings and factor score visualization. A, The loading of each activation map on each subfactor, which represents the association between each map and each subfactor, controlling for the association with other subfactors. The activation map labels are displayed along the vertical axis and the nine subfactors (F2-F10) are displayed along the horizontal axis. The p value associated with each activation maps strongest subfactor loading is presented to the right of the label (in parentheses). Factor loadings were represented by a heat map. Warmer colors represent stronger loadings; cooler colors represent weaker loadings. B, Factor scores associated with each subfactor were placed in MNI coordinates and visualized on a surface MNI template. Warmer colors represent positive scores; cooler colors represent negative factor scores.
For initial categorization, subfactors were grouped based on their pattern of factor scores into predominantly auditory-temporal, visual-parietal, and prefrontal subfactors. The auditory subfactors included subfactors 3 and 4, and both exhibited strong positive scores in the primary auditory cortex (superior temporal gyrus). Outside of the primary auditory cortex, positive scores for subfactor 3 were predominantly observed in regions of the pMPFC, anterior insula, frontal poles, and the sensorimotor cortices. The strongest loadings on subfactor 3 were observed in brain activation maps associated with quick motor responses to predominantly auditory stimuli, such as right button and left button responses to auditory cues, and sometimes visual stimuli, such as “GO” stimuli from a stop-signal task or simple visual cues requiring a simple motor response. Interestingly, although activation maps associated with visual stimuli had their strongest loadings on this subfactor, negative scores were predominantly observed in early visual processing areas. However, the majority of visual activation maps demanded swift motor responses or preparation of motor responses to quickly presented visual cues, which is consistent with positive scores observed in the posterior parietal cortex of the dorsal “where” visual pathway for subfactor 3. Positive scores for subfactor 4 outside of the primary auditory cortex were predominantly observed in the inferior frontal gyrus (primarily concentrated in the frontal operculum) and primary visual cortex. The strongest loadings on subfactor 4 were observed for activation maps associated with extended processing of complex aurally or visually presented language stimuli, such as sentences, stories, and foreign languages.
Subfactors 2, 6, 7, and 9 were categorized as visual-parietal subfactors because strong positive scores were observed in the primary visual cortex, inferior and medial temporal lobe (including the fusiform gyrus), or posterior parietal cortices of these subfactors. In addition, the activation maps that loaded strongly on each subfactor involved the presentation of complex visual stimuli, including facial stimuli for subfactor 2, food for subfactor 6, mental manipulation of complex objects and symbols for subfactor 7, and motor movements in response to facial (same stimuli in subfactor 2) or object stimuli for subfactor 9. Differences in the pattern of factor scores associated with each subfactor were also present. For example, positive scores in subfactor 7 extended into the posterior parietal cortex, encompassing both the medial posterior parietal cortex that included the P/PCC region of the DMN, and the superior parietal cortex, consistent with the complex mental and spatial processing associated with the fluid reasoning processes modeled by the paper folding, letter set, and matrix reasoning activation maps.
Subfactors 5, 8, and 10 were classified as prefrontal subfactors given strong positive scores were predominantly observed in lateral and medial prefrontal cortices. The brain activation maps that loaded strongly on these subfactors involved cognitive processing of visual stimuli, including active viewing of complex visual stimuli for subfactor 5, working memory and complex cognitive processing processing of visual stimuli (2-back task, mental subtraction, relational comparison, and gambling task) for subfactor 8, and vocabulary processing of visually presented words for subfactor 10. Interestingly, the pattern of positive scores in the lateral prefrontal cortices (dlPFC and inferior frontal gyrus) for subfactors 5 and 10 were strongly lateralized. In particular, positive scores were predominantly in the right lateral prefrontal cortices for subfactor 5 and left lateral prefrontal cortices for subfactor 10, which may reflect hemispheric asymmetries in visuospatial and language processing in the right and left hemispheres, respectively (Geschwind, 1970; Shulman et al., 2010). Of note, no positive scores were observed in the medial surface of the primary visual cortex for subfactor 5, although most activation maps loading on this subfactor were associated with processing of complex visual stimuli. However, positive scores were observed in the lateral occipital and medial temporal areas (regions comprising the ventral “where” pathway) (Mishkin et al., 1983), consistent with the complex nature of the visual stimuli.
Bifactor/nested factor model versus non-nested factor model
To test whether an alternative non-nested factor model fit the data equally well, we used a CFA approach that measured the overall fit of the alternative factor model compared with the bifactor model. We used a CFA approach that involved comparing the overall fit to the data confirmatory bifactor/nested model derived from the exploratory bifactor analysis (10 factor model with one general factor and nine subfactors) and an alternative non-nested factor analysis model constructed from the results of a standard exploratory factor analysis applied to the same set of brain activation maps. The results for all fit indices revealed that the bifactor model (RMSEA = 0.16, CFI = 0.504, TLI = 0.48, SRMR = 0.09) had greater overall fit to the data compared with the non-nested standard exploratory factor analysis model (RMSEA = 0.171, CFI = 0.415, TLI = 0.4, SRMR = 0.158). In addition, to ensure results were not driven by sampling, preprocessing, or scanner-site differences between different collections of brain activation maps, the confirmatory bifactor/nested model derived from the exploratory bifactor analysis was also compared with an alternative non-nested study/collection-specific confirmatory model with orthogonal factors representing each study/collection and loadings on each factor from activation maps within that study/collection. The results for all fit indices revealed that the bifactor model also had greater overall fit to the data than the non-nested study-specific factor model (RMSEA = 0.175, CFI = 0.388, TLI = 0.376, SRMR = 0.463).
Split-half reliability analysis
The bifactor solution of each randomly permuted split-half sample included a general factor that explained the substantial majority of variance in the sample (mean R2: 0.498%; range: 0.476%–0.532%). In each solution, a comparable number of subfactors were present as well (range: 7–9). For each of the subfactor solutions, there were similar auditory-temporal, visual-parietal, and prefrontal subfactors compared with the original solution. For example, a “facial judgment” subfactor appeared in 8 of 10 permuted samples. These results suggest that the bifactor structure observed among task-activation maps is stable across different task samples.
Discussion
The central goal of this study was to test a hypothesized framework of functional organization of the human brain in terms of a nested structure of brain activation patterns with a single domain-general brain activation/deactivation pattern, and various subgroupings of patterns that represent different manifestations of the canonical pattern. Consistent with a nested factor structure, the single general factor explained the majority of the variance (52.37%) in the collection of brain activation maps, and 94 of 108 maps had significant loadings on the general factor. In addition to the general factor were nine subfactors associated with various groupings of task features, which explained another 31.02% of variance in the collection of brain activation maps. Importantly, the nested-factor model provided a better overall fit to the data than an alternative, data-driven non-nested factor model.
While the brain activation maps in the current study exhibited highly consistent patterns of activation/deactivation in certain areas of the cortex, as indicated by the conjunction analysis, the bifactor analysis results revealed a complex structure of task-positive/task-negative activity patterns. In particular, the bifactor analysis results are consistent with a bifactor or nested structure of brain function with a task-general process that presents in different modes depending on certain task features. We suggest that the current results of the bifactor analysis offer a starting point for a general ontology of psychological categories incorporating data-driven analyses of fMRI activation patterns. The canonical task-positive/task-negative pattern of task activity has been hypothesized to indicate a domain-general cognitive process corresponding to “focused awareness” (Hugdahl et al., 2015) or “attentional episodes” (Duncan, 2010). Given the wide range of task domains that significantly load on the general factor, this strongly suggests a domain-general cognitive process represented by the activation/deactivation patterns, which may indeed be described as a process of “focused awareness,” “attentional episodes,” or “effortful control” present across all these task states. The brain activation maps that did not have significant loadings on the general factor involved routine motor responses to simple visual or auditory cues and listening to stories or sentences presented in the auditory modality. Thus, the cognitive process represented by this domain-general factor may not extend to contexts of automatic, routine response patterns, or passive perception of external stimuli.
Analysis of the subfactors suggests the two primary features of the task that differentiate one form of “attention” or “awareness” from another is the modality of the stimulus presentation and the nature of the cognitive processing required by the stimulus. In other words, rather than one form of “awareness” or “attention,” we suggest multiple types of “focused awareness” and “attention episodes,” depending on these two features of the task conditions. For example, a possible interpretation of subfactors 3 and 4 is an auditory “focused awareness” or “attentional episode” involving goal-directed responses to auditory stimuli. A possible interpretation of subfactor 8 is a short-term memory “focused awareness” that involves goal-directed attention toward short-term memory traces for subsequent responses. The semantic content of the stimulus, or the meaning of the stimulus, does not seem to be a primary feature of the task that differentiates one subfactor from another, as a variety of semantically different stimuli were present in the tasks that loaded on the same subfactor. For example, the visual stimuli used in the tasks that loaded on subfactor 5 included houses, sentences, faces, and moving shapes, and the auditory stimuli of subfactor 4 included sentences, a math problem, stories, and words presented in French.
Previous studies have reported the existence of a general activation/deactivation pattern and that task-activation maps cluster together according to particular features of the task stimuli and task demands using conjunction analyses (Duncan and Owen, 2000; Fedorenko et al., 2013) and meta-analytic activation coordinate analyses (Fox and Lancaster, 2002; Toro et al., 2008; Yeo et al., 2015), respectively. The novelty of the results presented here is the evidence of a nested structure of cognitive factors that captures a general task activation/deactivation pattern and task-specific activation/deactivation patterns within the same model. Evidence for a nested factor structure of task-activation patterns points to a hierarchical theory of cognition in contrast to a traditionally conceived “modular,” faculty-based theory of cognition. Modular-based theories classify cognitive processes according to fixed, compartmental categories, such as “working memory,” “attention,” or “social cognition,” without an overarching hierarchical organization. In contrast, the hierarchical theory of cognition proposed here involves a task-general, superordinate cognitive process, and subordinate processes that correspond to task-specific features. This is more in line with a constructionist theory of psychology (Barrett et al., 2007; Lindquist and Barrett, 2012; Barrett and Satpute, 2013) that explains cognition in terms of domain-general psychological processes supported by unique brain networks (e.g., salience network, DMN, frontoparietal network) that combine and interact to form different instances of cognition. However, as opposed to a single level of domain-general psychological processes, we have found evidence for a hierarchical domain-general structure, in which a core task-general process is a fundamental “ingredient” in all forms of cognition. Analysis of the subfactors reveals that the modality of the stimulus and the nature of the cognitive processing required by the stimulus are the dominant task-specific features that explain the clustering of activation patterns into subfactors out of other possible task features, such as the semantic content of the task stimuli.
Another novel feature of this study is the use of unthresholded task-activation images, as opposed to meta-analytic activation coordinates. The primary advantage of unthresholded statistic images are more accurate assessments of relationships among the statistic images, which allows for the application of a wider variety of covariance modeling methods to assess the common relationships among the images. Another advantage is the additional information regarding task “deactivation.” When researchers examine brain activity in response to task onsets and offsets, these images are normally positively thresholded, removing information regarding reduced brain activity to task onsets and offsets. This information may be important in understanding the cognitive processes at work in each task condition. Task-negative activity, or default mode network deactivation, and its relationship to task-positive activity, has been related to individual differences in behavior (Kelly et al., 2008) and is thought to index task difficulty (Greicius and Menon, 2004). Indeed, as demonstrated in the factor analytic approach here, negative score patterns can distinguish between the different factors that have relatively similar positive score patterns. For example, negative score patterns were observed in different areas of the DMN between subfactors, such as the P/PCC, IPC, and vmPFC. These findings are consistent with the observation that the DMN is not unitary but can be divided into anterior, posterior, and lateral components (Laird et al., 2009; Uddin et al., 2009; Andrews-Hanna et al., 2010; Leech et al., 2011; Sestieri et al., 2011; Yeo et al., 2014).
Limitations
While a large variety of brain activation maps from several task domains were examined in this study, the full space of psychological functioning was not covered. The limited availability of unthresholded individual and group statistic images restricts the amount of possible task comparisons. Given this limited availability, it is unlikely that the current partition of subfactors represents the final “true” partition, in terms of the number and variety of subfactors. However, we think that future studies with larger task comparisons from online resources, such as NeuroVault (Gorgolewski et al., 2015), will be able to achieve a greater sampling of task domains and, thus, a more precise estimation of possible latent subfactors. Another limitation in the approach used here is the potential for common activation patterns to be due to common experimental design choices, as opposed to general cognitive functioning. We have noted where this is most likely the case, such as common left motor cortex activation across activation maps (corresponding to the common practice of participant responses recorded from the right hand). However, as described above, the clustering of activation maps into subfactors is predominantly due to common cognitive-relevant task features, such as motor movements, auditory processing, and visual text. In addition, a single subfactor included activation maps with many different experimental design parameters (e.g., event vs block type, response vs no response, static vs moving stimuli).
In conclusion, we propose that a central organizing feature of brain function is a bifactor or nested factor structure involving a general, overarching factor representing a “focused awareness” and “attention allocation” process. This general factor is differentiated by several subfactors according to the experimental context in which the process occurs. We take as an assumption, which we believe is shared by most cognitive neuroscientists (but see Uttal, 2003; Bennett and Hacker, 2003), that task fMRI studies are relevant for the delineation of an adequate model of psychological processes (Anderson, 2015). Our approach in this study can be seen as a part of the ongoing project to define a cognitive ontology, or a taxonomy of cognitive processes, in light of neurobiological evidence (Klein, 2012; Anderson, 2015; Poldrack and Yarkoni, 2016). We think that the nested model of human brain function derived from our approach provides a framework in which a revised, biologically informed cognitive ontology can be formulated.
Footnotes
This work was supported by National Institute of Mental Health R01MH107549, International Society for Autism Research Slifka/Ritvo Innovation in Autism Research Award, and National Alliance for Research on Schizophrenia and Depression Young Investigator Award to L.Q.U. B.T.T.Y. was supported by Singapore MOE Tier 2 (MOE2014-T2-2-016), NUS Strategic Research (DPRT/944/09/14), NUS SOM Aspiration Fund (R185000271720), Singapore NMRC (CBRG/0088/2015), NUS YIA, and Singapore NRF fellowship (NRF-NRFF2017-06).
The authors declare no competing financial interests.
References
- Anderson ML. (2015) Mining the brain for a new taxonomy of the mind. Philos Compass 10:68–77. 10.1111/phc3.12155 [DOI] [Google Scholar]
- Andrews-Hanna JR, Reidler JS, Sepulcre J, Poulin R, Buckner RL (2010) Functional-anatomic fractionation of the brain's default network. Neuron 65:550–562. 10.1016/j.neuron.2010.02.005 [DOI] [PMC free article] [PubMed] [Google Scholar]
- Barch DM, Burgess GC, Harms MP, Petersen SE, Schlaggar BL, Corbetta M, Glasser MF, Curtiss S, Dixit S, Feldt C, Nolan D, Bryant E, Hartley T, Footer O, Bjork JM, Poldrack R, Smith S, Johansen-Berg H, Snyder AZ, Van Essen DC (2013) Function in the human connectome: task-fMRI and individual differences in behavior. Neuroimage 80:169–189. 10.1016/j.neuroimage.2013.05.033 [DOI] [PMC free article] [PubMed] [Google Scholar]
- Barrett LF, Satpute AB (2013) Large-scale brain networks in affective and social neuroscience: towards an integrative functional architecture of the brain. Curr Opin Neurobiol 23:361–372. 10.1016/j.conb.2012.12.012 [DOI] [PMC free article] [PubMed] [Google Scholar]
- Barrett LF, Lindquist KA, Gendron M (2007) Language as context for the perception of emotion. Trends Cogn Sci 11:327–332. 10.1016/j.tics.2007.06.003 [DOI] [PMC free article] [PubMed] [Google Scholar]
- Bartlett MS. (1937) The statistical conception of mental factors. Br J Psychol Gen Sect 28:97–104. 10.1111/j.2044-8295.1937.tb00863.x [DOI] [Google Scholar]
- Bennett MR, Hacker PMS (2003) Philosophical foundations of neuroscience, Ed 1 Malden, MA: Wiley-Blackwell. [Google Scholar]
- Bentler PM. (2007) On tests and indices for evaluating structural models. Personal Individ Differ 42:825–829. 10.1016/j.paid.2006.09.024 [DOI] [Google Scholar]
- Bertolero MA, Yeo BT, D'Esposito M (2015) The modular and integrative functional architecture of the human brain. Proc Natl Acad Sci U S A 112:E6798–E6807. 10.1073/pnas.1510619112 [DOI] [PMC free article] [PubMed] [Google Scholar]
- Brooks JC, Faull OK, Pattinson KT, Jenkinson M (2013) Physiological noise in brainstem FMRI. Front Hum Neurosci 7:623. 10.3389/fnhum.2013.00623 [DOI] [PMC free article] [PubMed] [Google Scholar]
- Brown TA. (2015) Confirmatory factor analysis for applied research. New York: Guilford. [Google Scholar]
- Calhoun VD, Kiehl KA, Pearlson GD (2008) Modulation of temporally coherent brain networks estimated using ICA at rest and during cognitive tasks. Hum Brain Mapp 29:828–838. 10.1002/hbm.20581 [DOI] [PMC free article] [PubMed] [Google Scholar]
- Costello AB, Osborne JW (2005) Best practices in exploratory factor analysis: four recommendations for getting the most from your analysis. Pract Assess Res Eval 10:173–178. [Google Scholar]
- Craddock RC, James GA, Holtzheimer PE 3rd, Hu XP, Mayberg HS (2012) A whole brain fMRI atlas generated via spatially constrained spectral clustering. Hum Brain Mapp 33:1914–1928. 10.1002/hbm.21333 [DOI] [PMC free article] [PubMed] [Google Scholar]
- Cureton EE, Mulaik SA (1975) The weighted varimax rotation and the promax rotation. Psychometrika 40:183–195. 10.1007/BF02291565 [DOI] [Google Scholar]
- Curtis CE, D'Esposito M (2003) Persistent activity in the prefrontal cortex during working memory. Trends Cogn Sci 7:415–423. 10.1016/S1364-6613(03)00197-9 [DOI] [PubMed] [Google Scholar]
- Damasio AR, Grabowski TJ, Bechara A, Damasio H, Ponto LL, Parvizi J, Hichwa RD (2000) Subcortical and cortical brain activity during the feeling of self-generated emotions. Nat Neurosci 3:1049–1056. 10.1038/79871 [DOI] [PubMed] [Google Scholar]
- Desmond JE, Glover GH (2002) Estimating sample size in functional MRI (fMRI) neuroimaging studies: statistical power analyses. J Neurosci Methods 118:115–128. 10.1016/S0165-0270(02)00121-8 [DOI] [PubMed] [Google Scholar]
- Driver J, Noesselt T (2008) Multisensory interplay reveals crossmodal influences on “sensory-specific” brain regions, neural responses, and judgments. Neuron 57:11–23. 10.1016/j.neuron.2007.12.013 [DOI] [PMC free article] [PubMed] [Google Scholar]
- Duncan J. (2010) The multiple-demand (MD) system of the primate brain: mental programs for intelligent behaviour. Trends Cogn Sci 14:172–179. 10.1016/j.tics.2010.01.004 [DOI] [PubMed] [Google Scholar]
- Duncan J, Owen AM (2000) Common regions of the human frontal lobe recruited by diverse cognitive demands. Trends Neurosci 23:475–483. 10.1016/S0166-2236(00)01633-7 [DOI] [PubMed] [Google Scholar]
- Fan X, Thompson B, Wang L (1999) Effects of sample size, estimation methods, and model specification on structural equation modeling fit indexes. Struct Equ Model Multidiscip J 6:56–83. 10.1080/10705519909540119 [DOI] [Google Scholar]
- Fedorenko E, Duncan J, Kanwisher N (2013) Broad domain generality in focal regions of frontal and parietal cortex. Proc Natl Acad Sci U S A 110:16616–16621. 10.1073/pnas.1315235110 [DOI] [PMC free article] [PubMed] [Google Scholar]
- Fox MD, Snyder AZ, Vincent JL, Corbetta M, Van Essen DC, Raichle ME (2005) The human brain is intrinsically organized into dynamic, anticorrelated functional networks. Proc Natl Acad Sci U S A 102:9673–9678. 10.1073/pnas.0504136102 [DOI] [PMC free article] [PubMed] [Google Scholar]
- Fox PT, Lancaster JL (2002) Mapping context and content: the BrainMap model. Nat Rev Neurosci 3:319–321. 10.1038/nrn789 [DOI] [PubMed] [Google Scholar]
- Friedman L, Glover GH, Krenz D, Magnotta V (2006) Reducing inter-scanner variability of activation in a multicenter fMRI study: role of smoothness equalization. Neuroimage 32:1656–1668. 10.1016/j.neuroimage.2006.03.062 [DOI] [PubMed] [Google Scholar]
- Geschwind N. (1970) The organization of language and the brain. Science 170:940–944. 10.1126/science.170.3961.940 [DOI] [PubMed] [Google Scholar]
- Glasser MF, Sotiropoulos SN, Wilson JA, Coalson TS, Fischl B, Andersson JL, Xu J, Jbabdi S, Webster M, Polimeni JR, Van Essen DC, Jenkinson M, WU-Minn HCP Consortium (2013) The minimal preprocessing pipelines for the Human Connectome Project. NeuroImage 80:105–124. 10.1016/j.neuroimage.2013.04.127 [DOI] [PMC free article] [PubMed] [Google Scholar]
- Glover GH. (1999) Deconvolution of impulse response in event-related BOLD fMRI. Neuroimage 9:416–429. 10.1006/nimg.1998.0419 [DOI] [PubMed] [Google Scholar]
- Gorgolewski KJ, Varoquaux G, Rivera G, Schwarz Y, Ghosh SS, Maumet C, Sochat VV, Nichols TE, Poldrack RA, Poline JB, Yarkoni T, Margulies DS (2015) NeuroVault.org: a web-based repository for collecting and sharing unthresholded statistical maps of the human brain. Front Neuroinformatics 9:8. 10.3389/fninf.2015.00008 [DOI] [PMC free article] [PubMed] [Google Scholar]
- Greicius MD, Menon V (2004) Default-mode activity during a passive sensory task: uncoupled from deactivation but impacting activation. J Cogn Neurosci 16:1484–1492. 10.1162/0898929042568532 [DOI] [PubMed] [Google Scholar]
- Hendrickson AE, White PO (1964) Promax: a quick method for rotation to oblique simple structure. Br J Stat Psychol 17:65–70. 10.1111/j.2044-8317.1964.tb00244.x [DOI] [Google Scholar]
- Hugdahl K, Raichle ME, Mitra A, Specht K (2015) On the existence of a generalized non-specific task-dependent network. Front Hum Neurosci 9:430. 10.3389/fnhum.2015.00430 [DOI] [PMC free article] [PubMed] [Google Scholar]
- Iacobucci D. (2010) Structural equations modeling: fit indices, sample size, and advanced topics. J Consum Psychol 20:90–98. 10.1016/j.jcps.2009.09.003 [DOI] [Google Scholar]
- Jenkinson M, Smith S (2001) A global optimisation method for robust affine registration of brain images. Med Image Anal 5:143–156. 10.1016/S1361-8415(01)00036-6 [DOI] [PubMed] [Google Scholar]
- Jennrich RI, Bentler PM (2012) Exploratory bi-factor analysis: the oblique case. Psychometrika 77:442–454. 10.1007/s11336-012-9269-1 [DOI] [PubMed] [Google Scholar]
- Kanwisher N, Wojciulik E (2000) Visual attention: insights from brain imaging. Nat Rev Neurosci 1:91–100. 10.1038/35039043 [DOI] [PubMed] [Google Scholar]
- Kelly AM, Uddin LQ, Biswal BB, Castellanos FX, Milham MP (2008) Competition between functional brain networks mediates behavioral variability. Neuroimage 39:527–537. 10.1016/j.neuroimage.2007.08.008 [DOI] [PubMed] [Google Scholar]
- Klein C. (2012) Cognitive ontology and region- versus network-oriented analyses. Philos Sci 79:952–960. 10.1086/667843 [DOI] [Google Scholar]
- Krienen FM, Yeo BT, Buckner RL (2014) Reconfigurable task-dependent functional coupling modes cluster around a core functional architecture. Philos Trans R Soc Lond B Biol Sci 369:20130526. 10.1098/rstb.2013.0526 [DOI] [PMC free article] [PubMed] [Google Scholar]
- Laird AR, Eickhoff SB, Li K, Robin DA, Glahn DC, Fox PT (2009) Investigating the functional heterogeneity of the default mode network using coordinate-based meta-analytic modeling. J Neurosci 29:14496–14505. 10.1523/JNEUROSCI.4004-09.2009 [DOI] [PMC free article] [PubMed] [Google Scholar]
- Lawley DN, Maxwell AE (1962) Factor analysis as a statistical method. J R Stat Soc Ser Stat 12:209–229. [Google Scholar]
- Leech R, Kamourieh S, Beckmann CF, Sharp DJ (2011) Fractionating the default mode network: distinct contributions of the ventral and dorsal posterior cingulate cortex to cognitive control. J Neurosci 31:3217–3224. 10.1523/JNEUROSCI.5626-10.2011 [DOI] [PMC free article] [PubMed] [Google Scholar]
- Lenartowicz A, Kalar DJ, Congdon E, Poldrack RA (2010) Towards an ontology of cognitive control. Top Cogn Sci 2:678–692. 10.1111/j.1756-8765.2010.01100.x [DOI] [PubMed] [Google Scholar]
- Liddle PF, Kiehl KA, Smith AM (2001) Event-related fMRI study of response inhibition. Hum Brain Mapp 12:100–109. [DOI] [PMC free article] [PubMed] [Google Scholar]
- Lindquist KA, Barrett LF (2012) A functional architecture of the human brain: emerging insights from the science of emotion. Trends Cogn Sci 16:533–540. 10.1016/j.tics.2012.09.005 [DOI] [PMC free article] [PubMed] [Google Scholar]
- MacCallum RC. (2009) Factor analysis. In: The Sage handbook of quantitative methods in psychology, Ed 1, pp 759 Thousand Oaks, CA: Sage. [Google Scholar]
- Miller KL, Alfaro-Almagro F, Bangerter NK, Thomas DL, Yacoub E, Xu J, Bartsch AJ, Jbabdi S, Sotiropoulos SN, Andersson JL, Griffanti L, Douaud G, Okell TW, Weale P, Dragonu I, Garratt S, Hudson S, Collins R, Jenkinson M, Matthews PM, et al. (2016) Multimodal population brain imaging in the UK Biobank prospective epidemiological study. Nat Neurosci 19:1523–1536. 10.1038/nn.4393 [DOI] [PMC free article] [PubMed] [Google Scholar]
- Mishkin M, Ungerleider LG, Macko KA (1983) Object vision and spatial vision: two cortical pathways. Trends Neurosci 6:414–417. 10.1016/0166-2236(83)90190-X [DOI] [Google Scholar]
- Muthén LK, Muthén BO (2011) Mplus user's guide, Ed 6 https://www.statmodel.com.
- O'Connor BP. (2000) SPSS and SAS programs for determining the number of components using parallel analysis and Velicer's MAP test. Behav Res Methods Instrum Comput 32:396–402. 10.3758/BF03200807 [DOI] [PubMed] [Google Scholar]
- Poldrack RA, Yarkoni T (2016) From brain maps to cognitive ontologies: informatics and the search for mental structure. Annu Rev Psychol 67:587–612. 10.1146/annurev-psych-122414-033729 [DOI] [PMC free article] [PubMed] [Google Scholar]
- Poldrack RA, Halchenko YO, Hanson SJ (2009) Decoding the large-scale structure of brain function by classifying mental states across individuals. Psychol Sci 20:1364–1372. 10.1111/j.1467-9280.2009.02460.x [DOI] [PMC free article] [PubMed] [Google Scholar]
- Price CJ, Friston KJ (1997) Cognitive conjunction: a new approach to brain activation experiments. Neuroimage 5:261–270. 10.1006/nimg.1997.0269 [DOI] [PubMed] [Google Scholar]
- Raichle ME, MacLeod AM, Snyder AZ, Powers WJ, Gusnard DA, Shulman GL (2001) A default mode of brain function. Proc Natl Acad Sci U S A 98:676–682. 10.1073/pnas.98.2.676 [DOI] [PMC free article] [PubMed] [Google Scholar]
- Royston JP. (1983) Some techniques for assessing multivarate normality based on the Shapiro-Wilk W. J R Stat Soc Ser C Appl Stat 32:121–133. [Google Scholar]
- Salimi-Khorshidi G, Smith SM, Keltner JR, Wager TD, Nichols TE (2009) Meta-analysis of neuroimaging data: a comparison of image-based and coordinate-based pooling of studies. Neuroimage 45:810–823. 10.1016/j.neuroimage.2008.12.039 [DOI] [PubMed] [Google Scholar]
- Sestieri C, Corbetta M, Romani GL, Shulman GL (2011) Episodic memory retrieval, parietal cortex, and the Default Mode Network: functional and topographic analyses. J Neurosci 31:4407–4420. 10.1523/JNEUROSCI.3335-10.2011 [DOI] [PMC free article] [PubMed] [Google Scholar]
- Shulman GL, Pope DL, Astafiev SV, McAvoy MP, Snyder AZ, Corbetta M (2010) Right hemisphere dominance during spatial selective attention and target detection occurs outside the dorsal fronto-parietal network. J Neurosci 30:3640–3651. 10.1523/JNEUROSCI.4085-09.2010 [DOI] [PMC free article] [PubMed] [Google Scholar]
- Smith SM, Fox PT, Miller KL, Glahn DC, Fox PM, Mackay CE, Filippini N, Watkins KE, Toro R, Laird AR, Beckmann CF (2009) Correspondence of the brain's functional architecture during activation and rest. Proc Natl Acad Sci U S A 106:13040–13045. 10.1073/pnas.0905267106 [DOI] [PMC free article] [PubMed] [Google Scholar]
- Toro R, Fox PT, Paus T (2008) Functional coactivation map of the human brain. Cereb Cortex 18:2553–2559. 10.1093/cercor/bhn014 [DOI] [PMC free article] [PubMed] [Google Scholar]
- Uddin LQ, Kelly AM, Biswal BB, Castellanos FX, Milham MP (2009) Functional connectivity of default mode network components: correlation, anticorrelation, and causality. Hum Brain Mapp 30:625–637. 10.1002/hbm.20531 [DOI] [PMC free article] [PubMed] [Google Scholar]
- Uttal WR. (2003) The new phrenology: the limits of localizing cognitive processes in the brain. Cambridge, MA: Bradford. [Google Scholar]
- Wager TD, Lindquist M, Kaplan L (2007) Meta-analysis of functional neuroimaging data: current and future directions. Soc Cogn Affect Neurosci 2:150–158. 10.1093/scan/nsm015 [DOI] [PMC free article] [PubMed] [Google Scholar]
- Woolrich MW, Ripley BD, Brady M, Smith SM (2001) Temporal autocorrelation in univariate linear modeling of FMRI data. Neuroimage 14:1370–1386. 10.1006/nimg.2001.0931 [DOI] [PubMed] [Google Scholar]
- Woolrich MW, Behrens TE, Beckmann CF, Jenkinson M, Smith SM (2004) Multilevel linear modelling for FMRI group analysis using Bayesian inference. Neuroimage 21:1732–1747. 10.1016/j.neuroimage.2003.12.023 [DOI] [PubMed] [Google Scholar]
- Xia M, Wang J, He Y (2013) BrainNet viewer: a network visualization tool for human brain connectomics. PLoS One 8:e68910. 10.1371/journal.pone.0068910 [DOI] [PMC free article] [PubMed] [Google Scholar]
- Yarkoni T, Poldrack RA, Nichols TE, Van Essen DC, Wager TD (2011) Large-scale automated synthesis of human functional neuroimaging data. Nat Methods 8:665–670. 10.1038/nmeth.1635 [DOI] [PMC free article] [PubMed] [Google Scholar]
- Yeo BT, Krienen FM, Chee MW, Buckner RL (2014) Estimates of segregation and overlap of functional connectivity networks in the human cerebral cortex. Neuroimage 88:212–227. 10.1016/j.neuroimage.2013.10.046 [DOI] [PMC free article] [PubMed] [Google Scholar]
- Yeo BT, Krienen FM, Eickhoff SB, Yaakub SN, Fox PT, Buckner RL, Asplund CL, Chee MW (2015) Functional specialization and flexibility in human association cortex. Cereb Cortex 25:3654–3672. 10.1093/cercor/bhu217 [DOI] [PMC free article] [PubMed] [Google Scholar]