

Abstract
Background
Adolescents and young adults (AYA: 15-39y) with acute lymphoblastic leukemia (ALL) and acute myeloid leukemia (AML) experience inferior survival when compared to children. Impact of care at NCI-designated Comprehensive Cancer Centers (CCC; or Children's Oncology Group sites [COG]) on survival disparities remains unstudied.
Methods
Using the Los Angeles Cancer registry, we identified 1,870 ALL or AML patients between 1 and 39y at diagnosis. Cox regression analyses assessed risk of mortality; younger age+CCC/COG served as the referent group. Logistic regression was used to determine odds of care at CCC/COG, adjusting for variables above.
Results
ALL outcome: AYAs at non-CCC/COG experienced inferior survival (15-21y: HR=1.9, p=0.005; 22-29y: HR=2.6, p<0.001; 30-39y: HR=3.0, p<0.001). Outcome at CCC/COG was comparable between children and young AYAs (15-21y: HR=1.3, p=0.3; 22-29y: HR=1.2, p=0.2) but was inferior for 30-39yo (HR=3.4, p<0.001). AML outcome: AYAs at non-CCC/COG experienced inferior outcome (15-21y: HR=1.8, p=0.02; 22-39y: HR=1.4, p=0.06). Outcome at CCC/COG was comparable between children and 15-21yo (HR=1.3, p=0.4) but was inferior for 22-39yo (HR=1.7, p=0.05). Access: 15-21yo were less likely to use CCC/COG than children (p<0.001). In 22-39yo, public/uninsured (ALL: p=0.004; AML<0.001), African-American/Hispanics (ALL: p=0.03), and 30-39yo (ALL: p=0.03) were less likely to use CCC/COG.
Conclusions
Poor survival in AYAs with ALL and AML is mitigated by care at CCC/COG. Barriers to CCC/COG care include public/uninsured, and African-American/Hispanic race/ethnicity.
Impact
Care at CCC/COG explains, in part, inferior outcomes in AYAs with ALL and AML. Key sociodemographic factors serve as barriers to care at specialized centers.
Keywords: AYA, access, NCI, cancer center, outcome, leukemia
Introduction
Adolescents and young adults (AYA: 15 to 39 years) are designated a vulnerable population by the National Cancer Institute (NCI) due to the lack of improvement in survival in this group as compared to children and adults.(1, 2) Furthermore, AYAs with acute lymphoblastic leukemia (ALL) and acute myeloid leukemia (AML) have inferior survival when compared with patients diagnosed during childhood (≤14 years). While several possible causes of the inferior outcomes observed among AYAs (such as race/ethnicity, socioeconomic status [SES] and insurance) have been examined(3), site of care for their cancer could play an important role, but remains unexplored.
The US system of cancer care was deemed to be in crisis by the Institute of Medicine in 2013, with recommendations to develop a system of national quality measurement and reduce disparities in access to care for underserved populations. While measurement of quality is key to realizing these goals, the present systems lack precision and breadth in quality metrics.(4, 5) We used the NCI designation of comprehensiveness to a cancer center as a population-level surrogate that encompasses aspects of health care delivery that are currently un-measurable at the national level. The current study addresses knowledge gaps by evaluating the contribution of treatment site to outcome disparities experienced by AYAs, and also examines the barriers to accessing specialized care.
Materials and Methods
Using the Los Angeles County Cancer Surveillance Project [CSP], we assembled a population-based cohort of 1,956 patients with newly-diagnosed ALL or AML between the ages of 1 and 39 years. Diagnoses were between 1998 and 2008, ensuring near-complete follow-up for 5 or more years. CSP collects data on all new cancer diagnoses among county residents, and is a member of the California Cancer Registry and the NCI-funded Surveillance, Epidemiology and End Results (SEER) program.(6) Eligible patients were diagnosed and treated within the county. ICDO-3 histology codes were employed to identify cases (ALL: 982.0, 982.6-982.8, 983.5-983.7; AML: 980.3-980.5, 984.0-986.1, 986.6-987.4, 989.1-993.1). Only first primary malignancies were included. HTLV-related leukemias were excluded (ICDO-3 982.7). This project was approved by the State of California's Committee for the Protection of Human Subjects and the institutional review boards of City of Hope and the University of Alabama at Birmingham.
Treatment site
In order to evaluate treatment sites uniquely designated by the NCI for care of children and/or adults with cancer, we considered those which had received designation either as a Comprehensive Cancer Center (CCC) or a Children's Oncology Group (COG) site; the NCI employs rigorous criteria for both of these designations, including standards for breadth and depth in research along with performance requirements. We examined the impact of receiving care at a CCC/COG on survival outcomes, as well as predictors of care at these sites. We examined both admission-level and tumor-level registry data, systematically examining the treatment facility associated with each episode of care in the registry. For analyses, patients were assigned to the treatment facility where they received all or part of the first course of treatment. We considered patients treated at CCC/COG if: (1) at any age they were cared for at one of three CCCs in LAC (UCLA/Jonsson, USC/Norris/CHLA or City of Hope) or (2) at ≤21 years they were cared for at one of three COG sites without CCC designation (Kaiser Permanente, Harbor-UCLA, or Cedars-Sinai). All other patients were considered to have received care at one of 89 non-CCC/COG sites. [Supplementary Figure 1]
Dependent variables
Overall Survival
Both overall survival (OS) and leukemia-specific survival served as dependent variables in evaluating the impact of treatment site on outcome difference by age.
Treatment Site
Treatment site served as the dependent variable in determining predictors of care at CCC/COG.
Independent Variables
Age at Diagnosis
Both OS and age-dependent insurance access provided the rationale for creating data-driven age categories for multivariable analyses for each diagnosis. [Supplementary Table 1] First, OS was examined within both ALL and AML. [Table 1; Supplementary Table 1] Due to substantial survival differences between 1-9 and 10-14 year-olds with ALL (89.1% vs. 72.3%, p<0.0001), likely due to disease biology,(7) we excluded 1-9 year-olds and retained patients 10 and older in the regression analysis; thus 10-14 year-olds served as the referent group of “children” for ALL. In AML, given the absence of a substantial survival differences between 1-9 year-olds and 10-14 year-olds (66.2% vs. 59.1%, p=0.07), we retained patients >1 year of age at diagnosis in the regression analysis; to this end, 1-14 year-olds served as the referent group for “children”.
Table 1. Survival by Age at Diagnosis: Adolescents and Young Adults (AYAs) vs. Children.
| Primary Diagnosis | 5-year Overall Survival (OS) a | Hazard of Deathb | ||
|---|---|---|---|---|
| OSa (95% CI) | p-value | HRb (95% CI) | p-value | |
| Acute Lymphoblastic Leukemia | ||||
| 1-9 years | 89.1% (86.7-91.5%) | <0.001 | 1.0 | -- |
| 10-14 years | 72.3% (65.6-79.0%) | 2.5 (1.8-3.4) | <0.001 | |
| 15-21 years | 55.7% (47.7-63.7%) | 4.4 (3.2-6.0) | <0.001 | |
| 22-29years | 41.5% (30.7-52.3%) | 7.0 (5.0-9.9) | <0.001 | |
| 30-39years | 35.4% (25.8-45.0%) | 8.6 (6.3-11.7) | <0.001 | |
| Acute Myeloid Leukemia | ||||
| 1-14years | 62.8% (54.1-71.5%) | 0.03 | 1.0 | -- |
| 15-21years | 48.9% (37.9-59.9%) | 1.6 (1.1-2.5) | 0.02 | |
| 22-39years | 48.9% (42.5-55.3%) | 1.5 (1.1-2.1) | 0.02 | |
OS (overall survival): Kaplan-Meier survival analysis; CI (confidence interval)
HR (hazard ratio): Univariable Cox regression
In addition, there was a difference in access to public insurance in the state of California for patients ≤21 years old and those >21 years old during the study period. Similarly, access to a pediatric service differs more substantially after the age of 21 years. Thus we considered one break point to be 21 years (15-21 years vs. 22-39 years), but next considered survival in AYA subgroups. In ALL, due to survival differences between 22-29 year-olds (41.5%) and 30-39 year-olds (35.4%; p<0.0001), we split older AYAs into one group encompassing 22-29 year-olds and another with 30-39-year-olds. In AML, with no substantial survival differences between 22-29 year-olds (51.1%) and 30-39 year-olds (47.5%; p=0.07), “older AYAs” were grouped together as 22-39 year-olds. For the purposes of evaluating access (odds of receiving care at CCC/COG), the groups were considered more homogeneously due to equal insurance access in California for patients ≤21 years and comparable access at >21 years; thus 1-21 year-old patients were considered together while patients 22-39 years old were considered separately.
Race/Ethnicity
The CSP variables for race and ethnicity are abstracted from medical records according to cancer registry protocol(8). We evaluated race/ethnicity using the categories: Non-Hispanic white (NHW), Hispanic, African-American, and Asian/Pacific-Islander (API). Due to small numbers, Alaskan Native/Other patients and those with unknown/missing ethnicity were excluded (n=23; 0.5%).
Payor
Insurance was collapsed into three categories (public, private, none) and those with unknown/missing payor were excluded (n=179; 4%) using the following criteria: (1) Private insurance: HMO, PPO, managed care, fee-for-service (FFS) and insurance NOS; (2) Public insurance: Medicaid, Medicaid managed care, County-funded NOS, Medicare/Medicaid NOS, Medicare with supplement, Medicare with Medicaid eligibility, TriCare, Military, Veterans Affairs, and Indian Health Service; (3) Uninsured: self-pay or no insurance.
SES
CSP's variable for SES employs 2000 census block data (education and median household income). Quintiles were collapsed into three categories; the lowest and highest neighborhood quintiles remained in the low- and high-SES groups, respectively. The second, third and fourth quintiles were collapsed into a mid-SES group. We excluded patients if SES was missing/unknown (n=21; 0.5%). All analyses were repeated with inclusion of patients missing sociodemographic data with identical results (data not shown).
Distance
CSP provided residential addresses at diagnosis. We geocoded hospital addresses and measured straight line distance between patient residence and the nearest CCC/COG using Geographic Information Systems ([GIS]; ArcMap 10.2, esri, Redlands, CA). We chose this approach, since Euclidean distance is correlated with drive time.(9)
Statistical Analysis
Impact of treatment site on difference in overall survival by age at diagnosis
Employing an evaluable cohort of 1,870 patients, overall survival was calculated using Kaplan-Meier survival analysis, (log-rank tests detected differences between groups). The assumption of proportionality was verified through visualization of the Kaplan–Meier curves and inclusion of time-dependent variables; no violation was observed. Cox regression analysis provided hazard ratios (HR) of death associated with 95% confidence intervals (CI); univariable and multivariable results are presented. Cox regression analyses modelled overall survival and proportional sub-distribution hazards model examined death from primary disease (considering death from other causes as a competing risk). Unless otherwise specified, multivariable models were adjusted for treatment site, age at diagnosis, gender, race/ethnicity, SES, and payor; covariate results are presented in Supplementary Table 2. Interaction between treatment site and age (p≤0.05) led us to create a composite variable, with patients diagnosed at a younger age and treated at CCC/COG serving as a referent group.
Predictors of care at CCC/COG sites
Logistic regression techniques were used to identify predictors of receiving care at a CCC/COG; the magnitudes of association are presented as odds ratios (OR) with 95% CI. In California, insurance-based access to healthcare is available to all patients 21 years and younger, with federally-mandated Title V coverage for children with special health care needs terminating at 21 years. Further, patients diagnosed at age 21 or younger are often treated by the pediatric team. Due to these reasons, analyses examining predictors of care at CCC/COG were stratified by age group (1-21 and 22-39 years).
All findings were comparable when adjusted for year of diagnosis (data not shown). Two-sided tests with p<0.05 were considered statistically significant. SAS 9.3 (SAS Institute, Cary, NC) was used for all analyses.
Results
Clinical and sociodemographic characteristics of the cohort are summarized in Table 2, and Supplementary Figure 2. The majority of patients (71%) with ALL were children (1-14 years) while the majority with AML (56%) were older AYAs (22-39 years). A smaller proportion of AYAs (21%) were treated at CCC/COG sites as compared to children (80%, p<0.0001). Similarly, a smaller proportion of AYAs were publicly insured (35%) as compared with to children (65%, p<0.0001). Across diagnoses and payors, a higher proportion of children were treated at CCC/COG as compared to AYAs. [Figure 1] There was a trend towards a higher representation of AYAs vs. children in the lowest SES group (62.5% vs. 37.5%; p=0.09). Differences in racial/ethnic representation were not statistically significant (children: NHW 21.1%, Hispanic 67.5%, African-American 3.7%, API 7.7%; AYAs: NHW 20.5%, Hispanic 65.3%, African-American 5.5%, API 8.7%; p=0.2).
Table 2. Patient Characteristics Overall and by Treatment Site.
| Acute Lymphoblastic Leukemia | ||||
|---|---|---|---|---|
| Total (n=1,380) | CCC/COG* (n=809) | Non-CCC (n=571) | p-value | |
| Age | ||||
| 1-14y | 978 (70.9%) | 687 (84.9%) | 291 (51.0%) | <0.001 |
| 15-21y | 190 (13.8%) | 96 (11.9%) | 94 (16.5%) | |
| 22-39y | 212 (15.4%) | 26 (3.2%) | 186 (32.6%) | |
| Gender | ||||
| Female | 573 (41.5%) | 335 (41.4%) | 238 (41.7%) | 0.9 |
| Male | 807 (58.5%) | 474 (58.6%) | 333 (58.3%) | |
| Race/Ethnicity | ||||
| NHW | 275 (19.9%) | 182 (22.5%) | 93 (16.3%) | 0.02 |
| African-American | 49 (3.6%) | 26 (3.2%) | 23 (4.0%) | |
| Hispanic | 962 (69.7%) | 541 (66.9%) | 421 (73.7%) | |
| Asian-Pacific Islander | 94 (6.8%) | 60 (7.4%) | 34 (6.0%) | |
| Insurance | ||||
| Private | 712 (51.6%) | 423 (52.3%) | 289 (50.6%) | 0.2 |
| Public | 605 (43.8%) | 356 (58.8%) | 249 (43.6%) | |
| Uninsured | 63 (4.6%) | 30 (3.7%) | 33 (5.8%) | |
| SES | ||||
| High | 170 (12.3%) | 105 (13.0%) | 65 (11.4%) | 0.6 |
| Middle | 758 (54.9%) | 444 (54.9%) | 314 (55.0%) | |
| Low | 452 (32.8%) | 260 (32.1%) | 192 (33.6%) | |
| Distance to Nearest CCC/COG (miles) | ||||
| Median (IQR*) | 7.0 (6.0) | 6.8 (6.4) | 7.3 (5.1) | 0.5 |
| Mean (SD*) | 8.5 (6.7) | 8.7 (7.5) | 8.3 (5.2) | |
| Acute Myeloid Leukemia (n=490) | ||||
| Total (n=1,380) | CCC/COG* (n=177) | Non-CCC (n=313) | p-value | |
| Age | ||||
| 1-14y | 131 (26.7%) | 97 (54.8%) | 34 (10.9%) | <0.001 |
| 15-21y | 85 (17.4%) | 36 (20.3%) | 49 (15.7%) | |
| 22-39y | 274 (55.9%) | 44 (24.9%) | 230 (73.5%) | |
| Gender | ||||
| Female | 228 (46.5%) | 80 (45.2%) | 148 (47.2%) | 0.7 |
| Male | 262 (53.5%) | 97 (54.8%) | 165 (52.7%) | |
| Race/Ethnicity | ||||
| NHW | 115 (23.5%) | 40 (22.6%) | 75 (24.0%) | 0.98 |
| African-American | 34 (6.9%) | 13 (7.3%) | 21 (6.7%) | |
| Hispanic | 284 (58.0%) | 103 (58.2%) | 181 (57.8%) | |
| Asian-Pacific Islander | 57 (11.6%) | 21 (11.9%) | 36 (11.5%) | |
| Insurance | ||||
| Private | 267 (54.5%) | 100 (56.5%) | 167 (53.4%) | 0.09 |
| Public | 180 (36.7%) | 68 (38.4%) | 112 (35.8%) | |
| Uninsured | 43 (8.8%) | 9 (5.1%) | 34 (10.9%) | |
| SES | ||||
| High | 54 (11.0%) | 22 (12.4%) | 32 (10.2%) | 0.7 |
| Middle | 298 (60.8%) | 107 (60.5%) | 191 (61.0%) | |
| Low | 138 (29.2%) | 48 (27.1%) | 90 (28.8%) | |
| Distance to Nearest CCC/COG (miles) | ||||
| Median (IQR*) | 7.9 (7.3) | 7.5 (7.2) | 8.0 (7.2) | 0.8 |
| Mean (SD*) | 10.0 (7.8) | 9.7 (8.2) | 10.2 (7.6) | |
CCC/COG: NCI-Designated Comprehensive Cancer Center or Children's Oncology Group site; IQR: Interquartile range; SD: standard deviation
Figure 1. Proportion of Children, Adolescents and Young Adults with Hematologic Malignancies Treated at CCCs or COG Sites.
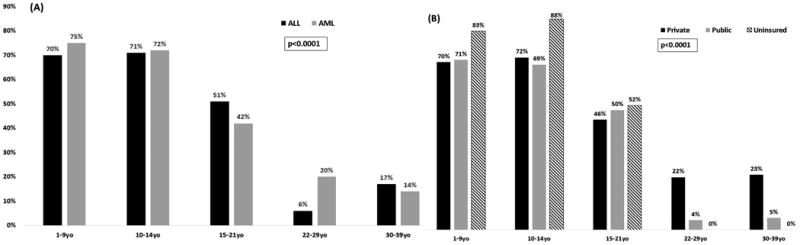
Proportions are presented by (A) Age and Diagnosis and by (B) Age and Payor.
Acute Lymphoblastic Leukemia
Survival
Overall, 5-year survival rates were highest among the 10-14 year-olds and declined with age (10-14 years: 72.3%; 15-21 years: 55.7%; 22-29 years: 41.5%; 30-39 years: 35.4%; p<0.001). [Table 1] AYAs treated at non-CCC/COG facilities had poorer 5-year survival (40.6%) as compared to those treated at CCC/COG facilities (59.8%, p=0.004). [Figure 2, Supplementary Table 3] In multivariable modelling, a composite variable representing age and treatment site (referent group: 10-14 year-olds treated at CCC/COG) revealed that both 15-21 year-olds (HR=1.9, 95% CI, 1.2-2.8, p=0.005) and 22-29 year-olds (HR=2.6, 95% CI, 1.8-3.9, p<0.001) not treated at CCC/COG had an increased hazard of death, while CCC/COG patients did not (15-21 year-olds: HR=1.3, 95%CI, 0.8-2.1, p=0.3; 22-29 year-olds: HR=1.2, 95%CI, 0.2-5.0, p=0.8). These findings were comparable in terms of leukemia-specific mortality in which patients not treated at CCC/COG had an increased hazard of death (15-21 year-olds: HR=1.7, 95%CI, 1.1-2.7, p=0.02; 22-29 year-olds: HR=2.1, 95%CI, 1.4-3.1, p<0.001) while CCC/COG patients did not (15-21 year-olds: HR=1.2, 95%CI, 0.7-1.9, p=0.5; 22-29 year-olds: HR=1.1, 95%CI, 0.3-4.6, p=0.9). The hazard of death among AYAs ≥30 years was increased, regardless of treatment site both overall (CCC/COG: HR=3.4, 95%CI, 1.8-6.4, p<0.001; Non-CCC/COG: HR=3.0, 95%CI, 2.1-4.5, p<0.001) and in terms of leukemia-specific mortality (CCC/COG: HR=2.1, 95%CI, 1.4-3.1, p<0.001; Non-CCC/COG: HR=2.6, 95%CI, 0.3-4.6, p<0.001). [Table 3]
Figure 2. Overall Survival (OS) by Treatment Site Adolescents and Young Adults (AYAs) with Acute Lymphoblastic Leukemia (ALL) and Acute Myeloid Leukemia (AML).
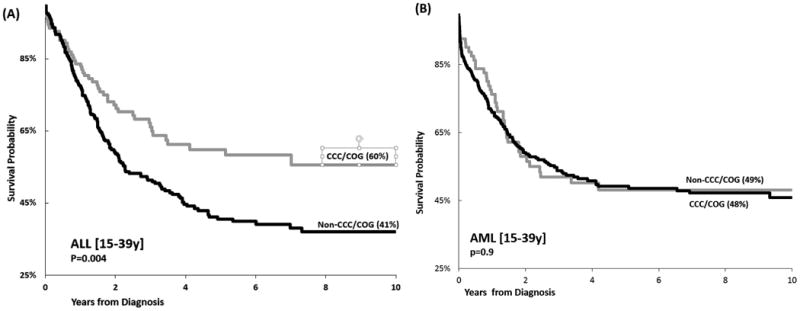
Overall survival is presented by by treatment site. (A) OS in AYAs with ALL by treatment site [NCI-designated Comprehensive Cancer Center/ Children's Oncology Group Site (CCC/COG) vs. other]; (B) OS in AYAs with AML by treatment site [CCC/COG vs. other].
Table 3. Impact of Age and Treatment Site on Overall Survival.
| Primary Diagnosis | Agec | Treatment Sited | Hazard of Deatha | |||
|---|---|---|---|---|---|---|
| Overall Survivalb | Leukemia-Specific Survivalc | |||||
| HR (95% CI) | p-value | HR (95% CI) | p-value | |||
| Acute Lymphoblastic Leukemia | ||||||
| 10-14years | CCC/COG | 1.0 | -- | 1.0 | -- | |
| Non-CCC/COG | 0.6 (0.3-1.2) | 0.1 | 0.6 (0.3-1.1) | 0.1 | ||
| 15-21years | CCC/COG | 1.3 (0.8-2.1) | 0.3 | 1.2 (0.7-1.9) | 0.5 | |
| Non-CCC/COG | 1.9 (1.2-2.8) | 0.005 | 1.7 (1.1-2.7) | 0.02 | ||
| 22-29years | CCC/COG | 1.2 (0.2-5.0) | 0.8 | 1.1 (0.3-4.6) | 0.9 | |
| Non-CCC/COG | 2.6 (1.8-3.9) | <0.001 | 2.1 (1.4-3.1) | <0.001 | ||
| 30-39years | CCC/COG | 3.4 (1.8-6.4) | <0.001 | 2.6 (1.2-5.4) | 0.01 | |
| Non-CCC/COG | 3.0 (2.1-4.5) | <0.001 | 2.2 (1.5-3.4) | <0.001 | ||
| Acute Myeloid Leukemia | ||||||
| 1-14years | CCC/COG | 1.0 | -- | 1.0 | -- | |
| Non-CCC/COG | 0.8 (0.4-1.6) | 0.5 | 0.9 (0.5-1.9) | 0.9 | ||
| 15-21years | CCC/COG | 1.3 (0.7-2.3) | 0.4 | 1.4 (0.8-2.7) | 0.3 | |
| Non-CCC/COG | 1.8 (1.1-3.0) | 0.02 | 1.9 (1.1-3.4) | 0.03 | ||
| 22-39years | CCC/COG | 1.7 (1.0-2.9) | 0.05 | 1.6 (0.9-2.8) | 0.1 | |
| Non-CCC/COG | 1.4 (1.0-2.1) | 0.06 | 1.5 (0.99-2.3) | 0.06 | ||
Bolded values represent statistically significant findings, p<0.05
Cox regression multivariable analysis adjusted for race/ethnicity, socioeconomic status, payor. (HR: hazard ratio; CI: confidence interval)
Cox regression multivariable analysis, death by other causes considered as competing risk, adjusted for race/ethnicity, socioeconomic status, payor. (HR: hazard ratio; CI: confidence interval)
Derived variable in model combined age group and treatment site (CCC/COG: NCI-Designated Comprehensive Cancer Center or Children's Oncology Group site).
Treatment Site
A higher proportion of children were treated at CCC/COG (10-14y: 70.6%) as compared to 15-21 (50.5%) or 22-39 year-olds (12.3%, p<0.001). [Figure 1] Among 10-21 year-olds, older age was associated with a lower odds of CCC/COG treatment (15-21 vs. 10-14 years: OR=0.4, 95%CI, 0.3-0.7, p<0.001) while sociodemographic factors were not associated with treatment site [Race/ethnicity (African-American/Hispanic: OR=0.5, 95%CI, 0.3-1.0, p=0.06; API: OR=0.8, 95%CI, 0.3-2.2, p=0.6); SES (mid: OR=1.1, 95%CI, 0.5-2.4, p=0.9; low: OR=1.3, 95%CI, 0.5-3.4, p=0.6); payor (public/none: OR=1.0 (95%CI, 0.6-1.6, p=1.0); distance (>10 miles: OR=1.2, 95%CI 0.7-2.1, p=0.4)]. In patients ≥22 years, both race/ethnicity (African-American/Hispanic vs. non-Hispanic whites [referent group]: OR=0.3, 95%CI, 0.1-0.9, p=0.03) and insurance (public/uninsured vs. private [referent group]: OR=0.1, 95%CI, 0.03-0.5, p=0.004) predicted a lower odds of CCC/COG treatment while distance did not (>10 miles: OR=1.2, 95%CI, 0.7-2.1, p=0.4). In addition, 30-39 year-olds were more likely to receive care at CCC/COG when compared with 22-29 year-olds (OR=3.1, 95%CI, 1.1-8.4, p=0.03). [Table 4] These age-related findings were comparable when stratified by SES and payor (data not shown), and age remained an independent predictor despite adjustment for these variables.
Table 4. Likelihood of Receiving Care at CCC/COG vs. Non-CCC/COG Facilitya,b.
| ≤ 21 year-oldsd | 22-39 year-olds | ||||
|---|---|---|---|---|---|
| ORc (95% CI) | p-value | OR (95% CI) | p-value | ||
| Acute Lymphoblastic Leukemia | |||||
| Age Group | |||||
| 10-14 yearsd | 1.0 | - | 22-29y | 1.0 | - |
| 15-21 years | 0.4 (0.3-0.7) | <0.001 | 30-39y | 3.1 (1.1-8.7) | 0.03 |
| Race/Ethnicity | |||||
| Non-Hispanic White | 1.0 | - | 1.0 | - | |
| African-American/Hispanic | 0.5 (0.3-1.0) | 0.06 | 0.3 (0.1-0.9) | 0.03 | |
| Asian-Pacific Islander | 0.8 (0.3-2.2) | 0.6 | 0.6 (0.1-4.0) | 0.6 | |
| Socioeconomic Status (SES) | |||||
| High | 1.0 | - | 1.0 | - | |
| Middle | 1.1 (0.5-2.4) | 0.9 | 1.5 (0.4-5.2) | 0.6 | |
| Low | 1.3 (0.5-3.4) | 0.6 | 0.7 (0.1-4.4) | 0.7 | |
| Insurance | |||||
| Private | 1.0 | - | 1.0 | - | |
| Public/None | 1.0 (0.6-1.6) | 1.0 | 0.1 (0.03-0.5) | 0.004 | |
| Distance from nearest age-appropriate CCC/COG site | |||||
| ≤10 miles | 1.0 | - | 1.0 | - | |
| >10 miles | 1.2 (0.7-2.1) | 0.4 | 0.7 (0.3-1.8) | 0.4 | |
| Acute Myeloid Leukemia | |||||
| Age Group | |||||
| 1-14 years | 1.0 | - | 22-29y | 1.0 | - |
| 15-21 years | 0.3 (0.1-0.5) | <0.001 | 30-39y | 0.6 (0.3-1.2) | 0.1 |
| Race/Ethnicity | |||||
| Non-Hispanic White | 1.0 | - | 1.0 | - | |
| African-American/Hispanic | 1.2 (0.5-2.8) | 0.8 | 0.6 (0.3-1.4) | 0.3 | |
| Asian-Pacific Islander | 1.7 (0.4-6.7) | 0.5 | 1.2 (0.5-3.0) | 0.8 | |
| Socioeconomic Status (SES) | |||||
| High | 1.0 | - | 1.0 | - | |
| Middle | 0.6 (0.2-1.9) | 0.4 | 0.9 (0.4-2.5) | 0.9 | |
| Low | 0.6 (0.2-2.3) | 0.5 | 0.6 (0.2-2.3) | 0.4 | |
| Insurance | |||||
| Private | 1.0 | - | 1.0 | - | |
| Public/None | 1.4 (0.8-2.6) | 0.3 | 0.3 (0.1-0.8) | 0.02 | |
| Distance from nearest age-appropriate CCC/COG site | |||||
| ≤10 miles | 1.0 | - | 1.0 | - | |
| >10 miles | 0.8 (0.4-1.6) | 0.5 | 1.2 (0.6-2.4) | 0.7 | |
Logistic Regression, adjusted for all variables including gender (CCC/COG: NCI-Designated Comprehensive Cancer Center or Children's Oncology Group site)
Bolded values: statistically significant, p<0.05
Odds Ratios (OR) with 95% Confidence Intervals (CI)
Includes 10-14 year-olds with ALL and 1-14 year-olds with AML
Acute Myeloid Leukemia
Survival
Overall survival was superior in children and declined with age (1-14y: 62.8%; 15-21y: 48.9%; 22-39y: 48.9%; p=0.03). [Table 1] AYAs had comparable outcome at CCC/COG and non-CCC/COG in univariable analysis (48.1% vs. 49.1%, p=0.9). [Figure 2, Supplementary Table 3] However, in multivariable regression including a composite age/treatment site variable (reference group: 1-14 year-olds at CCC/COG), 15-21 year-olds not treated at CCC/COG saw an increased hazard of death (HR=1.7, 95%CI, 1.1-3.0, p=0.02) while CCC/COG patients did not (HR=1.3, 95% CI, 0.7-2.3, p=0.4). Findings regarding leukemia-specific mortality were comparable, as patients not treated at CCC/COG had an increased hazard of death (HR=1.9, 95%CI, 1.1-3.4, p=0.02) while CCC/COG patients did not (HR=1.4, 95%CI, 0.8-2.7, p=0.3). All 22-39 year-olds, irrespective of site of care, had an increased hazard of death overall as compared to children (CCC/COG: HR=3.4, 95%CI, 1.8-6.4, p<0.001; Non-CCC/COG: HR=3.0, 95%CI, 2.1-4.5, p<0.001). Findings were comparable regarding leukemia-specific mortality (CCC/COG: HR=1.5, 95%CI, 0.99-2.3, p=0.06; Non-CCC/COG: HR=1.6, 95%CI, 0.9-2.8, p=0.1). [Table 3]
Treatment Site
A higher proportion of children with AML were treated at CCC/COG sites (1-9y: 75.3%; 10-14y: 72.2%) as compared to 15-21 year-olds (42.4%) or 22-39 year-olds (16.1%, p<0.0001). In older AYAs, a higher proportion of privately insured (22-29y: 22%; 30-39y: 23%) as compared to publicly insured (22-29y: 4%, 30-39y, 5%, p<0.0001) patients were treated at CCC/COG sites. [Figure 1] In a multivariable model restricted to patients ≤21 years, older age (15-21 years) alone was associated with a lower odds of treatment at a CCC/COG (OR=0.3, 95%CI, 0.1-0.5, p<0.001) while sociodemographic factors were not associated with treatment site. This included race/ethnicity (African-American/Hispanic: OR=1.1, 95% CI, 0.5-2.6, p=0.8; API: OR=1.7, 95% CI, 0.4-6.6, p=0.5), SES (mid: OR=0.6, 95% CI, 0.2-1.8, p=0.4; low: OR=0.6, 95% CI, 0.2-2.2, p=0.4), payor (public/none: OR=1.7 (95% CI, 0.9-3.2, p=0.1), and distance (>10 miles: OR=0.8, 95%CI 0.4-1.6, p=0.6). In 22-39 year-olds, payor predicted lower odds of treatment at a CCC/COG (public/uninsured: OR=0.1, 95%CI, 0.03-0.5, p=0.004). [Table 4]
Discussion
These population-level findings reveal that AYAs diagnosed with ALL at <30 years or with AML at <22 years have poor outcomes when not treated at CCC/COG sites when compared with CCC/COG sites, and treatment at CCC/COG sites can mitigate the outcome difference between AYAs and children in these patients. We identify age, lack of private insurance, and non-white race/ethnicity as potential barriers to receiving treatment at a CCC/COG in ALL and AML, while living further from the nearest CCC/COG did not serve as a potential barrier.
In the setting of AYA disparities and the IOM call to action,(5, 10) both the potential effect of quality of care on survival and barriers to access to quality care, deserve examination. System-level effects on outcomes in cancer have been evaluated in terms of payor, surgical volume, safety net status, technology, and academic status and size (bed number); the influence of decision-making and care delivery has been examined with respect to guideline adherence, clinical trial enrollment and cooperative group affiliation.(2, 11-13) However, previous studies explored these factors in older patients, or in patients with specific non-hematologic malignancies and/or in specific surgical settings.(14) Facility factors have been explored in common adult-onset malignancies.(12, 15, 16) Many aspects of health care delivery remain unmeasured, with neither AYAs nor patients with hematologic malignancies examined in detail. Relevant unmeasured items include supportive care, multidisciplinary decision-making and therapy delivery mechanisms, all components of the NCI comprehensiveness designation;(17) the absence of a granular, validated measure delving into cancer care delivery(10) necessitates evaluation of surrogate measures such as care at an NCI designated comprehensive cancer center or a COG member site.
Multiple domains potentially contribute to the AYA Gap: host and cancer biology; therapeutic exposures; health behaviors; and health care delivery (sociocultural factors, access, clinical trial enrollment and unmeasurable aspects of treatment site [supportive care, therapy decisions]). We find that care at CCC/COG sites mitigates poor survival in 15-21 and 22-29 year-olds when compared with 10-14 year old children in ALL, with no apparent impact in 30-39 year-olds. Similarly in AML, care at CCC/COG sites mitigates poor survival in 15-21 year-olds while in 22-39 year-olds there is no apparent impact on survival. In older patients (30-39 year-olds with ALL, 22-39 year-olds with AML), other aspects of disease or care are likely too dominant to be overcome by treatment site alone. These findings are comparable across both overall and leukemia-specific survival.
In ALL, groundbreaking genome-wide work in the last decade has revealed unique AYA susceptibility profiles,(18) as well as the predominance of the novel Philadelphia-like phenotype, which likely requires an additional component to therapy.(19) Comparable AML studies have been less conclusive, however age-based biologic differences exist(20) and hypotheses regarding novel risk stratification are being tested.(1) ALL and AML have traditionally been treated with different approaches dependent upon the service/clinic to which the AYA presents (adult vs. pediatric).(21, 22) While the field now recognizes that multi-agent, pediatric-inspired chemotherapy regimens have superior outcome to other regimens in AYA patients with ALL,(21, 23-25) these regimens have not been uniformly adopted, and their adoption could possibly differ by site of treatment. Guidelines for treatment of AYA patients with ALL were instituted in 2012 by the National Comprehensive Cancer Network; ALL is the only diagnosis to have distinct AYA therapeutic recommendations which have included treatment either with pediatric-inspired multi-agent chemotherapy or enrollment on clinical trial.(26, 27) During the time period covered by our study (1998-2008) there is evidence for support for these ALL regimens in younger AYAs and minimally in older AYAs, with the approach still evolving both within and outside of NCICCCs.(28) Previous studies indicate that the key difference in the AML therapeutic approach is dose intensity which is higher in pediatric protocols. In these AML trials, patients on pediatric protocols had superior outcome to those on adult protocols, however interpretation of the specific predictors of outcome is challenging as age played a significant role in the outcome.(22) On pediatric AML protocols, AYAs saw higher risk of treatment-related mortality.(29) Our study finds that treatment at CCC/COG facilities mitigates the difference in outcome between younger AYAs and children. We speculate that aspects of the NCI designation of comprehensiveness or designation as a COG member site, which impact outcome in AYAs likely include: supportive care, multidisciplinary care coordination, therapy choice and delivery.
Understanding access to specialized care becomes crucial with the demonstrated impact of CCC/COG care on AYA outcomes. Adolescents (15-21 year-olds) with ALL and AML were less likely to receive treatment at CCC/COG when compared with those <15 years of age, despite adjustment for sociodemographic factors. In fact, sociodemographic factors did not impact access to care at CCC/COG facilities in this age group. However, among 22-39 year-old leukemia patients, lacking private insurance was associated with lower odds of utilizing CCC/COG; this is consistent with Californians “aging out” of federally mandated coverage at 21 years of age.
Distance did not impact CCC/COG utilization in ALL nor AML. Distance has been associated with care at CCC/COG sites in older AYAs in Los Angeles County with central nervous system tumors(30) and adult-onset tumors,(31) thus these findings in ALL and AML could reflect a lower level of comfort among non-CCC/COG facilities to treat acute leukemia, including a need for higher intensity supportive care; these aspects were examined employing NCI designation as a surrogate. It is conceivable that distance is less of a factor in this study due examination of a single county, which would limit the generalizability of these findings across the U.S.; however Los Angeles County spans 4,751 square miles and was home to 9.8 million people in 2008. The strong presence of health maintenance organizations in California could possibly confound a distance effect, as distance may behave differently in an alternate health care landscape. Nevertheless, potential limitations to the generalizability of these findings are minimized by the size and population of the county, which alone would rank as the eighth most populous state with robust multi-racial, multi-ethnic representation.
Payor predicts CCC/COG utilization for older AYA patients with ALL and AML, while SES does not; race/ethnicity remains an independent predictor of treatment site in older AYAs with ALL. This pattern is consistent with the notion that payor serves as a significant driver of the location of care after adjusting for race/ethnicity and neighborhood-level SES. An association between payor contracts and referral patterns is implicated by the different behavior amongst age groups of publicly insured patients; while publicly insured older AYAs are less likely to be treated at CCC/COG sites, there is a trend towards younger publicly insured AML patients being more likely to receive such care. This conflicting pattern between patients ≤21years and those >21 years is in line with the concept that the patients <21 years may be receiving pediatric services at the specialized site; this also echoes studies(32) which have reported that pediatric centers accept 15-21 year-olds regardless of insurance status.
In addition, race/ethnicity and age emerge as independent predictors of treatment site among older AYAs with ALL, with patients from African-American and Hispanic backgrounds and 22-29 year-olds less likely to receive treatment at CCC/COG than their Non-Hispanic White and 30-39 year-old counterparts. AYAs are a unique population, and may be at one of many different phases of young adulthood, whether at school or work full- or part-time, with a living situation that ranges from living alone or with friends to living with spouses, partners or parents; these aspects likely impact the source of insurance for an AYA as well (employer-based, parent-based, public, none). Each of these findings warrants investigation to understand these barriers at a granular level.
Registries provide unique population-level data, but with inherent limitations; these include a lack of detailed clinical, health behavior and care delivery data including adherence to prescribed therapy. For example, these data lack white blood cell count at diagnosis, chromosome copy number or cytogenetic details, thus limiting our inclusion of these in analyses. The neighborhood-level sociodemographic factors (income and education) used to create the SES variable may vary from individual-level measurements; additionally, race/ethnicity is abstracted from the medical record and may differ from the gold standard of self-report. Nevertheless, these variables serve as the best available measures in population-level analyses which are able to uncover novel findings outside of the idealistic clinical trial setting. Decisions regarding physician assignment (pediatric or adult service) by age at diagnosis vary by treatment facility, and the registry does not document which specialty/service treated a patient at any particular site, nor the therapy given. We have previously published our observations for other cancer diagnoses, and found that health coverage predicts treatment site.(30) Thus in the current study, we have grouped patients with comparable access to public coverage; 15-21 year-olds at a site designated as COG for pediatrics (but not as CCC), were assigned to COG. Repeating analyses without inclusion of the 3 COG sites that were not affiliated with an NCI-designated CCC yielded comparable findings. [Supplementary Table 4] Our a priori assignment conservatively assigns 15-21 year-olds to pediatric services. Any misclassification bias would mute our results rather than changing their direction or enhancing them; in fact, our treatment site effect would be more pronounced if we considered this age cutoff to be younger.
These population-level findings indicate that poor survival among the younger AYA with ALL (<30 years) and AML (<22 years) as compared to children can be mitigated by treatment at CCC/COG facilities. We present a novel, systems-level approach to a pervasive challenge. This study highlights the need for ongoing investigations into health care delivery in cancer, specifically in AYAs and patients facing barriers to access (lacking private insurance; underrepresented minorities). No individual element of healthcare delivery is mutually exclusive, and generalizing outcomes from one component overlooks the quintessential integrative model(33) in which each element contributes to the overall end point of high quality care. Our recognition of barriers to care at specialized centers highlights a gap in provision of high quality cancer care in vulnerable populations. It becomes imperative to respond to IOM recommendations to both develop quality measurement and simultaneously improve access, as it is crucial that attention to these items moves beyond typical adult-onset cancers and older populations and includes AYAs who remain stranded between the pediatric and adult healthcare systems.
Supplementary Material
Acknowledgments
Financial Support: This work was supported by the National Institutes of Health (K12CA001727) and the St. Baldrick's Scholar Career Development Award (J.A. Wolfson). Research reported in this publication also included work performed in the Survey Research Core supported by the National Cancer Institute of the National Institutes of Health under award number P30CA33572 (C.L. Sun). The content is solely the responsibility of the authors and does not necessarily represent the official views of the National Institutes of Health.
Footnotes
Financial Disclosure Statement: The authors have no financial relationships relevant to this article
Conflict of Interest Statement: The authors have no conflicts of interest relevant to this article
Presented in abstract form at the annual meeting of the American Society of Hematology, San Francisco, CA, December 2014
References
- 1.Place AE, Frederick NN, Sallan SE. Therapeutic approaches to haematological malignancies in adolescents and young adults. British Journal of Haematology. 2014;164(1):3–14. doi: 10.1111/bjh.12556. [DOI] [PubMed] [Google Scholar]
- 2.Bleyer WA. Cancer in older adolescents and young adults: Epidemiology, diagnosis, treatment, survival, and importance of clinical trials. Medical and Pediatric Oncology. 2002;38(1):1–10. doi: 10.1002/mpo.1257. [DOI] [PubMed] [Google Scholar]
- 3.Wolfson JA. Piecing together the puzzle of disparities in adolescents and young adults. Cancer. 2015;121(8):1168–71. doi: 10.1002/cncr.29193. [DOI] [PMC free article] [PubMed] [Google Scholar]
- 4.Spinks TE, Ganz PA, Sledge GW, Levit L, Hayman JA, Eberlein TJ, et al. Delivering high-quality cancer care: The critical role of quality measurement. Healthcare. 2014;2(1):53–62. doi: 10.1016/j.hjdsi.2013.11.003. [DOI] [PMC free article] [PubMed] [Google Scholar]
- 5.Laura L, Erin B, Sharyl N, Patricia AG, editors. Delivering High-Quality Cancer Care: Charting a New Course for a System in Crisis. The National Academies Press; 2013. [PubMed] [Google Scholar]
- 6.USC KSoMo. CSPedia - Los Angeles Cancer Surveillance Program: User's Guide to Data Elements 2007 [updated. 2010 Available from: http://cspedia.usc.edu/whnjs.htm.
- 7.Hunger SP, Mullighan CG. Acute Lymphoblastic Leukemia in Children. N Engl J Med. 2015;373(16):1541–52. doi: 10.1056/NEJMra1400972. [DOI] [PubMed] [Google Scholar]
- 8.USC. CSPedia (Los Angeles Cancer Surveillance Program: User's Guide to Data Elements) - Patient/Demographics: Introduction. 2006 [Google Scholar]
- 9.Bliss RL, Katz JN, Wright EA, Losina E. Estimating proximity to care: are straight line and zipcode centroid distances acceptable proxy measures? Med Care. 2012;50(1):99–106. doi: 10.1097/MLR.0b013e31822944d1. [DOI] [PMC free article] [PubMed] [Google Scholar]
- 10.Hewitt M, Simone JV, editors. Ensuring Quality Cancer Care. The National Academies Press; 1999. [PubMed] [Google Scholar]
- 11.Finlayson EV, Goodney PP, Birkmeyer JD. Hospital volume and operative mortality in cancer surgery: a national study. Archives of surgery (Chicago, Ill : 1960) 2003;138(7):721–5. doi: 10.1001/archsurg.138.7.721. discussion 6. [DOI] [PubMed] [Google Scholar]
- 12.Rhoads KF, Ngo JV, Ma Y, Huang L, Welton ML, Dudley RA. Do hospitals that serve a high percentage of Medicaid patients perform well on evidence-based guidelines for colon cancer care? J Health Care Poor Underserved. 2013;24(3):1180–93. doi: 10.1353/hpu.2013.0122. [DOI] [PubMed] [Google Scholar]
- 13.Visser BC, Ma Y, Zak Y, Poultsides GA, Norton JA, Rhoads KF. Failure to comply with NCCN guidelines for the management of pancreatic cancer compromises outcomes. HPB : the official journal of the International Hepato Pancreato Biliary Association. 2012;14(8):539–47. doi: 10.1111/j.1477-2574.2012.00496.x. [DOI] [PMC free article] [PubMed] [Google Scholar]
- 14.Morris AM, Rhoads KF, Stain SC, Birkmeyer JD. Understanding racial disparities in cancer treatment and outcomes. J Am Coll Surg. 2010;211(1):105–13. doi: 10.1016/j.jamcollsurg.2010.02.051. [DOI] [PubMed] [Google Scholar]
- 15.Breslin TM, Morris AM, Gu N, Wong SL, Finlayson EV, Banerjee M, et al. Hospital factors and racial disparities in mortality after surgery for breast and colon cancer. J Clin Oncol. 2009;27(24):3945–50. doi: 10.1200/JCO.2008.20.8546. [DOI] [PMC free article] [PubMed] [Google Scholar]
- 16.Huang LC, Tran TB, Ma Y, Ngo JV, Rhoads KF. Factors that influence minority use of high-volume hospitals for colorectal cancer care. Diseases of the colon and rectum. 2015;58(5):526–32. doi: 10.1097/DCR.0000000000000353. [DOI] [PMC free article] [PubMed] [Google Scholar]
- 17.NCI. NCI-Designated Cancer Centers. 2012 [updated 08/13/2012. Available from: http://www.cancer.gov/researchandfunding/extramural/cancercenters/about.
- 18.Perez-Andreu V, Roberts KG, Xu H, Smith C, Zhang H, Yang W, et al. A genome-wide association study of susceptibility to acute lymphoblastic leukemia in adolescents and young adults. Blood. 2015;125(4):680–6. doi: 10.1182/blood-2014-09-595744. [DOI] [PMC free article] [PubMed] [Google Scholar]
- 19.Roberts KG, Li Y, Payne-Turner D, Harvey RC, Yang YL, Pei D, et al. Targetable Kinase-Activating Lesions in Ph-like Acute Lymphoblastic Leukemia. New England Journal of Medicine. 2014;371(11):1005–15. doi: 10.1056/NEJMoa1403088. [DOI] [PMC free article] [PubMed] [Google Scholar]
- 20.Creutzig U, Büchner T, Sauerland MC, Zimmermann M, Reinhardt D, Döhner H, et al. Significance of age in acute myeloid leukemia patients younger than 30 years. Cancer. 2008;112(3):562–71. doi: 10.1002/cncr.23220. [DOI] [PubMed] [Google Scholar]
- 21.Stock W, La M, Sanford B, Bloomfield CD, Vardiman JW, Gaynon P, et al. What determines the outcomes for adolescents and young adults with acute lymphoblastic leukemia treated on cooperative group protocols? A comparison of Children's Cancer Group and Cancer and Leukemia Group B studies. Blood. 2008;112(5):1646–54. doi: 10.1182/blood-2008-01-130237. [DOI] [PMC free article] [PubMed] [Google Scholar]
- 22.Woods WG, Franklin ARK, Alonzo TA, Gerbing RB, Donohue KA, Othus M, et al. Outcome of adolescents and young adults with acute myeloid leukemia treated on COG trials compared to CALGB and SWOG trials. Cancer. 2013;119(23):4170–9. doi: 10.1002/cncr.28344. [DOI] [PMC free article] [PubMed] [Google Scholar]
- 23.Boissel N, Auclerc MF, Lheritier V, Perel Y, Thomas X, Leblanc T, et al. Should Adolescents With Acute Lymphoblastic Leukemia Be Treated as Old Children or Young Adults? Comparison of the French FRALLE-93 and LALA-94 Trials. J Clin Oncol. 2003;21(5):774–80. doi: 10.1200/JCO.2003.02.053. [DOI] [PubMed] [Google Scholar]
- 24.Ramanujachar R, Richards S, Hann I, Goldstone A, Mitchell C, Vora A, et al. Adolescents with acute lymphoblastic leukaemia: Outcome on UK national paediatric (ALL97) and adult (UKALLXII/E2993) trials. Pediatric Blood & Cancer. 2007;48(3):254–61. doi: 10.1002/pbc.20749. [DOI] [PubMed] [Google Scholar]
- 25.de Bont JM, Holt Bvd, Dekker AW, van der Does-van den Berg A, Sonneveld P, Pieters R. Significant difference in outcome for adolescents with acute lymphoblastic leukemia treated on pediatric vs adult protocols in the Netherlands. Leukemia. 2004;18(12):2032–5. doi: 10.1038/sj.leu.2403538. [DOI] [PubMed] [Google Scholar]
- 26.Alvarnas JC, Brown PA, Aoun P, Ballen KK, Bellam N, Blum W, et al. Acute lymphoblastic leukemia. Journal of the National Comprehensive Cancer Network : JNCCN. 2012;10(7):858–914. doi: 10.6004/jnccn.2012.0089. [DOI] [PubMed] [Google Scholar]
- 27.Alvarnas JC, Brown PA, Aoun P, Ballen KK, Barta SK, Borate U, et al. Acute Lymphoblastic Leukemia, Version 2.2015. Journal of the National Comprehensive Cancer Network : JNCCN. 2015;13(10):1240–79. doi: 10.6004/jnccn.2015.0153. [DOI] [PubMed] [Google Scholar]
- 28.Curran E, Stock W. How I treat acute lymphoblastic leukemia in older adolescents and young adults. Blood. 2015;125(24):3702–10. doi: 10.1182/blood-2014-11-551481. [DOI] [PMC free article] [PubMed] [Google Scholar]
- 29.Canner J, Alonzo TA, Franklin J, Freyer DR, Gamis A, Gerbing RB, et al. Differences in outcomes of newly diagnosed acute myeloid leukemia for adolescent/young adult and younger patients. Cancer. 2013;119(23):4162–9. doi: 10.1002/cncr.28342. [DOI] [PMC free article] [PubMed] [Google Scholar]
- 30.Wolfson J, Sun CL, Kang T, Wyatt L, D'Appuzzo M, Bhatia S. Impact of Treatment Site in Adolescents and Young Adults With Central Nervous System Tumors. Journal of the National Cancer Institute. 2014;106(8) doi: 10.1093/jnci/dju166. [DOI] [PMC free article] [PubMed] [Google Scholar]
- 31.Wolfson JA, Sun CL, Wyatt LP, Hurria A, Bhatia S. Impact of care at comprehensive cancer centers on outcome: Results from a population-based study. Cancer. 2015;121(21):3885–93. doi: 10.1002/cncr.29576. [DOI] [PMC free article] [PubMed] [Google Scholar]
- 32.Howell DL, Ward KC, Austin HD, Young JL, Woods WG. Access to Pediatric Cancer Care by Age, Race, and Diagnosis, and Outcomes of Cancer Treatment in Pediatric and Adolescent Patients in the State of Georgia. J Clin Oncol. 2007;25(29):4610–5. doi: 10.1200/JCO.2006.07.6992. [DOI] [PubMed] [Google Scholar]
- 33.Donabedian A. The quality of care. How can it be assessed? JAMA. 1988;260(12):1743–8. doi: 10.1001/jama.260.12.1743. [DOI] [PubMed] [Google Scholar]
Associated Data
This section collects any data citations, data availability statements, or supplementary materials included in this article.