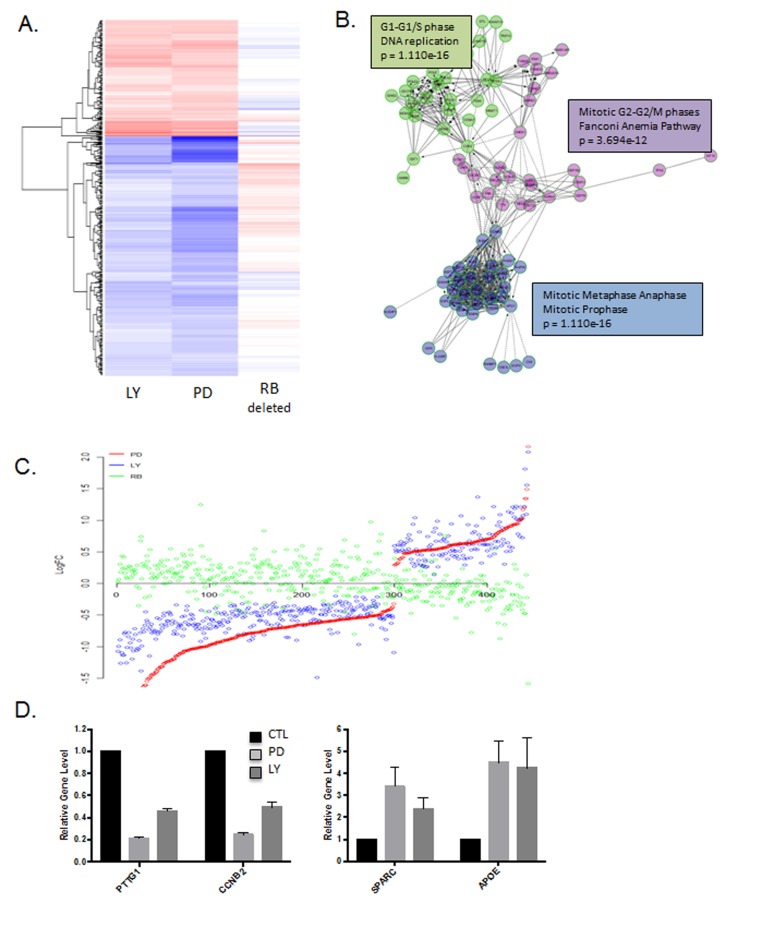
Figure 6. Gene expression responses to CDK4/6 inhibition.
in vivo: A. Heatmap depicting genes that were altered by treatment with either abemaciclib (LY) or palbociclib (PD). The expression of these genes in MB231 RB CRISPR/CAS9 deleted tumors is shown for comparison. B. Network analysis of genes repressed by abemaciclib demonstrating key enrichment of genes regulating cell cycle transitions. C. Comparison of gene expression changes in LY, PD and RB deleted cells. Log fold change is plotted on the y-axis with a given gene indicated by the dot. D. Select genes that are repressed or induced by abemaciclib (LY) and palbociclib (PD).

