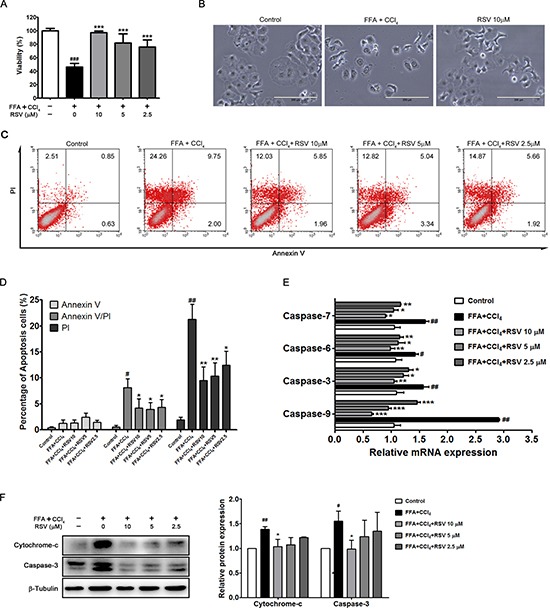
Figure 3. The effect of RSV on apoptotic cells.

HepG2 cells were first stressed by FFA and CCl4 (4 mM) solution, and then treated with RSV (2.5 μM, 5 μM and 10 μM) for 24 h, and cell viability was determined (A). Representative images of the morphological change upon 10μM RSV treatment were obtained (B), magnification, 200×). The effect of RSV treatment (2.5 μM, 5 μM and 10 μM) on apoptosis was indicated by annexin V (FITC)/PI binding assay (C), and the percentage of apoptotic cells was calculated (D). qRT-PCR analysis showed the genetic changes in response to RSV treatment (E), and western blot analysis showed the protein expression of cytochrome-c and caspase-3 of the cells (F). The data were presented as the mean ± sd of three independent experiments. #p < 0.05, ##p < 0.01 vs control cells; *p < 0.05, *p < 0.01, ***p < 0.001 vs FFA+CCl4 stressed cells.
