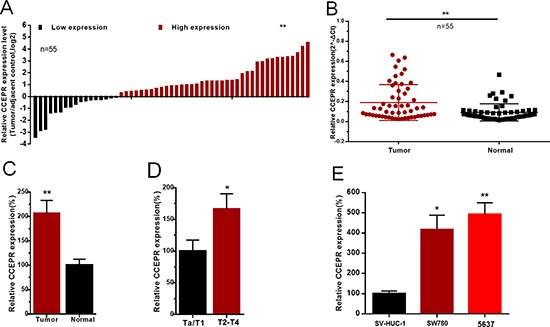
Figure 1. The relative expression levels of CCEPR in bladder cancer.

(A) The heights of the columns in the chart represent the log2-transformed fold changes (bladder cancer tissue/normal bladder tissue) in CCEPR expression in 55 patients with bladder cancer. (B and C) CCEPR is up-regulated in bladder cancer tissues compared with corresponding non-tumor tissues. (D) CCEPR was up-regulated in patients with advanced TNM stage. (E) CCEPR was up-regulated in bladder cancer cell lines. Data are shown as mean ± SD. *p < 0.05; **p < 0.01.
