


Abstract
Amplified differential gene expression (ADGE) is a novel technique, designed to profile gene expression of the whole transcriptome or to compare expression of a set of genes between two samples. ADGE employs hybridization to quadratically amplify the ratio of an expressed gene between control and tester samples before displaying. The subtle structures of adapters and primers are designed for displaying the amplified ratio of an expressed gene between two samples. Four selective nucleotides at the 3′ end of primers are used to increase PCR efficiency for targeted molecules and to improve detection of PCR products. Double PCR with the same pair of primers expands the detection range, especially for genes of low abundance. Integration of these steps makes ADGE sensitive and accurate. Application to drug resistant human tumor cell lines showed that ADGE accurately profiled expression levels for induced, repressed or unchanged genes. The qualitative expression patterns for ADGE were verified with RT–PCR.
INTRODUCTION
Regulation of gene expression underlies cellular response to a wide range of biological functions. Characterization of differences, both qualitative and quantitative, in transcript expression patterns provides information, which is critical to understanding mechanisms underlying processes such as malignant transformation and stress response. Drug resistant cell lines provide a primary example of stress response, where acquired resistance is achieved through the sequential selection pressure of escalating drug concentrations. Our own research interests have compared gene expression patterns in an adriamycin (ADR) resistant clonal sub-population of an HL60 human leukemia cell line (1). There are presently a number of methodologies that have been developed to identify altered mRNA expression in model systems. For example, these include differential display (2–5), suppression subtractive hybridization (6), representational difference analysis (7,8), serial analysis of gene expression (9–11) and DNA microarray (12,13). Among these methods sensitivity and reliability vary, depending on their displaying systems. One consistency, however, is that these techniques do not amplify possible expression differences prior to displaying them.
This paper presents a method that quadratically amplifies the ratio of a gene in two samples before displaying. The quadratic amplification is achieved based on the principle of the algebra formula
(a + b)(a + b) = a2 + b2 + 2ab.
The quadratic amplification keeps the same ratio for those genes with the same transcription level, but quadratically increases the ratio for those with different expression levels. By applying this amplification method to the differential display, a new technique, amplified differential gene expression (ADGE), was developed to reveal gene expression profiles between two samples. Application on two closely related cell lines suggested that ADGE can be both sensitive and accurate and can have significant advantages over other technologies.
MATERIALS AND METHODS
Cell lines
The HL60/ADR cell line is resistant to ADR and derived from the wild-type HL60 by stepwise selection. Both HL60/ADR and HL60 cells were cultured in RPMI-1640 medium supplemented with 2 mM l-glutamine, 50 U/ml penicillin, 50 µg/ml streptomycin and 10% heat-inactivated fetal bovine serum. Cells were maintained in a humidified atmosphere of 5% CO2 at 37°C.
Adapters and primers
The adapter CT is for control and adapter TT for tester sample. Both have cohesive ends complementary to TaqI (Fig. 1). Primer CT is complementary to adapter CT while primer TT is complementary to adapter TT. The assigned number in the primer name represents the four 3′ end nucleotides selective for a set of displayed genes. The selective nucleotides for primers used in this experiment are: CT22/TT22, TGAT; CT60/TT60, ATTC; CT134/TT134, AGTC; CT193/TT193, GGAG; CT196/TT196, GCAC; CT200/TT200, CCAC; CT218/TT218, GGCT.
Figure 1.
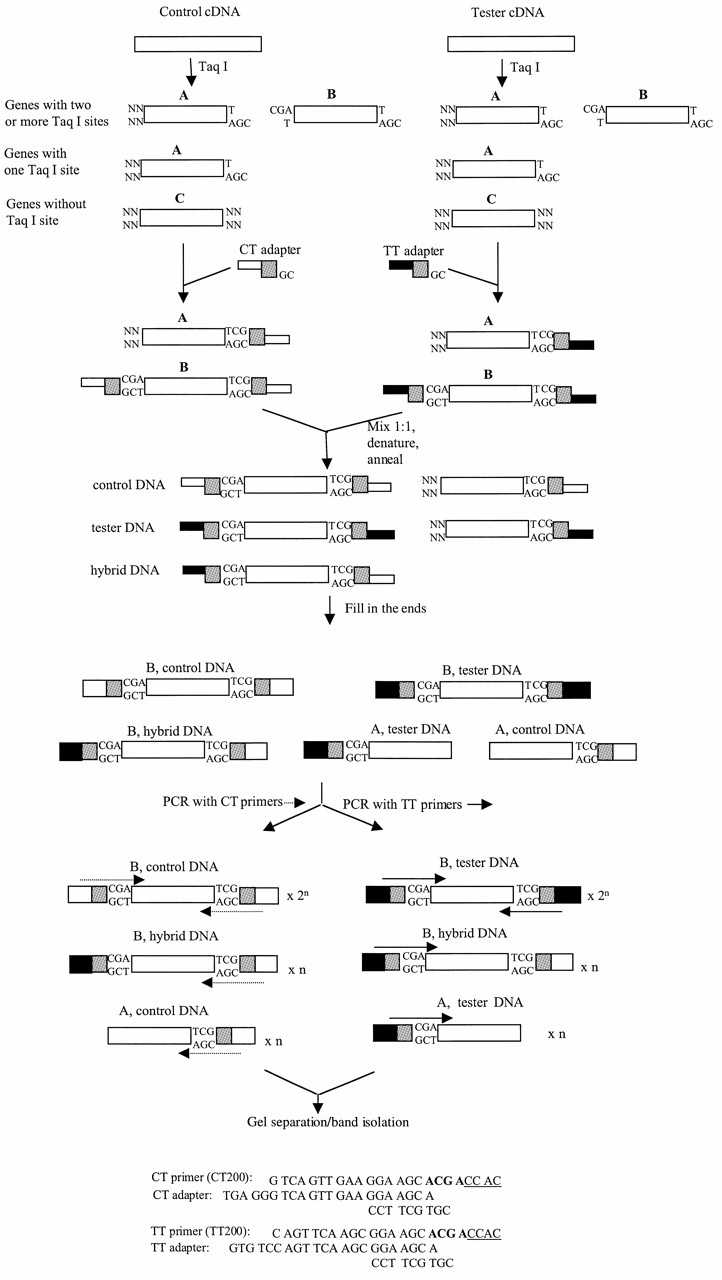
Schematic representation of ADGE. Double-stranded cDNA of control and tester samples are cut with the TaqI restriction enzyme. TaqI digestion generates three types of molecules: type A with the TaqI cut site at one end, type B with the TaqI cut sites at both ends, and type C without the TaqI cut site at either end. Type B was selected as the target molecule. The TaqI fragments of control cDNA and tester DNA were ligated to CT adapter and TT adapter (sequences at the bottom), respectively. Molecules of type A and type B were ligated to adapters. The same amounts of control and tester DNA were hybridized to generate the hybrid DNA of type B, which quadratically amplified the ratio of control and tester DNA. After filling in the ends of adapters, hybridized DNA was amplified with a pair of CT primers and with a pair of TT primers with the same selective nucleotides, respectively. CT primers amplify control type B DNA exponentially and hybrid type B DNA and control type A DNA linearly. TT primers amplify tester type B DNA exponentially and hybrid type B DNA and tester type A DNA linearly. The PCR products were separated. The bands of interest were isolated and identified. The sequences of primers CT200 and TT200 are presented as examples. The region corresponding to TaqI site is in bold and four selective nucleotides are underlined. The differences between TT primers (or CT primers) are the four selective nucleotides.
Preparation of hybridized DNA
Total RNA was isolated from HL60 and HL60/ADR cells with a Qiagen RNeasy Midi Kit. Samples (5.5 µg) of total RNA of HL60 and HL60/ADR were reverse-transcribed to cDNA using the Gibco cDNA Synthesis System. After phenol extraction and ethanol precipitation, cDNA samples were resuspended in 30 µl of ddH2O, cut with 40 U of TaqI in a 40 µl reaction at 65°C for 2 h. As the HL60 cell line was used as control, TaqI fragments of HL60 DNA were ligated to CT adapter. The TaqI fragments of HL60/ADR DNA were ligated to TT adapter. Ligation reactions were set up by adding 5 µl 10× SB buffer, 4 µl 30 µM adapter, 3 U of ligase to 40 µl of restriction reaction and carried out overnight at 14°C. Fifteen microliters of HL60 ligation mixtures and 15 µl of HL60/ADR ligation mixtures were mixed with 30 µl of 2× HB buffer and hybridized at 95°C for 5 min, then 68°C for 10 h. The hybridized DNA was used directly as template for PCR amplification.
PCR amplification of hybridized DNA
The hybridized DNA was amplified with a pair of CT primers complementary to the CT adapter and with a pair of TT primers with the same selective nucleotides as CT primers. Clontech cDNA polymerase was used in a 50 µl reaction consisting of 1 µl of hybridized DNA, 1 µl of each primer, 1 µl of 10 mM dNTPS, 5 µl of 10× buffer, 1 µl of polymerase and 40 µl of H2O. The reaction cycling conditions were 72°C for 5 min (for filling in adapter ends), 94°C for 1 min, then 30 cycles of 94°C for 30 s, 70°C for 30 s, 72°C for 40 s, then 72°C for 5 min for a final extension. A sample (1 µl) of primary PCR product was taken to make up 50 µl of secondary PCR reaction with the same primers for the primary PCR. The cycling conditions were 94°C for 1 min, then 14 cycles of 94°C for 30 s, 70°C for 30 s, 72°C for 40 s, then 72°C for 5 min.
Analysis of differentially expressed genes
The primary PCR product was separated for 3.5 h at 120 V on 2.5% Metaphor gel (FMC, Rockland, MN) containing GelStar gel stain (FMC). The secondary PCR product was separated on 3% Metaphor gel for 3 h at 120 V. By comparing a pair of CT primers with a pair of TT primers with the same selective nucleotides, the bands of interest were identified, isolated and suspended in 30 µl of EB buffer. DNA was eluted by incubating the isolated band at 60°C for 15 min. The eluates of these bands were reamplified with the corresponding primers. The reamplification reaction consisted of 1 µl of elute, 1 µl of each primer, 1 µl of 10 mM dNTPS, 5 µl of 10× buffer, 1 µl of Clontech cDNA polymerase and 40 µl of H2O. The reaction cycling conditions were 94°C for 1 min, then 30 cycles of 94°C for 30 s, 70°C for 30 s, 72°C for 40 s, then 72°C for 5 min. The PCR products were gel-purified and sequenced with the corresponding primers. Sequences were analyzed with software Sequencher 3.1 and searched against GenBank.
RT–PCR
RT–PCR was used to verify the ADGE results. Primers for RT–PCR were designed based upon the sequences from the identified genes or fragments with software OLIGO 4.0. The same total RNA samples that were used for making hybridized DNA were reverse-transcribed with Superscript II reverse transcriptase. The cDNA was used as the template for PCR amplification. After different PCR cycles were tested, specific PCR cycle conditions were selected within the range of the linear amplification for each gene, to optimize the levels of differential expression; i.e. 25 cycles for A1, 30 cycles for A2, A3 and A6, 35 cycles for A4 and A5. The annealing temperature for each pair of primers was determined based upon their Tm; 58°C for A1 and A3; 60°C for A2; 70°C for A4 and A5; 62°C for A6. A sample (12 µl) of each reaction was separated on 1.8% agarose gel at 100 V for 1 h.
RESULTS AND DISCUSSION
Description of the ADGE technique
The scheme of the ADGE technique is shown in Figure 1. Two different nucleic acid samples are selected, one for control, the other for tester. After they are synthesized from total RNA or mRNA, the control and tester cDNA are cut with TaqI. The TaqI fragments of control DNA and tester DNA are ligated to CT adapter and TT adapter, respectively. The same amount of adapterized control and tester DNA are hybridized together. The hybridized DNA is amplified with a pair of CT primers complementary to CT adapter and with a pair of TT primers with the same selective nucleotides, respectively. A secondary PCR reaction is set up with the same pair of primers after primary PCR. The primary and secondary PCR products are separated on gels. By comparing pairs of CT and TT primers with the same selective nucleotides, unique bands are isolated and identified. Finally, eluates of these bands are reamplified and sequenced. The corresponding genes are searched against a database such as GenBank.
The major advantage of ADGE is that it quadratically amplifies the ratio of a gene in two samples before displaying. The quadratic amplification is achieved through hybridization of control and tester DNA. As shown in Figure 1, ADGE requires that the adapterized control DNA and the adapterized tester DNA be mixed together at a ratio of 1:1 in weight or molarity. After denaturing and annealing, three different types of the targeted molecule type B are formed: control DNA with CT adapters on both ends, tester DNA with TT adapters on both ends, hybrid DNA with the CT adapters on one end and the TT adapters on the other end. The relative amount of the three types of targeted molecules for each gene is in theory governed by the algebra formula
(a + b)(a′ + b′) = aa′ + bb′ + a′b + ab′.
Where a, the number of sense strands of one gene in the control sample; b, the number of sense strands of the gene in the tester sample; a′, the number of antisense strands of one gene in the control sample; b′, the number of antisense strands of the gene in the tester sample; aa′, the number of double strands of the gene in the control sample; bb′, the number of double strands of the gene in the tester sample; a′b, ab′, the number of double strands of the hybridized DNA.
Therefore, for a gene with the same transcript level between control and tester samples, the ratio of aa′/bb′ stays the same after denaturing and annealing. However, 50% of the nucleotides are in the form of hybrid a′b or ab′, which normalizes the abundant housekeeping genes. For a gene with a different expression level between control and tester samples, the ratio of aa′ and bb′ is quadratically amplified after denaturing and annealing. For example, for a gene overexpressed five times in tester over control, bb′/aa′ = 5. Thus, the formula is
(a + 5b)(a′ + 5b′) = aa′ + 25bb′ + 5ab′ + 5a′b.
After denaturing and annealing, the ratio of bb′/aa′ increases from 5 to 25. If expression of another gene is, for example, reduced 10 times in tester, then the formula is
(10a + b)(10a′ + b′) = 100aa′ + bb′ + 10ab′ + 10a′b.
Therefore, the ratio of aa′/bb′ increased from 10 to 100 after denaturing and annealing.
The structure of the adapter and primer is critical to ensure the quadratic amplification of a gene ratio after hybridization. The adapters are composed of long and short oligos (Fig. 1). The short oligos are the same between CT and TT adapters in order to form hybrid DNA molecules. The optimum complementary region is 7 nt. If it is too short, the adapters may not be stable, if too long, cross priming becomes possible. The adapters have cohesive ends complementary to TaqI. However, the TaqI site is not recovered from ligation. The CT and TT primers consist of regions complementary to the adapters, regions corresponding to TaqI sites and four selective nucleotides. The length of different regions between CT and TT primers should be sufficient to prevent cross priming (at least 10 nt long). Although their sequences can be changed, CT, TT adapters and primers are designed using the recommended principle so that CT primers amplify aa′ molecules exponentially and a′b and ab′ molecules linearly while TT primers amplify bb′ molecules exponentially and a′b and ab′ molecules linearly.
The ADGE scheme in Figure 1 can be adapted by implementing a number of modifications. For example, other 4 bp restriction enzymes besides TaqI can be used and are recommended for those genes with one TaqI site or without a TaqI site. The 3′ end of CT and TT adapters can be phosphorylated. The number of the selective nucleotides can be less than four, in which case a sequencing gel system is recommended to separate PCR products. The PCR products can be visualized with either isotope or fluorescence labels.
This paper recommends that four selective nucleotides are used to reduce the number of candidate PCR templates, thereby increasing the PCR efficiency for each candidate template and allowing the use of small gels to separate PCR products. A pair of primers with four selective nucleotides at the 3′ ends amplifies 1/65 536 of the total genes in a transcriptome at one time. Assuming 50 000 genes in a transcriptome and an average gene size of 1500 bp theoretically generating five TaqI fragments of type B, there are 250 000 TaqI fragments of type B amplifiable with PCR. Therefore, every PCR produces an average of 3.8 bands (250 000/65 536). Amplifying such a small set of genes at a time increases the PCR efficiency for targeted molecules. This paper recommends that high-resolution Metaphor agarose gels and high-sensitivity GelStar gel stain be used to detect the small set of PCR products. These factors also facilitate a more efficient and safer methodology.
This paper recommends that a double PCR be used to detect rare genes. If 2% of total RNA is poly(A) RNA and average gene size is 1500 bp, 5 µg of total RNA can generate 0.40 pmol of cDNA. If 0.4 pmol of control DNA is hybridized to 0.4 pmol of tester DNA in 60 µl and 50 000 genes are in a transcriptome, 1 µl of hybridized DNA for PCR contains 0.8/(50 000 × 60) = 2.7 × 10⁻⁷ pmol for an intermediately prevalent gene. Such low amounts of template, while enough for abundant genes, are not sufficient to detect products of a single primary PCR for a gene of intermediate or low expression level. Thus, double PCR for each pair of primers is recommended. The primary PCR products will identify abundant genes, while the secondary PCR products detect genes of low abundance. Therefore, double PCR increases the sensitivity and detection range of ADGE.
Differential gene expression between HL60 and HL60/ADR
The ADGE technique can be applied in two modes: globally screening the whole transcriptome with randomly selected primers or partially screening a set of known genes with targeted primers. DNA-PK and MRP are known to be overexpressed in HL60/ADR cells (1). From the TaqI restriction maps of DNA-PK and MRP, a 610 bp DNA-PK fragment (8052–8661 bp) and a 555 bp MRP fragment (3719–4274 bp) were selected. Based on the internal sequences next to TaqI sites, primers CT200, CT218, TT200, TT218 were designed for DNA-PK; primers CT193, CT22, TT193, TT22 for MRP. The primers CT196, CT134, TT196, TT134 were also designed for amplifying the segment from 285 to 741 bp of the β-actin gene, which was used as internal control.
Figure 02 shows the ADGE profile of primary PCR (Fig. 02A) and secondary PCR (Fig. 02B). Band A1 was identified as a fragment of the β-actin gene. Bands A2 and A3 were identified as fragments of DNA-PK and MRP, respectively. The secondary PCR in Figure 02B displayed other novel bands A4–A6. The sequences identified A4 as novel, A5 as seb4B and A6 as DnaJ (Table 1).
Figure 2.
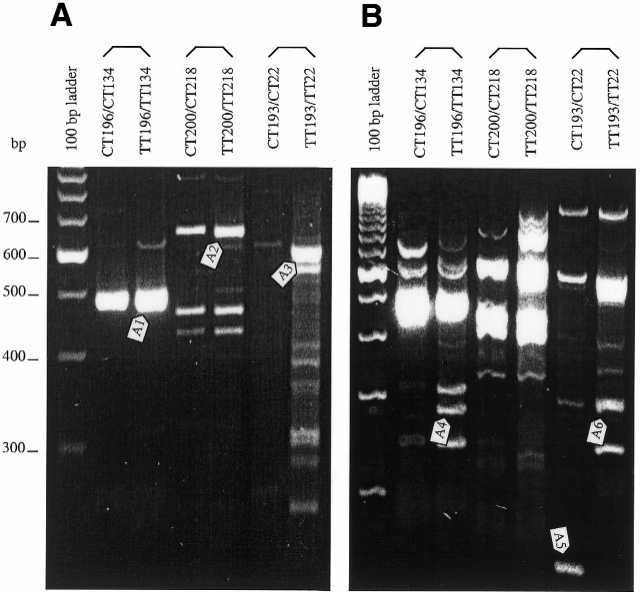
ADGE profile of HL60 and HL60/ADR cell lines. The two lanes under one bracket were compared, the left lane representing HL60 DNA (control) and the right lane representing HL60/ADR DNA (tester). The bands identified by arrows were isolated for sequencing. (A) Primary PCR products, separated for 3.5 h at 120 V on 2.5% Metaphor agarose gel containing GelStar gel stain. (B) Secondary PCR products, separated on 3% Metaphor gel at 120 V for 3 h.
Table 1. Summary of sequence analysis of bands A1–A6.
| Bands | Genes | GenBank accession | Gene size (bp) | Position of two ends (bp) | Sequences of two ends and selective nucleotides of primers | |
| |
|
|
|
5′ |
3′ |
|
| CT196-GCAC | ||||||
| A1 | β-actin | NM-001101 | 1793 | 285 | 741 | TCGAGCAC-//-GACTTCGA |
| CTGA-CT134 | ||||||
| TT200-CCAC | ||||||
| A2 | DNA-PK | HSU34994 | 12 780 | 8052 | 8661 | TCGACCAC-//-AGCCTCGA |
| TCGG-TT22 | ||||||
| TT193-GGAG | ||||||
| A3 | MRP | L05628 | 5011 | 3719 | 4274 | TCGAGGAG-//-ATCATCGA |
| TAGT-TT2 | ||||||
| TT134-AGTC | ||||||
| A4 | Novel | TCGAAGTC-//GTGCTCGA | ||||
| GACG-TT196 | ||||||
| CT193-GGAG | ||||||
| A5 | seb4B | X75315 | 1438 | 144 | 268 | TCGAGGAG-//-ATCATCGA |
| TAGT-CT22 | ||||||
| TT193-GGAG | ||||||
| A6 | DnaJ | D13388 | 1435 | 873 | 1082 | TCGACGAG-//-ATCATCGA |
| ↑ TAGT-TT22 |
Arrow indicates the mismatch between selective nucleotides of primer and gene sequence adjacent to the TaqI site.
Because PCR in ADGE has several types of templates with different initial concentrations while RT–PCR has a single type of template with concentrations different from those in ADGE, the PCR efficiency differs between them. A measure of the comparative quantitative relationship between ADGE and RT–PCR is provided by Table 2 (Fig. 03). The ratios of HL60/ADR to HL60 bands were greater for the induced genes (A2, A3, A4 and A6) in ADGE than in RT–PCR. The ratios of HL60/ADR to HL60 bands decreased for the repressed gene (A5) in ADGE (Table 2). It is indicated that ADGE successfully amplified the ratio of HL60/ADR to HL60 bands for induced genes and the ratio of HL60 to HL60/ADR bands for repressed genes even though the specific amplification values showed some variation. Therefore, the ADGE technique increased the sensitivity and accuracy of detection.
Table 2. The ratios of the HL60/ADR to HL60 for bands A1–A6 from ADGE and RT–PCR.
| Bands |
A1 |
A2 |
A3 |
A4 |
A5 |
A6 |
| ADGE | 1.37 (1) | 3.79 (2.76) | 47.60 (34.7) | 13.50 (9.85) | 0.027 (0.02) | 4.07 (2.97) |
| RT–PCR | 1.07 (1) | 2.23 (2.08) | 9.81 (9.16) | 1.34 (1.25) | 0.860 (0.80) | 1.53 (1.43) |
The ADGE data of A1, A2 and A3 were from quantifying the corresponding bands in Figure 2A with NIH Image 1.62. The ADGE data of A4, A5 and A6 were from bands in Figure 2B. The RT–PCR data of A1–A6 were from the bands in Figure 3. The data in parenthesis were normalized with the A1 (β-actin) data in ADGE and RT–PCR.
Figure 3.
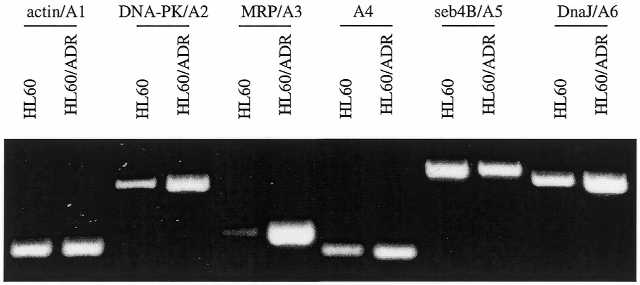
RT–PCR of A1–A6. The same total RNA samples for making hybridized DNA were reverse-transcribed with Superscript II reverse transcriptase. The number of PCR cycles was selected within the range of the linear amplification for each gene: 25 cycles for A1; 30 cycles for A2, A3 and A6; 35 cycles for A4 and A5. The annealing temperature for each pair of primers was determined based upon their Tm: 58°C for A1 and A3; 60°C for A2; 70°C for A4 and A5; 62°C for A6. Twelve microliters of each reaction was separated on 1.8% agarose gel at 100 V for 1 h.
The number of RT–PCR cycles was optimized for each gene, 25 cycles for β-actin, 30 cycles for DNA-PK, MRP and DnaJ, 35 cycles for A4 and seb4B. Therefore, β-actin was the most abundant of the six genes. A4 and seb4B were less abundant than DNA-PK, MRP and DnaJ in the transcriptome. For these six genes, the sizes varied from 1.4 kb (DnaJ) to 12 kb (DNA-PK). The targeted positions could be the 3′ region (seb4B) or 5′ region (DnaJ) (Table 1). Analysis of end sequences showed only one mismatch between the selective nucleotides and internal sequences of genes over 12 pairs of primers (Table 1). Occurrence of the nucleotide mismatch primarily increases the number of displayed bands. For example, DnaJ should be amplified with the primer TT197 of selective nucleotides CGAG, but not with TT193 of GGAG. As the amplifiable templates for CT193/CT22 were low or missing in HL60 cells, the PCR yield of CT193/CT22 was repeatedly shown to be lower than that of TT193/TT22 (Figure 02).
In summary, the ADGE technique increased the sensitivity, accuracy and range of detection. It accurately profiled the expression patterns for overexpressed, repressed or unchanged genes.
Acknowledgments
ACKNOWLEDGEMENTS
We would like to thank Drs Warren Davis and Maureen Murphy for their valuable discussion. This work was supported in part by National Institutes of Health grant nos CA06927 and RR05539, National Institutes of Health grant no. CA85660 to K.D.T., and by appropriation from the Commonwealth of Pennsylvania.
References
- 1.Shen H., Schultz,M., Kruh,G.D. and Tew,K.D. (1998) Increased expression of DNA-dependent protein kinase confers resistance to adriamycin. Biochim. Biophys. Acta, 1381, 131–138. [DOI] [PubMed] [Google Scholar]
- 2.Liang P. and Pardee,A. (1992) Differential display of eukaryotic messenger RNA by means of the polymerase chain reaction. Science, 257, 967–970. [DOI] [PubMed] [Google Scholar]
- 3.Matz M., Usman,N., Shagin,D., Bogdanova,E. and Lukyanov,S. (1997) Ordered differential display: a simple method for systematic comparison of gene expression profiles. Nucleic Acids Res., 25, 2541–2542. [DOI] [PMC free article] [PubMed] [Google Scholar]
- 4.Kohroki J., Tsuchiya,M., Fujita,S. and Nakanishi,T. (1999) A novel strategy for identifying differential gene expression: an improved method of differential display analysis. Biochem. Biophys. Res. Commun., 262, 365–367. [DOI] [PubMed] [Google Scholar]
- 5.Wang A., Pierce,A., Judson-Kremer,K., Gaddis,S., Aldaz,C.M., Johnson,D.G. and MacLeod,M.C. (1999) Rapid analysis of gene expression (RAGE) facilitates universal expression profiling. Nucleic Acids Res., 27, 4609–4618. [DOI] [PMC free article] [PubMed] [Google Scholar]
- 6.Diatchenko L., Lau,Y., Campbell,A., Chenchik,A., Moqadam,F., Huang,B., Lukyanov,S., Lukyanov,K., Gurskaya,N., Sverdlov,E. et al. (1996) Suppression subtractive hybridization: a method for generating differentially regulated or tissue-specific cDNA probes and libraries. Proc. Natl Acad. Sci. USA, 93, 6025–6030. [DOI] [PMC free article] [PubMed] [Google Scholar]
- 7.Lisitsyn N., Lisitsyn,N. and Wigler,M. (1993) Cloning the differences between two complex genomes. Science, 259, 946–951. [DOI] [PubMed] [Google Scholar]
- 8.Hubank M. and Schatz,D. (1994) Identifying differences in mRNA expression by representional difference analysis of cDNA. Nucleic Acids Res., 22, 5640–5648. [DOI] [PMC free article] [PubMed] [Google Scholar]
- 9.Velculescu E.V., Zhang,L., Zhou,W., Volgestein,J., Basrai,A.M., Bassett,E.D., Hieter,P., Vogelstein,B. and Kinzler,P. (1997) Characterization of the yeast transcription. Cell, 88, 243–251. [DOI] [PubMed] [Google Scholar]
- 10.Zhang L., Zhou,W., Velculescu,E.V., Kern,S.E., Hruban,R.H., Hamilton,S.R., Vogelstein,J. and Kinzler,J. (1997) Gene expression profiles in normal and cancer cells. Science, 276, 1268–1272. [DOI] [PubMed] [Google Scholar]
- 11.Spinella D.G., Bernardino,A.K., Redding,A.C., Koutz,P., Wei,Y., Pratt,E.K., Myers,K.K., Chappell,G., Gerken,S. and McConnell,S.J. (1999) Tandem arrayed ligation of expressed sequence tags (TALEST): a new method for generating global gene expression profiles. Nucleic Acids Res., 27, e22. [DOI] [PMC free article] [PubMed] [Google Scholar]
- 12.Khan J., Sal,H.L., Bittner,L.M., Chen,Y., Trent,M.J. and Meltzer,S.P. (1999) Expression profiling in cancer using cDNA microarrays. Electrophoresis, 20, 223–229. [DOI] [PubMed] [Google Scholar]
- 13.Coller A.H., Grandori,C., Tamayo,P., Colbert,T., Lander,S.E. and Eisenman,N.R. (2000) Expression analysis with oligonucleotide microarrays reveals that MYC regulates genes involved in growth, cell cycle, signaling, and adhesion. Proc. Natl Acad. Sci. USA, 97, 3260–3265. [DOI] [PMC free article] [PubMed] [Google Scholar]