

SUMMARY
The physiological relevance of structures within mammalian mRNAs has been elusive, as these mRNAs are less folded in cells than in vitro and have predicted secondary structures no more stable than those of random sequences. Here, we investigate possibility that mRNA structures facilitate the 3′-end processing of thousands of human mRNAs by juxtaposing poly(A) signals (PASs) and cleavage sites that are otherwise too far apart. We find that RNA structures are predicted to be more prevalent within these extended 3′-end regions than within PAS-upstream regions, and indeed are substantially more folded within cells, as determined by intracellular probing. Analyses of thousands of ectopically expressed variants demonstrate that this folding both enhances processing and increases mRNA metabolic stability. Even folds with predicted stabilities resembling those of random sequences can enhance processing. Structure-controlled processing can also regulate neighboring gene expression. Thus, RNA structure has widespread roles in mammalian mRNA biogenesis and metabolism.
In brief
Folded structures near 3′ ends enhance both the maturation and the stability of many human mRNAs.
INTRODUCTION
Although the functions of many noncoding RNAs (ncRNAs), such as ribosomal RNAs (rRNAs) and tRNAs, depend on their folded structures, much less is known about the physiological relevance of structures in mRNAs. In silico analyses show that unlike ncRNAs with structure-dependent functions, mRNAs are not predicted to be more stably folded than random sequences with the same nucleotide composition, even when only 5′ or 3′ untranslated regions (UTRs) are considered, raising questions as to whether most predicted structures in mRNAs are functional (Workman and Krogh, 1999; Clote et al., 2005). Moreover, high-throughput chemical probing of mRNAs from diverse eukaryotes shows that substantially fewer regions are structured in cells than in vitro, in part due to ATP-dependent cellular processes that unfold mRNA structures (Ding et al., 2014; Rouskin et al., 2014; Spitale et al., 2015). Even the highly stable RNA G-quadruplexes are globally unfolded in human, mouse, and yeast cells (Guo and Bartel, 2016). In addition, the functional relevance of the mRNA structures that are supported by in vivo probing remains largely unaddressed; although several mRNA features are associated with folding in cells, the observations remain largely descriptive and correlative (Mortimer et al., 2014; Spitale et al., 2015).
Structures at 3′ ends are important for the processing, stability, and translation of canonical histone mRNAs, which are not polyadenylated (Marzluff et al., 2008), as well as the stability of some other non-polyadenylated RNA Polymerase II (Pol II) transcripts, such as MALAT1 (Brown et al., 2012; Wilusz et al., 2012). However, the presence and function of RNA structures at the 3′ ends of polyadenylated RNAs, including all other mRNAs and most long ncRNAs, are less well studied. Adding to the challenge, existing high-throughput structural probing assays miss structures at the very 3′ ends of RNAs.
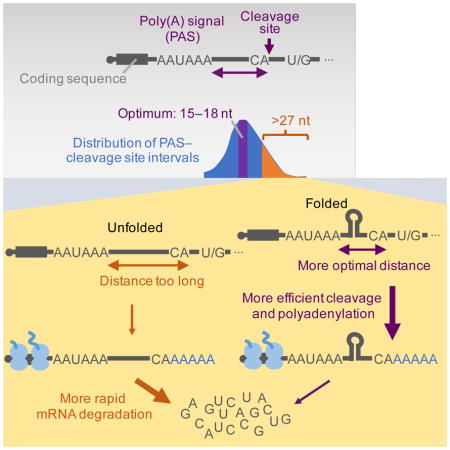
Cleavage and polyadenylation of Pol II transcripts are critical for transcription termination, cytoplasmic localization, RNA stability, and translation (Tian and Manley, 2017). Cleavage and polyadenylation depends on a set of well-positioned sequence motifs, mainly an upstream PAS, typically AAUAAA or AUUAAA, and a downstream U/G-rich or U-rich motif. Previous mutagenesis studies of a few model 3′ regions show that efficient processing requires a narrow range of 10–30 nt between the PAS and the cleavage-and-polyadenylation site, hereafter called the poly(A) site (McDevitt et al., 1986; Gil and Proudfoot, 1987; Heath et al., 1990; Chen et al., 1995). However, some human mRNAs appear to use a PAS that falls >30 nt upstream of the poly(A) site (Chen et al., 1995). Based on observations made for a few viral RNAs (Ahmed et al., 1991) and synthetic constructs (Brown et al., 1991), RNA folding is proposed to facilitate the processing of these endogenous cellular mRNAs by bringing poly(A) sites closer to the PASs (Chen et al., 1995). However, whether endogenous 3′ regions are capable of folding and actually folded in cells is an open question, as no endogenous mammalian genes have been shown to depend on this mechanism. We set out to answer this question, and in the process discovered that for many mRNAs the 3′-end region is a privileged part of the mRNA that is less subject to the unfolding that happens elsewhere. Moreover, this folding of mRNA 3′ regions also enhances mRNA stability and can influence the expression of downstream genes.
RESULTS
RNA Structures and the Distance Constraints on the PAS
To revisit the relationship between PAS position and 3′-end processing using current mRNA annotations, we analyzed the human mRNAs from the RefSeq database (O’Leary et al., 2016). Although a clear preference for a PAS–poly(A) site distance of 13–25 nt was observed, of the 19,624 mRNAs with a canonical PAS (AAUAAA or AUUAAA) within 100 nt of the poly(A) site, 2,545 (13%) had a PAS–poly(A) site distance of >27 nt (Figure 1A). Of these 2,545, most (1,763) had no alternative PASs within 10–30 nt of the poly(A) site, suggesting that most of these distal canonical PASs were functional despite their suboptimal distances from the poly(A) sites.
Figure 1. The Distance Constraints on PASs and the Potential Influence of Predicted mRNA Structures.
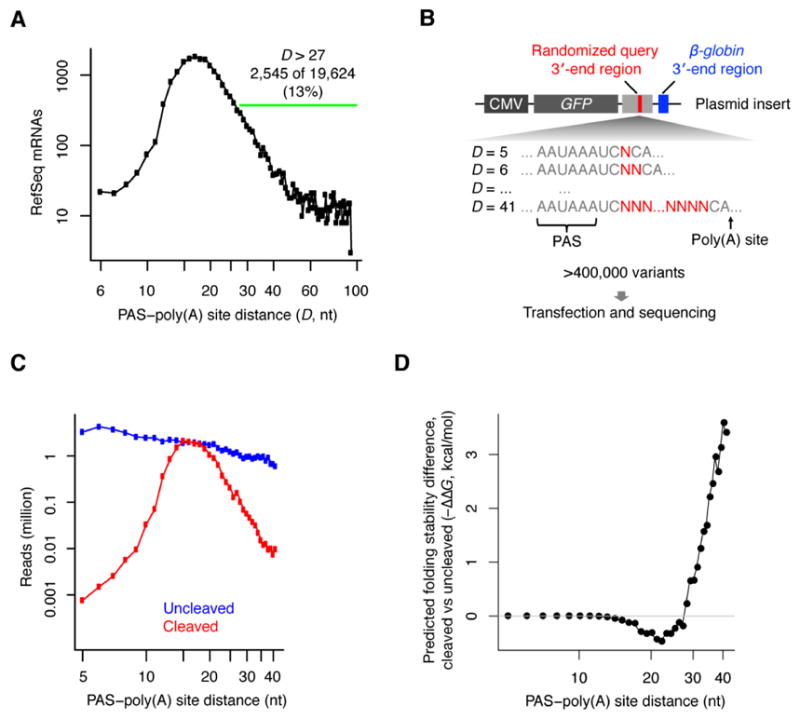
(A) The distribution of distances between canonical PASs (AAUAAA/AUUAAA) and poly(A) sites in human RefSeq mRNA annotations with a canonical PAS within their last 100 nt.
(B) Schematic of an experiment that simultaneously measured the processing efficiency of many 3′-end variants encoded by a library of plasmids. Each member of the library contained two potential poly(A) sites. The upstream poly(A) site was within the query 3′-end region, which included a segment (red bar) that was randomized (red Ns) with respect to both nucleotide identity and nucleotide number, such that the distance between the query PAS and the poly(A) site (D) ranged from 5–41 nt. The downstream poly(A) site was from the β-globin 3′-end region.
(C) Relationship between cleavage efficiency and PAS–poly(A) site distance. Plotted are the numbers of reads representing variants with each indicated distance, distinguishing between reads for transcripts processed at the query site (cleaved, red) and those for transcripts that failed to be processed at the query site but were processed at the downstream β-globin site (uncleaved, blue).
(D) Relationship between the predicted folding stability differences and PAS–poly(A) site distance. Plotted is the difference of average predicted folding stability (−ΔG) observed between transcripts processed at the query site (cleaved) and transcripts that failed to be processed at the query site but were processed at the downstream β-globin site (uncleaved). Transcripts with <7 reads were excluded.
To characterize the constraints on PAS position and the potential role of RNA structures in bypassing these constraints, we simultaneously tested the in vivo processing of >400,000 artificial 3′-end regions with variable PAS–poly(A) site distances (Figure 1B). For each PAS–poly(A) site distance from 5 to 41 nt, we generated either all possible sequence variants or a sufficient number of variants (up to tens of thousands) such that sequence-specific effects averaged out (Figure 1B). The β-globin 3′ end was placed downstream of each query region to allow efficient processing and identification of molecules that were not processed at the query site. A DNA library encoding these variants was inserted into an expression vector behind the GFP gene and transfected into HEK293T cells. After allowing 24 hours for expression, the 3′ regions of the GFP mRNAs were reverse transcribed and sequenced.
All designed PAS–poly(A) site distances (5 to 41) were well-represented in the mRNA that was not cleaved at the upstream query site yet was processed at the downstream β-globin poly(A) site, with some preference for shorter variants, presumably imposed during library construction or sequencing (Figure 1C, blue). In contrast, the PAS–poly(A) site distances of the mRNA processed at the query site peaked sharply at 15–18 nt, implying optimal processing efficiencies at these distances (Figure 1C, red). These results were largely consistent with the analysis of endogenous 3′-end regions (Figure 1A). They were also largely consistent with previous mutagenesis studies (McDevitt et al., 1986; Gil and Proudfoot, 1987; Heath et al., 1990; Chen et al., 1995), but more quantitative, at single-nucleotide resolution, and less prone to sequence-specific effects.
To examine the possibility that RNA structure influences the efficiency of 3′-end processing, we computationally folded the sequences between the PAS and poly(A) sites in these artificial 3′-end regions using RNAfold (Lorenz et al., 2011). Compared to transcripts that were of identical length but not cleaved at the query poly(A) site, cleaved transcripts had lower predicted ensemble free energy (ΔG) when the PAS–poly(A) site distance exceeded 27 nt, which suggested that RNA structures facilitated processing at poly(A) sites with distal PASs (Figure 1D). Interestingly, for transcripts with intermediate distances (17–27), the opposite was observed, implying that structure was slightly disfavored at these distances (Figure 1D), which can be explained by the inefficiency of processing when the PAS–poly(A) site distance was too short [stable structures from arbitrary sequences were likely longer than 14 nt and thus would have more frequently created effective distances too short for efficient processing, according our map of PAS distance constraints (Figure 1C)].
In summary, our analysis of >400,000 artificial 3′-end regions yielded a high-resolution map of the distance constraints on PASs and suggested that RNA structures facilitate the processing at poly(A) sites with distal PASs.
Predicted RNA Structures Are Enriched within Endogenous Regions that Have Distal PASs
To extend our analysis to endogenous mRNAs, we first reanalyzed existing 3P-seq [poly(A)-position profiling by sequencing] datasets from four human cell lines (Nam et al., 2014) to generate a set of 43,850 distinct endogenous 3′-end regions. These regions were then sorted and grouped by PAS–poly(A) site distance using a group size of 10 nt and a step of 1 nt, and then the predicted pairing probability of each of the 100 nucleotides upstream of the poly(A) site was averaged across regions in each group and visualized on a heat map (Figure 2A). A diagonal region of low pairing probability transected the map at the positions of the PASs. A striking difference was observed on each side of this diagonal, with PAS-downstream regions (top right) predicted to be more folded than PAS-upstream regions (bottom left). For regions with PAS–poly(A) site distances between 25–60 nt, two stretches of roughly equally sized folded areas (blue) were visible, presumably corresponding to the two sides of a folded stem.
Figure 2. Predicted Structures Are Enriched at Endogenous 3′-End Regions with Distal PASs.

(A) Differences in pairing probabilities upstream and downstream of endogenous mRNA PASs. Each row of the heat map shows the mean probabilities (color-coded according to the key) predicted for the group of 3′ ends with similar PAS–poly(A) site distance (10-nt sliding window, 1-nt step), and each column shows the mean probabilities at the indicated position relative to the poly(A) site (position 0).
(B) Differences in predicted folding stability observed between PAS-downstream sequences and shuffled sequences (red), and between length-matched PAS-upstream sequences and shuffled sequences (black), plotted with respect to PAS–poly(A) distance. The 3′-end regions were grouped by PAS–poly(A) site distance as in (A). Each color depicts the overlay of 1,000 lines, with each line showing the result of one random shuffling. The increased fluctuation observed at larger distances reflects the fewer regions with larger distances.
(C) The fraction of PAS-downstream regions (red) and PAS-upstream regions (black) predicted to be significantly more stably folded (P <0.05) than shuffled control sequences, plotted as a function of PAS–poly(A) distance. The 3′-end regions were grouped by PAS–poly(A) site distance as in (A).
To check whether the increased propensity of PAS-downstream regions to fold was simply due to differing nucleotide compositions, we shuffled the PAS-downstream sequences while preserving dinucleotide frequency (Jiang et al., 2008) and subtracted the average predicted ΔG of the shuffled sequences from that of the actual sequences. For regions with PAS–poly(A) site distances ranging from 20–29 to 80–89 nt, the PAS-downstream sequences tended to have more stable predicted structures than their shuffled control sequences (Figure 2B, red). In contrast, length-matched PAS-upstream sequences were not predicted to be significantly more stable than their shuffled control sequences (Figure 2B, black). Using predicted ΔG values from 1,000 shuffled control sequences as a null distribution for each region, we calculated P values and found that the fraction of PAS-downstream regions with stable predicted structures (P <0.05) was higher than expected by chance, whereas the fraction of PAS-upstream regions with stable predicted structures was not (Figure 2C).
Like our results from artificial 3′-end regions, our analyses of endogenous 3′-end regions strongly suggested that RNA structures facilitate the processing at poly(A) sites with distal PASs. Of the 14,771 genes represented by our 43,850 poly(A) sites, 5,197 (or 35%) had at least one poly(A) site with a distal PAS (>27 nt upstream) and thus are potentially under the influence of RNA structure.
A Global Map of In Vivo Structures at the 3′ Ends of Polyadenylated RNAs
To learn if the structures predicted to form between PASs and poly(A) sites are folded in vivo, we initially examined structural probing data acquired from human cells, in which intracellular dimethyl-sulfate (DMS) accessibility was detected by high-throughput sequencing of reverse transcriptase (RT) stops (Rouskin et al., 2014). However, the DMS-seq reads corresponding to RT stops near the poly(A) tail were often too short to map uniquely, resulting in a highly skewed distribution of reads near the poly(A) sites, which prevented accurate normalization and comparison.
To develop a method more suitable for examining folding in mRNA 3′-end regions, we combined features of DMS-seq with those of a method for profiling 3′ ends called poly(A)-primed sequencing or 2P-seq (Spies et al., 2013). In this hybrid method, we treated the cells with DMS, isolated polyadenylated RNA, fragmented this RNA by partial digestion with Ribonuclease T1 (which cuts after G), purified fragments with a poly(A) tail, reverse transcribed these fragments using a primer that pairs to the beginning of poly(A) tails, and then sequenced the cDNA (Figure 3A). Key to this protocol was the substitution of the retroviral RT originally used for DMS-seq with an RT from a group II self-splicing intron (TGIRT) (Mohr et al., 2013). TGIRT reads through the DMS-modified A and C template bases, inserting mismatches in the corresponding cDNA residues, thereby offering an approach for mapping DMS modifications using full-length RT products (Zubradt et al., 2017), which unlike RT-stop products, were suitable for examining 3′-end regions. We call this hybrid assay DIM-2P-seq (DMS-induced mutations mapped by 2P-seq).
Figure 3. Global In Vivo Probing of RNA 3′-End Structures.

(A) Schematic of DIM-2P-seq, a method for intracellular probing of RNA structure within 3′-end regions of polyadenylated transcripts. See text for details.
(B) Probing results for the last 100 nt of RPS5 mRNA. The DIM-2P-seq mutation frequencies, which represent intracellular DMS accessibility of A and C residues, are plotted in the bar graph and color-coded on the predicted secondary structure, according to the key. DIM-2P-seq coverage for this region was >70,000 reads. The nucleotides immediately upstream and downstream of the AAUAAA PAS motif are numbered −1 and +1, respectively.
(C) Differences in intracellular structure-probing results upstream and downstream of endogenous mRNA PASs. The heat map was generated as in Figure 2A, except the values represent the mean DIM-2P-seq mutation frequencies at A and C residues. See also Figure S1.
Consistent with known DMS specificity (Rouskin et al., 2014; Zubradt et al., 2017), mutation frequencies for A and C in the DMS-treated sample (4.3% and 2.9%, respectively) were much higher than those in a control sample (~0.6%), prepared in the same way but without adding DMS to the cells, whereas mutation frequencies for G and T were at background levels in both samples (Figure S1A). At a minimum coverage of 100 reads per sample, we quantified the mutation frequency for 0.9 million A or C bases shared between treated and control samples, which provided folding information for the 3′-end regions of RNAs from most of the genes expressed in HEK293T cells.
Results for the last 100 nt of the Ribosomal Protein S5 (RPS5) mRNA illustrate the information that DIM-2P-seq provided. For this mRNA, cleavage and polyadenylation nearly always occurs 28–30 nt downstream of a highly conserved PAS (Nam et al., 2014), which would lead to very poor processing unless rescued by RNA folding (Figure 1C–D). Indeed, a structure was predicted to form starting 2 nt downstream of the PAS (Figure 3B), although if fully folded, this structure would lead to an effective PAS–poly(A) site distance of only 6 nt, which would be too short for processing (Figure 1C). Indeed, our probing results indicated that only the distal part of this predicted structure (positions 6–21, shaded in gray) was folded in cells, as shown by the depletion of mutations at the As and Cs predicted to be paired in this region and the presence of mutations in flanking As and Cs (Figure 3B). Folding of this region spanning positions 6–21 would yield an effective distance of 16 nt, which would be optimal for processing (Figure 1C). Consistent with a role of the structure in facilitating processing, mutations predicted to destabilize the structure caused a decrease in usage, and compensatory mutations predicted to restore folding stability rescued usage (Figure S1B–C).
In contrast to the A and C bases within this folded segment 6–21 nt downstream of the RPS5 PAS, A and C bases upstream of the PAS, including many predicted to be paired, were extensively modified (Figure 3B). For example, among the As and Cs predicted to be paired, those in the PAS-upstream region were on average 8.5-fold more modified by DMS than were those in the PAS-downstream shaded region (1.61% and 0.19%, respectively, P = 0.0002, one-sided Kolmogorov–Smirnov test), which indicated that they were less folded in vivo. To see if this difference between intracellular folding observed upstream and downstream of the RPS5 PAS occurred more generally, we generated a heat map with the same coordinates as those of Figure 2A but summarizing in vivo DMS accessibility, as measured by positional mutation frequency. This map indicated that regions downstream of PASs were more folded than those upstream of PASs (Figure 3C). Indeed, this DMS-accessibility map had a remarkable resemblance with that of predicted structure (Figure 2A). One difference between the two was the more uniform signal observed between the PAS region (diagonal) and PAS-upstream region (bottom left) in the in vivo DMS-accessibility map (Figure 3C) compared to the more distinct signal observed for the PAS diagonal in the predicted-pairing map (Figure 2A). This difference between the maps was consistent with intracellular unfolding of structures in PAS-upstream regions, as observed for the RPS5 mRNA (Figure 3B).
These probing results provided a means to estimate the extent to which mRNA 3′-end regions with distal PASs (>27 nt) were folded in cells. The average DMS-induced mutation rate was 2.7% for PAS-downstream regions, 3.1% for PAS-upstream regions, and 3.7% for PAS regions. Assuming the mutation rate for completely unpaired nucleotides was that of the PAS regions (3.7%) and the mutation rate for completely paired nucleotides was 0%, then the percent of paired As and Cs in PAS-downstream regions would have been 27% (1 − (2.7/3.7)). When considering that paired nucleotides typically account for about half of the nucleotides of an RNA structure (with the other half residing in loops and joining regions), we estimate that ~54% of the nucleotides in regions downstream of a distal PAS were within structures that were folded in cells. When considering that single-stranded segments that help span the PAS–poly(A) site distance (such as the segments at positions 1–5 and 22–30 of the RPS5 3′ end) would have accounted for much of the remaining 46%, we conclude that for most of 3′-end regions with a distal PAS, folding occurred within cells. In contrast, only ~32% ((1 − (3.1/3.7))/0.5) of the nucleotides in PAS-upstream regions were within structures that were folded in cells, consistent with substantial intracellular unfolding of mRNA structures in these upstream regions.
These estimates would have been inflated if protein binding contributed to the protection observed within PAS-downstream or -upstream regions, whereas they would have been dampened if protein binding or RNA structure protected some of the PAS regions. We also note that RNA structure need not have been uniform to contribute to the protection signal; partial protection of an A or C paired in only half of the mRNAs or during only half of the DMS incubation would have contributed proportionally. Nonetheless, the estimate of 54% would represent the overall fraction of nucleotides within 3′-end regions that fell within RNA structures at any moment.
In summary, our global intracellular probing results indicated that segments within 3′-end regions that spanned PASs and poly(A) sites were often folded in vivo despite the tendency of structures elsewhere in mRNAs to be less folded. These results motivated experiments to explore functional ramifications for the folding of this privileged mRNA region.
Causality between RNA Folding and Poly(A)-Site Usage
To establish causality and further quantify the effect of folding on the processing at poly(A) sites, we performed a high-throughput analysis of many variants of a highly conserved predicted stem-loop in the 3′-end region of Centromere Protein B (CENPB) mRNA. The 3′-end processing of this abundant mRNA occurs 43 nt downstream of the AAUAAA motif yet is highly precise and efficient, as 3P-seq detects no other poly(A) sites between this poly(A) site and the downstream gene (Figure 4A). This high processing efficiency despite such an extended PAS–poly(A) site distance is presumably facilitated by a 29-nt stem-loop predicted to reduced the effective distance to 16 nt (assuming the stem-loop contributed 2 nt). The predicted stem-loop appears to have been conserved across 62 sequenced mammalian genomes, with 3 of its 11 base pairs undergoing covariation that maintained pairing (Figure 4A).
Figure 4. Causality between RNA Folding and Poly(A)-Site Usage.

(A) A conserved stem-loop within the CENPB 3′-end region. Genome-browser tracks (top) show 3P-seq signal in HEK293T cells, RefSeq gene annotations, and mammalian PhastCons conservation scores. The secondary structure (bottom) shows the predicted fold of the CENPB segment spanning the PAS and the poly(A) site. Positions with multiple covariations supporting pairing among the aligned mammalian genomes are highlighted, with alternative pairs and their frequencies listed (green).
(B) Schematic of an experiment resembling that of Figure 1B, which simultaneously measured the processing efficiency of many CENPB 3′-end variants encoded by a library of plasmids. See also Figure S2.
(C) The relationship between usage and predicted folding stability (−ΔG) for CENPB 3′-end variants. Plotted are results for all variants with ≥20 reads supporting cleavage at the β-globin poly(A) site in HEK293T cells.
(D) The effect of single-nucleotide substitutions on poly(A)-site usage, depicted as a sequence logo. The height of each base was scaled by its usage relative to wild type, and bases were stacked, placing the substitutions with stronger effects closer to the x-axis. The sequence and secondary structure (bracket notation) are shown above. The logo plot was generated by kpLogo (Wu and Bartel, 2017).
(E) Example of a mutant–rescue pair. Shown are the predicted secondary structure, predicted ΔG of folding, and relative usage for the wild type, mutant (G27C), and compensatory mutant (G27C+C7G).
(F) The relative usage for all 48 mutant–compensatory-mutant pairs (left) and all 96 mutant–noncompensatory-mutant pairs (right) in the library. Pairs with usage values inconsistent with rescue are highlighted (red). Shown at the top are the ratios of rescueinconsistent: rescue-consistent pairs, as well as the P value for observing at least this number of rescue-consistent pairs, estimated from 106 shufflings of the usage measurements.
To generate a set of variants suitable for functional analysis, we inserted the 3′-end region of the CENPB gene into our expression vector and constructed a library in which each position of the 29-nt stem-loop was mutated at a rate of 6% (94% wild type and 2% for each of three possible mutations) (Figure 4B). This library included over 30,000 variants, with mostly 1–3 mutations, including all single-nucleotide substitutions and most of the double-nucleotide substitutions. We expressed the variants in HEK293T cells and quantified the relative usage of each variant by sequencing, first normalizing to usage of the downstream β-globin poly(A) site (to control for variation in plasmid copy number, transfection efficiency, and transcription activity) and then normalizing to that of the wild type sequence. The sequencing-based measurement was validated by individually transfecting 11 randomly selected variants and quantifying their usage by quantification of RT-PCR products (Figure S2A–C, Spearman’s rank correlation coefficient (rs) = 0.78, Pearson’s correlation coefficient (rp) = 0.96). Moreover, when repeating the sequencing-based experiment in HeLa cells, poly(A) variant usage highly correlated with that observed in HEK293T cells (Figure S2D, rs = 0.92, n = 30,432).
Having confirmed the accuracy and robustness of our measurements, we examined the relationship between variant usage and folding potential. A strong correlation between poly(A)-site usage and predicted folding stability (−ΔG) was observed (rs = 0.76, Figure 4C), indicating that RNA folding is critical for CENPB poly(A)-site usage. The strong relationship across >100-fold differences in usage suggested that RNA folding can both tune and turn on or off usage of a poly(A) site, although usage of the wild type CENPB 3′-end region (Figure 4C, red point) approached the value at which the effect of folding started to saturate.
All single-substitution variants were well represented in the library (median >18,000 reads), and most of these substitutions, especially those predicted to be involved in Watson–Crick base-pairing, led to decreased relative usage (Figure 4D). The strongest effect was a G-to-C mutation at position 27 (G27C), which resulted in a 5.7-fold decrease in usage (Figure 4D). In contrast, single-nucleotide substitutions in the loop or in wobble or mismatched pairs had less effect, with slight increases in usage for changes predicted to stabilize the structure, including mutations in the first base-pair that converted the G–U wobble to a C–G or U–A base-pair, and mutations that converted the internal C–A mismatch to a U–A or C–G base-pair (Figure 4D).
Causality between an RNA structure and a function is conventionally shown using a pair of experiments in which the loss of function caused by a mutation disrupting a Watson–Crick base pair is rescued by a compensatory mutation at the complementary position that restores the Watson–Crick pair. Indeed, the strong decrease in usage observed for the G27C substitution was rescued by a compensatory mutation at the complementary position (C7G) (Figure 4E). Extending this type of analysis to each of the 48 possible mutation–compensatory-mutation pairs involving the 8 Watson–Crick base pairs of the wild type structure (not counting the isolated C–G base pair near the loop) showed that 46 supported the hypothesis that Watson–Crick pairing increased the efficiency of poly(A)-site usage, i.e. the mutant was less efficiently processed than both the wild type and the compensatory mutant (Figure 4F left). For each of the two exceptions (C11U and C13U), the disruptive mutations changed C–G pairs to U–G wobbles, which had slightly greater processing efficiency than the compensatory A–U pairs (Figure 4F left, red). Nevertheless, the importance of pairing at positions 11 and 13 was supported by each of the other 10 mutation–compensatory-mutation combinations informative for these two pairs. Moreover, the 96 noncompensating mutations at the same complementary positions (two for each single-nucleotide mutant) did not rescue the decreased usage more frequently than expected by chance (Figure 4F right, P = 0.22), which showed that rescue was specific to the possibilities that restored pairing. Thus, our saturating mutation–rescue analysis confirmed a causal role for RNA structure in enhancing poly(A)-site usage.
Folding of mRNA from a Native Locus Influences Expression of a Downstream Gene
To assess the effect of folding on the processing of endogenous transcripts produced from their native genomic locus, we used Cas9 (Cong et al., 2013) to generate a large library of mutations within the stem-loop structure in the CENPB 3′-end region, exemplified by the 10 most abundant mutants (Figure 5A). We then sequenced both genomic DNA and mRNA from the targeted locus, and quantified the usage of each mutant as the ratio of its RNA:DNA reads normalized to that of wild type. Imposing a cut-off of ≥100 DNA reads and ≥2 RNA reads, we were able to quantify the usage of 673 unique mutants, 568 of which had PAS–poly(A) site distances >27 nt. As observed in our experimental examination of ectopically expressed mRNAs (Figures 1 and 4), the accumulation of mRNAs endogenously expressed from these genomic mutants strongly correlated with predicted 3′-end folding (Figure 5B, rs = 0.78, P <10−116). These results indicated that 3′-end folding facilitates 3′-end processing of mRNAs endogenously expressed from their native genomic locus.
Figure 5. The Functional Roles of Endogenous CENPB 3′-End Structure.

(A) The 10 most frequently sequenced CENPB variants generated by Cas9. The wild-type sequence and the predicted structure (bracket notation) are also shown (bottom), with the expected Cas9 cut site (red vertical line).
(B) The relationship between relative usage (defined as the ratio of RNA:DNA reads normalized to that of wild type) and predicted RNA folding stability for Cas9-induced mutants. Shown are results for mutants with ≥100 DNA reads, ≥2 RNA reads, and PAS–poly(A) site distances >27 nt.
(C) Relationship between usage and PAS–poly(A) site distance for all variants with ≥100 DNA reads and ≥2 RNA reads. See also Figure S3.
(D) Effects of mutating the CENPB 3′-end region on the expression of CENPB and SPEF1. Shown are expression values for the mutagenized cells relative to those of wild type cells after mutagenesis for the indicated number of days. Expression was determined using RT-qPCR, normalizing to results for GAPDH. Error bars indicate standard deviation based on three technical replicates. The positions of the primer pairs relative to the gene models are shown below the graph. See also Figure S4.
In addition to altering the predicted 3′-end structure, the Cas9-induced deletions shortened the distance between the PAS and poly(A) site (Figure 5A). However, the beneficial effect of this shortening was not apparent until the PAS–poly(A) site distances were reduced to less than ~28 nt (Figure 5C). Presumably the detrimental structural consequences of the more moderate deletions offset the favorable effects of these deletions on the PAS–poly(A) site distance. Interestingly, several mutants for which the deletion removed most of the stem-loop and created PAS–poly(A) site distances of about 15 nt were processed with efficiencies resembling or exceeding that of wild type (Figure 5C). Likewise, for all three genes tested with our expression plasmid (RPS5, CENPB, and TFE3), higher usage was observed for mutants in which the entire stem-loop was deleted from the 3′-end region (Figures S1B–C and S3). Although consistent with the model in which the stem-loop structures merely function to reduce effective distance, these results raised the question as to why the stem-loop structures have not been deleted over the course of evolution to achieve the most efficient usage. One potential advantage of the structures is that they provide an opportunity for regulation through factors or conditions that influence stem-loop folding.
With regard to the potential regulatory role of the conserved CENPB 3′-end folding, we noted that there was no other poly(A) site before the downstream gene, Sperm Flagellar 1 (SPEF1) (Figure 4A), suggesting that failure to utilize the CENPB poly(A) site would lead to read-through transcription that might influence the expression of SPEF1, whose transcription start site is only 2.3 kb downstream of the CENPB poly(A) site. Indeed, in the population for which the CENPB 3′ end was targeted for Cas9-mediated mutation, CENPB mRNA decreased by 29–37%, while SPEF1 mRNA increased by 29–73% (Figure 5D). Notably, transcripts across the transcription start site of SPEF1 increased nearly 8 fold (Figure 5D), consistent with read-through transcription from CENPB caused by mutation of its 3′-end region. Moreover, when examining RNA-seq data from mouse 3T3 cells undergoing heat shock (Shalgi et al., 2014), we observed substantially reduced Cenpb expression with concomitantly increased reads corresponding to both the intergenic region and the Spef1 mRNA (Figure S4A), suggesting that elevated temperature might unfold the Cenpb stem-loop during transcription, leading to increased read-through to the downstream Spef1 gene.
To directly investigate the influence of CENPB transcription on SPEF1 mRNA level, we used CRISPR interference (CRISPRi) to inhibit the transcription of CENPB in a K562 cell line expressing a dCas9-KRAB fusion protein (Gilbert et al., 2014). Compared to a control guide RNA with no effect on CENPB mRNA level, a guide RNA with 80% knockdown of CENPB mRNA led to a 2.4-fold decrease in read-through transcription across CENPB poly(A) site, a 10-fold decrease of transcription activity across SPEF1 transcription start site, and a 2.5-fold decrease in spliced SPEF1 mRNA, confirming a direct and positive role of CENPB transcription in SPEF1 expression (Figure S4B–C). Consistent with such an influence on neighboring gene expression and the reported role of Spef1 in spermatogenesis (Chan et al., 2005), Cenpb null mice have decreased sperm content (Hudson et al., 1998).
PAS–Poly(A) Site Distance and 3′-End Structure Correlate with RNA Stability
Thus far, we and others have attributed changed accumulation of mRNAs with altered 3′-end regions to changes in 3′-end processing efficiency. However, differential stability of the processed product would also contribute to its changed accumulation. To explore this possibility, we performed 2P-seq on both steady-state HEK293T RNA and nascent RNAs captured after metabolic labeling with 4-thio-uridine (4sU) for either 30 or 60 minutes (Figure S5A). Using the ratio of the abundance between steady-state and newly transcribed RNA as a measure of RNA stability, we found that mRNAs with longer PAS–poly(A) site distance tended to be less stable, with an overall effect size of about 2-fold observed between mRNAs with short and long PAS–poly(A) site distance (Figure 6A).
Figure 6. RNA Folding Enhances mRNA Metabolic Stability.

(A) Relationship between mRNA stability and PAS–poly(A) site distance. The 3′-end regions of endogenous mRNAs were grouped by PAS–poly(A) site distance as in Figure 2A, and for each group, metabolic stability was calculated as the number of reads from the steady-state RNA divided by the number of reads from nascent RNA isolated after labeling with 4sU for 30 minutes.
(B) Relative usage of CENPB variants, comparing values generated using steady-state RNA (which were prone to be influenced by differences in mRNA stability) with those generated using nascent RNA (which were less prone to be influenced by differences in mRNA stability). Nascent RNA was isolated after labeling with 4sU for 30 minutes. Results are plotted for all variants with ≥20 reads from the β-globin poly(A) site in each sample. The slope of the linear fit through the origin (black line; slope shown ± s.e.) differed from that of equal usage (red line, y = x; origin, red point).
(C) Relationship between relative metabolic stability and predicted folding stability for abundant CENPB variants. Metabolic stability was measured as in panel (A) and is plotted relative to that of the wild type for all variants with ≥1,000 reads from the β-globin poly(A) site in at least one sample. The correlation decreased when using less stringent read cutoffs, which was entirely attributable to increased noise in stability measurements (Figure S5D–F).
(D) The relative metabolic stability of all 48 mutant–compensatory-mutant pairs (left) and all 96 mutant–noncompensatory-mutant pairs (right) in the library; otherwise as in Figure 4F.
(E) The relationship between nascent usage and predicted folding stability for CENPB 3′-end variants; otherwise as in Figure 4C.
See also Figure S5.
We next investigated whether folding between a distal PAS and its poly(A) site might rescue the decrease in RNA metabolic stability, similar to its role in rescuing 3′-end processing, turning to our CENPB poly(A)-site variants, which provided the opportunity to examine >30,000 variants that have the same PAS–poly(A) site distance yet different predicted folding stabilities. HEK293T cells expressing the library of CENPB variants were incubated with 4sU for 30 or 60 minutes, and the relative usage of the CENPB poly(A)-site variants in newly synthesized RNA containing 4sU was measured and compared to that observed at steady-state. Although the usage in nascent and steady-state RNA was highly correlated (rs = 0.92), the relative usage measurements for the sub-optimal poly(A) variants tended to be lower at steady-state, indicating that these sub-optimal variants had somewhat lower metabolic stability (Figure 6B and S5B–C). Using the difference in usage between steady state and nascent RNA as a measure of RNA metabolic stability, we observed a correlation between predicted folding stability and RNA metabolic stability (rs = 0.56, Figure 6C and Figure S5D–F), consistent with the hypothesis that that 3′-end folding enhances mRNA metabolic stability. To examine whether this relationship was indeed causal, we analyzed mutant–compensatory-mutant pairs as in Figure 4F. Although the results were not as consistent as those observed for relative usage, perhaps due to more experimental variability and smaller effect sizes for the metabolic stability measurements, the number of pairs that supported the role of structure was twice that of pairs that did not (Figure 6D left). This surplus of supporting mutant pairs was greater than expected by chance (P = 0.001), whereas the results observed for non-compensatory mutations did not differ from those expected by chance (Figure 6D right, P = 0.33). These analyses of mutant pairs thereby established a causal relationship between RNA structure and mRNA metabolic stability.
Compared to the large effects of 3′-end folding on relative usage (Figure 4), the effects of 3′-end folding on mRNA stability were small, with a <2-fold overall difference observed between the measurements for newly synthesized and steady-state RNA (Figure 6B–C). Indeed, repeating the analyses of Figure 4C but using the data for the newly synthesized mRNA instead of data for the steady-state mRNA did not change the conclusion that RNA folding caused increased processing efficiency (Figure 6E). Thus, when considered together, our results show that 3′-end folding of mRNAs with long PAS–poly(A) site distances influences both processing efficiency and mRNA stability, although its influence on processing efficiency is much stronger.
Structures with Predicted Stabilities Resembling those of Random Sequences Are Functional
A widespread role of RNA structures at mRNA 3′ ends seemed at odds with previous in silico analysis showing that mRNAs are no more likely than random sequences to be stably folded, a result typically interpreted as lack of functional structures (Workman and Krogh, 1999; Rivas and Eddy, 2000; Clote et al., 2005). In line with the previous analyses, the predicted folding stabilities of >80% of the 3′-end regions were not significantly different from shuffled sequences with the same dinucleotide composition (Figure 2C), yet many of these structures were folded in cells (Figure 3) and likely required for efficient mRNA 3′-end processing. One way to reconcile these results would be if structures with predicted stabilities close to those formed by random sequences of the same length and dinucleotide composition (hereafter called close-to-random structures) were allowed to fold and were functional in this privileged region of the mRNA.
To explore the possibility that close-to-random structures might be functional in 3′-end regions, we revisited our results with the CENPB 3′-end variants. In an analysis modeled after that which we performed for endogenous sequences (Figure 2C), the usage for each variant was plotted as a function of the probability that its predicted folding was less stable than a shuffled control sequence (Figure 7A). Interestingly, in this analysis, the wild type CENPB 3′-end structure, which clearly controls CENPB mRNA 3′-end processing (Figure 4 and 5), was not significantly more structured than its shuffled control sequences (P = 0.061, Figure 7A, red dot), Indeed, the same was true for most (89.1%) of the 32,395 CENPB variants (Figure 7A). Moreover, although overall folding significance (P value) correlated with usage (rs = 0.76), the correlation was stronger for variants without statistically significant predicted folding (i.e., P ≥0.05, rs = 0.71), compared to variants with statistically significant predicted folding (i.e., P <0.05, rs = 0.47) (Figure 7A). Even for the 7,645 variants with predicted structures less stable than those of most shuffled control sequences (i.e., P >0.5), predicted folding stability still strongly correlated with usage (rs = 0.52, P = 0) (Figure 7B). Similar analysis of our data from the endogenous CENPB mutants yielded analogous results (Figure S6, rs = 0.48, P <10−13).
Figure 7. Structures with Predicted Stabilities Resembling Those of Random sequences Are Functional.

(A) The relationship between site usage and folding significance (P value) for CENPB variants in HEK293T cells. The result for the wild type is highlighted (red). Also shown are the number of variants (n) passing the cutoff for analysis [≥20 reads from β-globin poly(A) site], the percent of variants with P <0.05 and P ≥0.05 (right and left of blue line, respectively), and correlation coefficients for the relationship between usage and P value for these two subsets of variants.
(B) Relationship between usage and predicted folding stability for variants with structures predicted to be less stable than those of most random sequences (P >0.5).
(C) The presence and function of structure in the TFE3 3′-end region. Probing results are displayed on the predicted secondary structure of the PAS-downstream sequence, as in Figure 3B. DIM-2P-seq coverage for this region was >700 reads. Shown at the bottom are the relative usages of a mutant–compensatory-mutant pair, as determined using agarose-gel electrophoresis to resolve RT-PCR products (usage values, normalized to that of wild type, shown below gel).
(D) The presence and function of structure in the ILVBL 3′-end region. DIM-2P-seq coverage for this region was >3,000 reads. Otherwise, this panel is as in (C).
See also Figure S6.
To test if close-to-random structures can affect 3′-end processing of other mRNAs, we investigated the 3′-end regions of Transcription Factor E3 (TFE3) and IlvB Acetolactate Synthase Like (ILVBL) mRNAs, for which cleavage occurred predominantly 35 and 28 nt after the PAS, respectively. Compared to the stem-loop structure in CENPB, the predicted structures formed by the PAS–poly(A) site intervening sequences of these two mRNAs were predicted to be much weaker (predicted ΔG = −8.5 and −7.4 kcal/mol, respectively) and even closer to those predicted for shuffled controls (P = 0.30 and 0.20, respectively). Nonetheless, our DMS probing results supported the in vivo folding of the distal stem-loop of each of these predicted structures (Figure 7C–D, gray shading). As in the 3′-end region of RPS5, the more proximal regions of the predicted structures were unfolded, as required to generate a PAS–poly(A) site distance suitable for efficient processing. When cloned into our GFP construct and expressed in HEK293T cells, a single substitution (G9C) that disrupted the TFE3 stem-loop led to a nearly 2-fold drop in usage, which was rescued by its compensatory mutation (C19G) (Figure 7C). Likewise, a single substitution (G10C) disrupting the ILVBL stem-loop led to a 2-fold decrease in usage and was rescued by its compensatory mutation (Figure 7D). These results demonstrated that the close-to-random structures were functional in each of the genes we tested.
DISCUSSION
We have combined transcriptome-wide RNA-structure prediction, global intracellular structure probing, combinatorial mutagenesis, genome editing, metabolic labeling, and high-throughput assays of processing efficiency to uncover a widespread and causal role of RNA structures in both mRNA 3′-end processing and metabolic stability. We show that the ability of RNA structures to juxtapose PAS and poly(A) sites, which enables the 3′-end processing of a viral mRNA (Ahmed et al., 1991), also facilitates the processing of thousands of human mRNAs. More generally, we have made several unexpected observations that challenge the prevailing view of the physiological relevance of structures in mammalian mRNAs.
One unexpected result was the prevalence of functional RNA structures in human mRNAs despite the global tendency of mRNAs to be less folded in eukaryotic cells than they are in vitro (Ding et al., 2014; Rouskin et al., 2014; Spitale et al., 2015; Guo and Bartel, 2016). Poly(A) sites in thousands of human genes contain a distal PAS and likely depend on RNA structures for efficient processing. Helping to reconcile our findings with the previously reported global tendencies was the unique location of the structures we observed. For technical reasons, structures at the very 3′ ends of mRNAs are missed by established probing assays, but with a redesigned probing assay, we showed that these 3′-end structures were present in vivo despite more prevalent unfolding of structures elsewhere. Their unique location also allows these structures to directly affect an important step of gene expression, i.e., 3′-end formation.
Another unexpected finding was that these 3′-end structures also confer mRNA metabolic stability. PAS–poly(A) site distance also negatively affected RNA stability, raising the possibility that RNA structures enhance 3′-end processing and RNA stability using the same mechanism, i.e., by bringing PAS and poly(A) sites closer together in space. How might PAS–poly(A) site distance influence transcript stability? We speculate that the mechanism involves cytoplasmic poly(A)-binding proteins (PABPCs), including PABPC1. PABPC1 binds cooperatively to poly(A) tails and is a key player in mRNA stability (Mangus et al., 2003). Recent crosslinking results show that PABPC1 also directly binds to PASs of thousands of mRNAs in mouse cells (Kini et al., 2016). Given the proximity between PASs and poly(A) tails and the ability of PABPC1 to oligomerize (Melo et al., 2003), PAS-bound PABPC1 might interact with PABPC1 on the poly(A) tail, in which case the frequency or stability of the interaction would decrease with longer PAS–poly(A) site distance. Folding within the region spanning the PAS and poly(A) site would reduce this distance and thereby favor the interaction, which would enhance binding of PABPC1 to mRNA, thereby enhancing mRNA stability. Another possibility is that one of the four RNA-recognition motifs (RRMs) of PABPC1 has higher affinity to the PAS region than it does to the poly(A) tail but other RRMs preferentially bind the tail, and thus a short effective distance between the PAS and tail would favor optimal binding of one molecule to both the PAS and the tail. Importantly, both of these PABPC1-binding scenarios would loop out intervening sequences, which would not only promote folding of these sequences but might also insulate these structures from cellular activities that unfold structures upstream of the PAS.
A third unexpected finding was that many structures at the 3′ ends of mRNAs were functional despite residing in mRNA regions with predicted stabilities resembling those of random sequences. These results were in line with the observations (but not the interpretations) of previous computational analyses showing that mRNAs or UTRs as a whole are not more stably folded than random sequences (Workman and Krogh, 1999; Clote et al., 2005). Part of the reason that extended 3′-end regions with functional structures have predicted folding stabilities resembling those of random sequences is that these 3′-end regions typically require both structured and unstructured subregions to achieve the proper PAS–poly(A) site distance, and the instability of the unstructured segments helps offset the stability of the structured ones, making the overall stability more closely resemble that of random sequences. In addition, these close-to-random yet functional structures presumably have more relaxed conformational constraints compared to structures of rRNAs, tRNAs, and some other ncRNAs. These ncRNAs must specifically interact with other factors, which presumably drives the formation of highly unique and stable structures that statistically differ from those of random sequences. In contrast, to reduce effective distance, the precise shape or location of the fold would be less consequential. The same would be true for other possible functions of structure within mRNAs, such as burying cis elements, slowing ribosomes, or reducing exposure to ribonucleases.
The discovery that RNA structures are allowed to form at the 3′ ends of many mammalian mRNAs and promote 3′-end processing and metabolic stability illustrates the utility of hypothesis-driven approaches for identifying functional RNA structures, which enable identification of even weak or transient structures by using a direct readout of the proposed function. Perhaps similar approaches, especially when combined with in vivo structure probing and massively parallel mutagenesis and reporter assays, will uncover additional molecular, cellular, or physiological contexts in which structures are frequently allowed to form within mammalian mRNAs and exert influence on other important processes, such as splicing, editing, export, translation, and degradation.
STAR★METHODS
CONTACT FOR REAGENT AND RESOURCE SHARING
Further information and requests for resources and reagents should be directed to and will be fulfilled by the Lead Contact, David Bartel (dbartel@wi.mit.edu).
EXPERIMENTAL MODEL AND SUBJECT DETAILS
HEK293T and HeLa cells were cultured in DMEM (VWR) with 10% FBS (Clonetech). K562 cells were cultured in RPMI-1640 media (Life Technologies) with 10% FBS. All cells were cultured at 37 °C with 5% CO2. Each of these cell lines was of female origin.
METHOD DETAILS
Computational analysis of endogenous poly(A) sites
Mapped 3P-seq reads from four human cell lines (HeLa, HEK293T, Huh7, and IMR90) were pooled. Reads with 3′-end distances within 8 nt of each other on the same strand were clustered together as representing a single poly(A) site using the sub-command cluster in bedtools v2.23.0 (Quinlan and Hall, 2010) with the options –s –d 8, and the 3′ end with the most reads was chosen to represent the site. In the case of a tie, the 3′ end with the smallest genomic coordinate was chosen to represent the site. Sites supported by only one read, or mapping to the mitochondrial genome, or without any AAUAAA or AUUAAA within 100 nt upstream of the poly(A) site were discarded. For sites with multiple AAUAAA or AUUAAA upstream matches, the PAS closest to 16 nt upstream of the site was used. To avoid ambiguity in PAS assignment, sites with any of the following alternative PAS variants within 10–30 nt from poly(A) sites were discarded: AGUAAA, UAUAAA, CAUAAA, AAUACA, GAUAAA, AAUAUA, AAUAGA, ACUAAA, AAUGAA, AUUAUA, AUUACA, AAUAAU, UUUAAA, AAUAAG, CUUAAA, AAUAAC, GUUAAA, AUUAGA, AACAAA, AUUGAA, AAGAAA, AUUAAC.
RNA structure analysis
All RNA structures were predicted using RNAfold in the ViennaRNA Package (Lorenz et al., 2011). The ensemble free energy (ΔG) for each structure was calculated using the option -p0 --noPS. For calculating pairing probability, -p was used instead of -p0. Significance of predicted folding stability was assessed by shuffling the original sequence 10,000 times while preserving dinucleotide frequency (Jiang et al., 2008), computing the fold and ΔG for each shuffled sequence, and then designating the empirical P value as the fraction of shuffled sequences with the same or lower predicted ΔG. Covariations in the CENPB 3′-end structure were detected by RNAalifold (Lorenz et al., 2011), using a multiple sequence alignment of 62 mammalian species downloaded from UCSC Table browser (Tyner et al., 2016).
3′-end region libraries
Oligonucleotides used to construct and analyze these libraries were purchased from IDT and are listed in the corresponding sections of Table S1. A 254-bp region surrounding the CENPB poly(A) site was amplified from HEK293T genomic DNA and inserted after the GFP stop codon in the plasmid pCMV-GFP. The resultant plasmid, pCMV-GFP-CENPBpA, was used as the basis for generating the two libraries. For the library with random sequences of variable length (pCMV-GFP-CENPBpA-variable-length), the sequences between the PAS and the poly(A) site, excluding the first two and last two nucleotides, were replaced with random sequences with lengths from 1 to 37 nt. This was done with the Q5 Site-Directed Mutagenesis Kit (NEB) and 37 mutagenesis primers (Table S1) mixed at an equal molar ratio. For the library with mutagenized sequences of identical length (pCMV-GFP-CENPBpA-fixed-length), an oligonucleotide pool was synthesized that was designed to template substitutions at each position of the 29-nt stem-loop at a 6% rate (each of the 29 positions having a 94% chance of remaining wild type and a 2% chance of changing to each of the three other possibilities). The single-stranded oligo template was converted to double-stranded DNA using 7 cycles of PCR with Phusion High-Fidelity DNA Polymerase (NEB) and then used as mega-primer to mutagenize the template pCMV-GFP-CENPBpA in an 18-cycle PCR reaction. After treatment with DpnI (NEB, 4 hours at 37°C), XL-10 gold cells (VWR) were transformed.
Analysis of variant usage
Oligonucleotides were purchased from IDT and are listed in Table S1. The plasmid variant library was transfected into HEK293T cells and HeLa cells with Lipofectamine 2000 (Life Technologies) following the manufacturer’s protocol (Plasmids and Lipofectamine 2000 reagent were each mixed with 37°C Opti-MEM, and the two mixtures were combined and incubated at room temperature for 5 minutes, then add to cells). One day after transfection, cells were harvested for total RNA isolation (RNeasy Mini Kit, Qiagen) and/or genomic DNA isolation (QIAamp DNA Mini Kit, Qiagen). RNA was reverse transcribed using SuperScript III (Life Technologies) and an anchor dT primer, as follows: 8.5 μL RNA, 0.5 μL 100 μM RT primer, and 1 μL 10 mM dNTP were mixed and incubated at 80°C for 5 minutes, then brought to 42°C. 10 μL SuperScript III mix (containing 4 μL 5X First-Strand Buffer, 1 μL 0.1 M DTT, 1 μL RNaseOUT, 1 μL SuperScript III RT, and 3 μL water) was added, and the reaction was incubate at 42°C for 15 minutes, 48°C for 15 minutes, 55°C for 15 minutes, and 80°C for 5 minutes. The RT products were amplified using Phusion HF (12–18 cycles) and a forward primer that hybridized upstream of the query region. Genomic DNA was amplified using the same forward primer and a reverse primer hybridizing downstream of the poly(A) site. PCR products were purified by agarose-gel electrophoresis and extraction (QIAquick Gel Extraction Kit, Qiagen) and submitted for Illumina sequencing. Sequencing reads with mutations outside the intended region were discarded. For each variant of a plasmid library, usage was calculated as the number of reads representing processing at the query site relative to the number representing processing at the downstream β-globin site, and results were considered for only those variants with ≥20 reads from the β-globin site. For each variant of the genomic library, usage was calculated as the number of RNA reads relative to the number of DNA reads, and results were considered for only those variants with ≥100 DNA reads and ≥2 RNA reads. A pseudocount of 1 was added to all raw read counts for calculating usage. To calculate relative usage, usage was normalized to that of the wild type sequence.
Analysis of variant metabolic stability
For each mRNA, the number of reads at steady state (which was a function of both the synthesis rate of the mRNA α and the decay rate of the mRNA β) was divided by the number of reads in the nascent sample that had been captured after 4sU metabolic labeling for either 30 or 60 minutes (which was primarily a function of α, with minimal contribution of β) to yield the relative metabolic stability. Similarly, for each CENPB variant, relative usage at steady state was divided by relative usage in the nascent sample, and then this ratio was normalized to that of wild type to yield the normalized metabolic stability. Although this approach for calculating relative metabolic stabilities did not capture complex kinetic behaviors (such as deviation from simple exponential decay attributable to either multiple phases of decay or different subpopulations of mRNAs from the same gene, each with different decay rates), for the mRNA from each gene (or from each CENPB variant), this approach did provide a single value that represented its overall behavior, effectively weighting the aggregate effects of different kinetic phases and different subpopulations in proportion to their relative contributions to steady-state abundance.
2P-seq, 4sU-2P-seq, and DIM-2P-seq
2P-seq was as described (Spies et al., 2013) with a few modifications. Briefly, poly(A)+ RNA was purified from 60 μg total RNA using 160 μL Oligo(dT)25 Dynabeads (Life Technologies). The eluted RNA was digested with 1 unit of RNase T1 (Life Technologies) for 20 minutes at room temperature, precipitated, and then poly(A) selected again. The RNA was eluted in 12.2 μL water, reverse transcribed using 1 μL RT primer (Table S1), 1 μL 10 mM dNTP, 4 μL 5X SuperScript First-Strand Buffer, 1 μL 0.1 M DTT, 0.2 μL SUPERase-In (Life Technologies), and 1 μL SuperScript III RT. The reaction was incubated at 48°C for 30 minutes and then the RNA was hydrolyzed by adding 2.3 μL 1 M NaOH and incubating at 98°C for 15 minutes. cDNAs were resolved on a 6% TBE-Urea Gel (Life Technologies), and those with lengths 150–500 nt were extracted and then circularized in a reaction containing 15 μL cDNA, 2 μL 10X CircLigase I Buffer, 1 μL 1 mM ATP, 1 μL 50 mM MnCl2, and 1 μL CircLigase I, at 60°C for 4 hours followed by 80°C for 10 minutes. Half of the circularized cDNA was used for 10–20 cycles of PCR amplification in which barcoded Illumina adaptors were added. PCR products between 200–600 bps were purified on agarose gels and submitted for Illumina sequencing.
For 4sU-2P-seq, nascent RNA was captured based on transcriptional incorporation of 4sU (Radle et al., 2013) as follows: Cells were incubated with 1000 μM 4sU for 30 or 60 minutes, washed once with cold PBS, and then total RNA was prepared using Trizol. The RNA was biotinylated by incubating with EZ-Link HPDP-Biotin (Thermo Fisher Scientific, 2 μg per μg RNA) in 10 mM Tris, pH7.4, 1 mM EDTA for 2 hours at room temperature. The biotinylated RNA was chloroform extracted twice, precipitated, and resuspended in water at a concentration of 1 μg/μL. The biotinylated RNA was captured using the μMACS Streptavidin Kit (Miltenyi Biotech) following the manufacturer’s protocol. Briefly, the RNA was denatured at 65°C for 10 minutes, chilled on ice, and then incubated with streptavidin beads (1 μL beads for <2 μg RNA) for 15 minutes with rotation. The RNA and beads were then loaded onto μMACS columns preequilibrated with wash buffer (100 mM Tris, pH 7.4, 10 mM EDTA, 1 M NaCl, 0.1% Tween 20). The column was then washed three times with 0.9 mL 65°C wash buffer, three times with 0.9 mL room-temperature wash buffer, and eluted twice with 100 μL 100 mM DTT. The RNA was purified and concentrated with the RNeasy MinElute Cleanup Kit (Qiagen), mixing the RNA with 700 μL RLT Buffer before loading it on the column and eluting it from the column in 25 μL water. Eluted RNA was subjected to 2P-seq, omitting the first poly(A) selection.
For DIM-2P-seq, total RNA was isolated from cells treated with 3.3% DMS for 5 minutes, and the library was prepared as in 2P-seq but replacing the SuperScript III RT with TGIRT and incubating the reverse transcription at 48°C for 15 minutes, then at 57°C for 2 hours. In total, 95 and 208 million mapped reads were obtained for the DMS-treated sample and the control sample, respectively. Step-by-step protocols for 2P-seq, 4sU-2P-seq, and DIM-2P-seq can be found at the link provided in the KEY RESOURCE TABLE.
KEY RESOURCES TABLE.
| REAGENT or RESOURCE | SOURCE | IDENTIFIER |
|---|---|---|
| Bacterial and Virus Strains | ||
| XL10-Gold Ultracompetent Cells | VWR | Cat#99900-018 |
| Biological Samples | ||
| DMEM | VWR | Cat#45000-304 |
| Opti-MEM | Thermo Fisher Scientific | Cat#31985062 |
| FBS | Clontech | Cat#631367 |
| RPMI-1640 | Life Technologies | Cat#22400105 |
| Chemicals, Peptides, and Recombinant Proteins | ||
| Dimethyl sulfate (DMS) | Sigma Aldrich | Cat#D186309 |
| 4-Thiouridine (4sU) | Sigma Aldrich | Cat#T4509 |
| Doxycycline | Clonetech | Cat#631311 |
| DpnI | NEB | Cat#R0176S |
| EZ-Link HPDP-Biotin | Thermo Fisher Scientific | Cat#PI21341 |
| SUPERase-In | Life Technologies | Cat#AM2696 |
| Critical Commercial Assays | ||
| RNeasy Mini Kit | QIAGEN | Cat#74104 |
| RNeasy MinElute Cleanup Kit | QIAGEN | Cat#74204 |
| QIAamp DNA Mini Kit | QIAGEN | Cat#51306 |
| QIAquick Gel Extraction Kit | QIAGEN | Cat#28104 |
| Oligo(dT)25 Dynabeads | Life Technologies | Cat#61002 |
| SuperScript III Reverse Transcriptase | Life Technologies | Cat#18080044 |
| Cell Line Nucleofector Kit V | Lonza | Cat#VCA-1003 |
| Lipofectamine 2000 | Life Technologies | Cat#11668019 |
| Q5 Site-Directed Mutagenesis Kit | NEB | Cat#E0554S |
| Novex TBE-Urea Gels, 6%, 10 well | Life Technologies | Cat#EC6865BOX |
| CircLigase | Illumina | Cat#CL4115K |
| TGIRT™-III Enzyme | InGex | Cat#TGIRT50 |
| Phusion High-Fidelity DNA Polymerase | NEB | Cat#M0530L |
| μMACS Streptavidin Kits | Miltenyi Biotech | Cat#130-091-287 |
| Deposited Data | ||
| CENPB 3′-end library (fixed length) | This study | GEO: GSE93424 |
| Artificial 3′-end library (variable length) | This study | GEO: GSE95467 |
| DIM-2P-seq | This study | GEO: GSE95465 |
| 4sU-2P-seq (mRNA) | This study | GEO: GSE95464 |
| CENPB 3′-end CRISPR/Cas9 mutant | This study | GEO: GSE95466 |
| SuperSeries including all above GEO data | This study | GEO: GSE95468 |
| Experimental Models: Cell Lines | ||
| Human: HEK293T | ATCC | Cat#CRL-3216 |
| Human: HeLa | ATCC | Cat#CCL-2 |
| Human: K562 with inducible dCas9-KRAB | Gilbert et al., 2014 | N/A |
| Oligonucleotides | ||
| See Table S1 | ||
| Recombinant DNA | ||
| pCMV-GFP | Matsuda and Cepko, 2004 | Addgene # 11153 |
| lentiCRISPR | Shalem et al., 2014 | Addgene # 49535 |
| pCMV-GFP-CENPBpA | This paper | N/A |
| pCMV-GFP-CENPBpA-fixed-length | This paper | N/A |
| pCMV-GFP-CENPBpA-variable-length | This paper | N/A |
| pCMV-GFP-CENPBpA-fixed-length-clone-1 | This paper | N/A |
| pCMV-GFP-CENPBpA-fixed-length-clone-2 | This paper | N/A |
| pCMV-GFP-CENPBpA-fixed-length-clone-3 | This paper | N/A |
| pCMV-GFP-CENPBpA-fixed-length-clone-4 | This paper | N/A |
| pCMV-GFP-CENPBpA-fixed-length-clone-5 | This paper | N/A |
| pCMV-GFP-CENPBpA-fixed-length-clone-6 | This paper | N/A |
| pCMV-GFP-CENPBpA-fixed-length-clone-7 | This paper | N/A |
| pCMV-GFP-CENPBpA-fixed-length-clone-8 | This paper | N/A |
| pCMV-GFP-CENPBpA-fixed-length-clone-9 | This paper | N/A |
| pCMV-GFP-CENPBpA-fixed-length-clone-10 | This paper | N/A |
| pCMV-GFP-CENPBpA-fixed-length-clone-11 | This paper | N/A |
| pCMV-GFP-CENPBpA-fixed-length-clone-12 | This paper | N/A |
| pCMV-GFP-CENPBpA-fixed-length-clone-13 | This paper | N/A |
| pCMV-GFP-CENPBpA-fixed-length-clone-14 | This paper | N/A |
| pCMV-GFP-CENPBpA-del | This paper | N/A |
| pCMV-GFP-RPS5pA | This paper | N/A |
| pCMV-GFP-RPS5pA-m1 | This paper | N/A |
| pCMV-GFP-RPS5pA-m1r | This paper | N/A |
| pCMV-GFP-RPS5pA-m2 | This paper | N/A |
| pCMV-GFP-RPS5pA-m2r | This paper | N/A |
| pCMV-GFP-RPS5pA-del | This paper | N/A |
| pCMV-GFP-TFE3pA | This paper | N/A |
| pCMV-GFP-TFE3pA-G9C | This paper | N/A |
| pCMV-GFP-TFE3pA-G9C-C19G | This paper | N/A |
| pCMV-GFP-TFE3pA-del | This paper | N/A |
| pCMV-GFP-ILVBLpA | This paper | N/A |
| pCMV-GFP-ILVBLpA-G10C | This paper | N/A |
| pCMV-GFP-ILVBLpA-G10C-C21G | This paper | N/A |
| lentiCRISPRv1-CENPB | This paper | N/A |
| CRISPRi library | Gilbert et al., 2014 | Addgene # 62217 |
| CRISPRi-CENPB-g1 | This paper | N/A |
| CRISPRi-CENPB-g2 | This paper | N/A |
| CRISPRi-CENPB-g3 | This paper | N/A |
| CRISPRi-CENPB-g4 | This paper | N/A |
| CRISPRi-CENPB-g5 | This paper | N/A |
| CRISPRi-CENPB-g6 | This paper | N/A |
| CRISPRi-CENPB-g7 | This paper | N/A |
| CRISPRi-CENPB-g8 | This paper | N/A |
| CRISPRi-CENPB-g9 | This paper | N/A |
| CRISPRi-CENPB-g10 | This paper | N/A |
| Software and Algorithms | ||
| kpLogo | Wu and Bartel, 2017 | http://kplogo.wi.mit.edu |
| The ViennaRNA Package | Lorenz et al., 2011 | https://www.tbi.univie.ac.at/RNA |
| Bedtools v2.23.0 | Quinlan and Hall, 2010 | http://bedtools.readthedocs.io/en/latest/ |
| uShuffle | Jiang et al., 2008 | http://digital.cs.usu.edu/~mjiang/ushuffle/ |
| Other | ||
| 2P-seq protocol, step-by-step | Spies et al., 2013 | http://bartellab.wi.mit.edu/protocols.html |
| 4sU-2P-seq protocol, step-by-step | This paper | http://bartellab.wi.mit.edu/protocols.html |
| DIM-2P-seq protocol, step-by-step | This paper | http://bartellab.wi.mit.edu/protocols.html |
| lentiCRISPR guide RNA cloning protocol, step-by-step | Shalem et al., 2014 | http://genome-engineering.org/gecko/?page_id=15 |
| CRISPRi guide RNA cloning protocol, step-by-step | Gilbert et al., 2014 | http://weissmanlab.ucsf.edu/CRISPR/CRISPR.html |
CRISPR/Cas9-based mutagenesis of the CENPB 3′-end stem-loop
Oligonucleotides were purchased from IDT and are listed in Table S1. Oligonucleotides encoding a guide RNA targeting the CENPB 3′-end stem-loop was cloned into lentiCRISPR (Shalem et al., 2014) via the BsmBI site. HEK293T cells were seeded on day 0 (300,000 cells per well in a 6-well plate), transfected with 2 μg Cas9/gRNA plasmid on day 1, transfected again on day 2, and collected for DNA and RNA analysis on days 3, 6, and 12. Genomic DNA and RNA were extracted from cells using the QIAamp DNA Mini Kit and the RNeasy Mini Kit, respectively. The 3′-end region, including the stem-loop, was amplified from both genomic DNA and cDNA collected on day 12 using primers listed in Table S1. The PCR product was purified using agarose gels and sequenced using the Illumina HiSeq 2500 platform with a custom sequencing primer (Table S1). Only reads for mRNAs cleaved at the original poly(A) site (as indicated by a GCC immediately upstream of the tail) were considered in this analysis.
CRISPRi-based knockdown of CENPB transcription
Plasmids encoding ten guide RNAs previously designed to target the CENPB gene promoter (Gilbert et al., 2014) were individually constructed using oligonucleotides and the BstXI and BlpI sites of the CRISPRi library plasmid (Gilbert et al., 2014). Doxycycline (Clontech) was added into the K562 cell line at a final concentration of 50 ng/mL to induce the dCas9-KRAB fusion (Gilbert et al., 2014), and 24 hours later, guide RNAs were nucleofected into the cells with Cell Line Nucleofector Kit V (Lonza) according to the manufacturer’s instructions. After 48 hours, RNA was isolated for RT-qPCR analysis.
QUANTIFICATION AND STATISTICAL ANALYSIS
Statistical parameters including the exact value of n and statistical significance (P value) are reported in the Figures and the Figure Legends. Data were judged to be statistically significant when P was <0.05.
DATA AND SOFTWARE AVAILABILITY
Software
Data Resources
Sequencing datasets generated in this study, including those for the artificial 3′-end library, the CENPB 3′-end library, the Cas9-induced mutants of CENPB 3′ ends, the DIM-2P-seq analysis, and 45 the 4sU-2P-seq analysis, have been deposited in the GEO database under accession number GSE95468.
Supplementary Material
(A) Mutation frequencies observed during DIM-2P-seq. Plotted for each of the four nucleotides is the mutation frequency observed when performing the protocol without DMS treatment (ctrl), the mutation frequency observed when treating with DMS (dms), and the mutation frequency attributed to the DMS treatment (dms – ctrl).
(B) Substitutions that disrupt (red) and restore (green) the stem-loop structure predicted within the RPS5 3′-end region. Shown are the sequence, predicted structure (bracket notation), and predicted ΔG of the wild type region (wt) and each mutant region (m1, mutant with a single-base substitution that weakens the predicted structure; m1r: a compensatory mutant of m1 that restores predicted stability; m2, a mutant with two mutations that strongly disrupt the predicted structure; m2r, a compensatory mutant of m2 that restores the structure; del, a mutant lacking the distal portion of the predicted stem-loop). Mutants were tested in the context of a 580-bp fragment that included the last exon of RPS5 and some downstream sequence and was inserted between the GFP reading frame and a β-globin poly(A) site.
(C) Relative usage of the wild type and mutant versions the RPS5 3′-end region. Each construct in (B) was expressed in HEK293T cells and then relative usage (graph) was quantified by RT-PCR (gel). Relative usage was measured as the intensity of the band representing the RPS5 poly(A) site normalized to that of the β-globin poly(A) site, and then normalized to the wild type usage.
(A) Sequence, predicted ΔG, and gel-based relative usage measurements for 14 randomly picked clones. Differences from the wild type sequence are indicated (red). The wild type predicted secondary structure is shown at the bottom (bracket notation). Note that clones 2 and 9 were both wild type. Usage values are log2 fold changes relative to that of the wild type (average of clones 2 and 9). Clones 3, 6, and 8 (marked by asterisk) were not among the variants with sufficient β-globin reads for quantification in the sequencing-based assay.
(B) Gel used to measure the relative usage values reported in (A). RT-PCR products were resolved on a 2% agarose gel, and relative usage of the CENPB poly(A) site was quantified based on the ratios of band intensities for the mutant and wild type constructs.
(C) Relationship between the sequencing-based and gel-based measurements of relative usage for the 11 clones of (A) with sufficient β-globin reads for quantification in the sequencing-based assay.
(D) Relationship between usage measured in HeLa cells and usage measured in HEK293T cells, showing results for variants with ≥20 reads from the β-globin poly(A) site in each cell type.
Otherwise this figure is as in Figure S1B and C.
(A) Cenpb and Spef1 RNA expression before and after heat shock of mouse 3T3 cells (Shalgi et al., 2014). Shown are browser tracks with gene annotations and normalized RNA-seq read density from cells grow at 37°C (37C) or 42°C for 8 hours (42C8h). The bottom three tracks zoom-in on the shaded region of the top three tracks. Note that expression of Cdc25b, the gene upstream of Cenpb, showed minimal change.
(B) The knockdown efficiency of 10 CRISPRi guide RNAs for CENPB in human K562 cells expressing dCas9-KRAB fusion proteins. CENPB mRNA levels were determined using RT-qPCR, normalizing to results of ACTB and then to cells expressing no guide RNA. Error bars indicate standard deviation of three technical replicates.
(C) Effects of CENPB transcriptional inhibition on the expression of CENPB and SPEF1. Shown are the fold repression values determined using RT-qPCR, comparing RNA levels in K562 cells expressing the g6 guide RNA to those in cells expressing the g7 control guide RNA. Error bars indicate standard deviation of three technical replicates.
(A) Enrichment of shorter-lived mRNAs (GFP and MYC) in nascent RNA captured after 30 or 60 minutes of 4sU labeling. Shown are the ratios of RNA-seq reads observed between nascent RNA and total RNA for GAPDH, GFP, and MYC, further normalized to the ratio observed for GAPDH in a RT-qPCR assay.
(B) Analysis of Figure 6B but replacing steady-state usage with usage in nascent RNA captured after incubating with 4sU for 60 minutes. The differences in relative-usage values were detectable but not as great as those observed in Figure 6B, as expected if the decreased stability of mRNAs with lower usage values had smaller effects after only 60 minutes than at steady state.
(C) Analysis of Figure 6B but replacing usage in nascent RNA captured after incubating with 4sU for 30 minutes with usage in nascent RNA captured after incubating with 4sU for 60 minutes. The differences in relative-usage values were detectable but not as great as those observed in Figure 6B, as expected if the decreased stability of mRNAs with lower usage values had larger effects after 60 minutes than after only 30 minutes.
(D) Analysis of Figure 6C but plotting results for all variants with ≥20 β-globin reads. The reason for the drop in correlation compared to Figure 6C is analyzed in (E) and (F).
(E) Analysis of the drop in correlation observed in (D). Reads from the abundant variants that were analyzed in Figure 6C were subsampled from a binomial distribution with p = 20/1,000, and then the metabolic stability was re-calculated for those with ≥20 subsampled reads, and the relationship between the recalculated relative metabolic stability and predicted folding stability is plotted. The correlation coefficient (0.27) was comparable to that of the analysis of (D), indicating the decrease in correlation relative to that observed in Figure 6C was primarily due to noise in the metabolic stability measurements, as a result of low read counts.
(F) Repeat of the analysis of (E) but with a second sampling run.
(A) The relationship between site usage and folding significance (P value) for CENPB variants expressed from CAS-9–generated mutants. Otherwise, this panel is as in Figure 7A. Of these 568 CENPB mutants with PAS–poly(A) site distances >27 nt analyzed in Figure 5B, only 73 (12.9%) had predicted folding stabilities significantly greater than that of random sequences (i.e., P <0.05).
(B) Relationship between usage and predicted folding stability for the 220 variants of (A) with structures predicted to be less stable than those of most random sequences (P >0.5). Otherwise, this panel is as in Figure 7B.
Table S1. Oligonucleotides Used in This Study, Related to the STAR Methods.
RNA structures facilitate cleavage and polyadenylation of thousands of human mRNAs
In cells, mRNA 3′-end regions are generally more folded than are other mRNA regions
Structures with stabilities resembling those of random sequences can be functional
More stable 3′-end structures enhance mRNA metabolic stability
Acknowledgments
We thank S. Rouskin, P. Gupta, J. Guo, S. Eichhorn, J. Kwasnieski, K. Xiang, B. Kleaveland, and S. McGeary for valuable advice and discussions, and the Whitehead Institute Genome Technology Core for sequencing. This work was supported by NIH grant GM118135 (D.P.B.). X.W. is a Helen Hay Whitney Foundation Fellow. D.B. is an investigator of the Howard Hughes Medical Institute. The authors have no conflict of interest.
Footnotes
AUTHOR CONTRIBUTIONS
X.W. conceived and developed the project and performed all experiments and analyses. X.W. and D.P.B designed the study and wrote the paper.
Publisher's Disclaimer: This is a PDF file of an unedited manuscript that has been accepted for publication. As a service to our customers we are providing this early version of the manuscript. The manuscript will undergo copyediting, typesetting, and review of the resulting proof before it is published in its final citable form. Please note that during the production process errors may be discovered which could affect the content, and all legal disclaimers that apply to the journal pertain.
References
- Ahmed YF, Gilmartin GM, Hanly SM, Nevins JR, Greene WC. The HTLV-I Rex response element mediates a novel form of mRNA polyadenylation. Cell. 1991;64:727–737. doi: 10.1016/0092-8674(91)90502-p. [DOI] [PubMed] [Google Scholar]
- Brown JA, Valenstein ML, Yario TA, Tycowski KT, Steitz JA. Formation of triple-helical structures by the 3′-end sequences of MALAT1 and MEN noncoding RNAs. Proc Natl Acad Sci. 2012;109:19202–19207. doi: 10.1073/pnas.1217338109. [DOI] [PMC free article] [PubMed] [Google Scholar]
- Brown PH, Tiley LS, Cullen BR. Effect of RNA secondary structure on polyadenylation site selection. Genes Dev. 1991;5:1277–1284. doi: 10.1101/gad.5.7.1277. [DOI] [PubMed] [Google Scholar]
- Chan SW, Fowler KJ, Choo KHA, Kalitsis P. Spef1, a conserved novel testis protein found in mouse sperm flagella. Gene. 2005;353:189–199. doi: 10.1016/j.gene.2005.04.025. [DOI] [PubMed] [Google Scholar]
- Chen F, MacDonald CC, Wilusz J. Cleavage site determinants in the mammalian polyadenylation signal. Nucleic Acids Res. 1995;23:2614–2620. doi: 10.1093/nar/23.14.2614. [DOI] [PMC free article] [PubMed] [Google Scholar]
- Clote P, Ferre F, Kranakis E, Krizanc D. Structural RNA has lower folding energy than random RNA of the same dinucleotide frequency. RNA. 2005;11:578–591. doi: 10.1261/rna.7220505. [DOI] [PMC free article] [PubMed] [Google Scholar]
- Cong L, Ran FA, Cox D, Lin S, Barretto R, Habib N, Hsu PD, Wu X, Jiang W, Marraffini LA, et al. Multiplex genome engineering using CRISPR/Cas systems. Science. 2013;339:819–823. doi: 10.1126/science.1231143. [DOI] [PMC free article] [PubMed] [Google Scholar]
- Ding Y, Tang Y, Kwok CK, Zhang Y, Bevilacqua PC, Assmann SM. In vivo genome-wide profiling of RNA secondary structure reveals novel regulatory features. Nature. 2014;505:696–700. doi: 10.1038/nature12756. [DOI] [PubMed] [Google Scholar]
- Gil A, Proudfoot NJ. Position-dependent sequence elements downstream of AAUAAA are required for efficient rabbit β-globin mRNA 3′ end formation. Cell. 1987;49:399–406. doi: 10.1016/0092-8674(87)90292-3. [DOI] [PubMed] [Google Scholar]
- Gilbert LA, Horlbeck MA, Adamson B, Villalta JE, Chen Y, Whitehead EH, Guimaraes C, Panning B, Ploegh HL, Bassik MC, et al. Genome-Scale CRISPR-Mediated Control of Gene Repression and Activation. Cell. 2014;159:647–661. doi: 10.1016/j.cell.2014.09.029. [DOI] [PMC free article] [PubMed] [Google Scholar]
- Guo JU, Bartel DP. RNA G-quadruplexes are globally unfolded in eukaryotic cells and depleted in bacteria. Science (80- ) 2016;353 doi: 10.1126/science.aaf5371. aaf5371-aaf5371. [DOI] [PMC free article] [PubMed] [Google Scholar]
- Heath CV, Denome RM, Cole CN. Spatial constraints on polyadenylation signal function. J Biol Chem. 1990;265:9098–9104. [PubMed] [Google Scholar]
- Hudson DF, Fowler KJ, Earle E, Saffery R, Kalitsis P, Trowell H, Hill J, Wreford NG, de Kretser DM, Cancilla MR, et al. Centromere protein B null mice are mitotically and meiotically normal but have lower body and testis weights. J Cell Biol. 1998;141:309–319. doi: 10.1083/jcb.141.2.309. [DOI] [PMC free article] [PubMed] [Google Scholar]
- Jiang M, Anderson J, Gillespie J, Mayne M. uShuffle: A useful tool for shuffling biological sequences while preserving the k-let counts. BMC Bioinformatics. 2008;9:192. doi: 10.1186/1471-2105-9-192. [DOI] [PMC free article] [PubMed] [Google Scholar]
- Kini HK, Silverman IM, Ji X, Gregory BD, Liebhaber SA. Cytoplasmic poly(A) binding protein-1 binds to genomically encoded sequences within mammalian mRNAs. RNA. 2016;22:61–74. doi: 10.1261/rna.053447.115. [DOI] [PMC free article] [PubMed] [Google Scholar]
- Lorenz R, Bernhart SH, Honer Zu Siederdissen C, Tafer H, Flamm C, Stadler PF, Hofacker IL. ViennaRNA Package 2.0. Algorithms Mol Biol. 2011;6:26. doi: 10.1186/1748-7188-6-26. [DOI] [PMC free article] [PubMed] [Google Scholar]
- Mangus DA, Evans MC, Jacobson A. Poly(A)-binding proteins: multifunctional scaffolds for the post-transcriptional control of gene expression. Genome Biol. 2003;4:223. doi: 10.1186/gb-2003-4-7-223. [DOI] [PMC free article] [PubMed] [Google Scholar]
- Marzluff WF, Wagner EJ, Duronio RJ. Metabolism and regulation of canonical histone mRNAs: life without a poly(A) tail. Nat Rev Genet. 2008;9:843–854. doi: 10.1038/nrg2438. [DOI] [PMC free article] [PubMed] [Google Scholar]
- Matsuda T, Cepko CL. Electroporation and RNA interference in the rodent retina in vivo and in vitro. Proc Natl Acad Sci. 2004;101:16–22. doi: 10.1073/pnas.2235688100. [DOI] [PMC free article] [PubMed] [Google Scholar]
- McDevitt MA, Hart RP, Wong WW, Nevins JR. Sequences capable of restoring poly(A) site function define two distinct downstream elements. EMBO J. 1986;5:2907–2913. doi: 10.1002/j.1460-2075.1986.tb04586.x. [DOI] [PMC free article] [PubMed] [Google Scholar]
- Melo EO, Dhalia R, Martins de Sa C, Standart N, de Melo Neto OP. Identification of a C-terminal poly(A)-binding protein (PABP)-PABP interaction domain: role in cooperative binding to poly (A) and efficient cap distal translational repression. J Biol Chem. 2003;278:46357–46368. doi: 10.1074/jbc.M307624200. [DOI] [PubMed] [Google Scholar]
- Mohr S, Ghanem E, Smith W, Sheeter D, Qin Y, King O, Polioudakis D, Iyer VR, Hunicke-Smith S, Swamy S, et al. Thermostable group II intron reverse transcriptase fusion proteins and their use in cDNA synthesis and next-generation RNA sequencing. RNA. 2013;19:958–970. doi: 10.1261/rna.039743.113. [DOI] [PMC free article] [PubMed] [Google Scholar]
- Mortimer SA, Kidwell MA, Doudna JA. Insights into RNA structure and function from genome-wide studies. Nat Rev Genet. 2014;15:469–479. doi: 10.1038/nrg3681. [DOI] [PubMed] [Google Scholar]
- Nam JW, Rissland OS, Koppstein D, Abreu-Goodger C, Jan CH, Agarwal V, Yildirim MA, Rodriguez A, Bartel DP. Global analyses of the effect of different cellular contexts on microRNA targeting. Mol Cell. 2014;53:1031–1043. doi: 10.1016/j.molcel.2014.02.013. [DOI] [PMC free article] [PubMed] [Google Scholar]
- O’Leary NA, Wright MW, Brister JR, Ciufo S, Haddad D, McVeigh R, Rajput B, Robbertse B, Smith-White B, Ako-Adjei D, et al. Reference sequence (RefSeq) database at NCBI: current status, taxonomic expansion, and functional annotation. Nucleic Acids Res. 2016;44:D733–D745. doi: 10.1093/nar/gkv1189. [DOI] [PMC free article] [PubMed] [Google Scholar]
- Quinlan AR, Hall IM. BEDTools: a flexible suite of utilities for comparing genomic features. Bioinformatics. 2010;26:841–842. doi: 10.1093/bioinformatics/btq033. [DOI] [PMC free article] [PubMed] [Google Scholar]
- Radle B, Rutkowski AJ, Ruzsics Z, Friedel CC, Koszinowski UH, Dolken L. Metabolic labeling of newly transcribed RNA for high resolution gene expression profiling of RNA synthesis, processing and decay in cell culture. J Vis Exp. 2013 doi: 10.3791/50195. [DOI] [PMC free article] [PubMed] [Google Scholar]
- Rivas E, Eddy SR. Secondary structure alone is generally not statistically significant for the detection of noncoding RNAs. Bioinformatics. 2000;16:583–605. doi: 10.1093/bioinformatics/16.7.583. [DOI] [PubMed] [Google Scholar]
- Rouskin S, Zubradt M, Washietl S, Kellis M, Weissman JS. Genome-wide probing of RNA structure reveals active unfolding of mRNA structures in vivo. Nature. 2014;505:701–705. doi: 10.1038/nature12894. [DOI] [PMC free article] [PubMed] [Google Scholar]
- Shalem O, Sanjana NE, Hartenian E, Shi X, Scott DA, Mikkelsen TS, Heckl D, Ebert BL, Root DE, Doench JG, et al. Genome-scale CRISPR-Cas9 knockout screening in human cells. Science. 2014;343:84–87. doi: 10.1126/science.1247005. [DOI] [PMC free article] [PubMed] [Google Scholar]
- Shalgi R, Hurt JA, Lindquist S, Burge CB. Widespread inhibition of posttranscriptional splicing shapes the cellular transcriptome following heat shock. Cell Rep. 2014;7:1362–1370. doi: 10.1016/j.celrep.2014.04.044. [DOI] [PubMed] [Google Scholar]
- Spies N, Burge CB, Bartel DP. 3′ UTR-isoform choice has limited influence on the stability and translational efficiency of most mRNAs in mouse fibroblasts. Genome Res. 2013;23:2078–2090. doi: 10.1101/gr.156919.113. [DOI] [PMC free article] [PubMed] [Google Scholar]
- Spitale RC, Flynn RA, Zhang QC, Crisalli P, Lee B, Jung JW, Kuchelmeister HY, Batista PJ, Torre EA, Kool ET, et al. Structural imprints in vivo decode RNA regulatory mechanisms. Nature. 2015;519:486–490. doi: 10.1038/nature14263. [DOI] [PMC free article] [PubMed] [Google Scholar]
- Tian B, Manley JL. Alternative polyadenylation of mRNA precursors. Nat Rev Mol Cell Biol. 2017 doi: 10.1038/nrm.2016.116. [DOI] [PMC free article] [PubMed] [Google Scholar]
- Tyner C, Barber GP, Casper J, Clawson H, Diekhans M, Eisenhart C, Fischer CM, Gibson D, Gonzalez JN, Guruvadoo L, et al. The UCSC Genome Browser database: 2017 update. Nucleic Acids Res. 2016;45:D626–D634. doi: 10.1093/nar/gkw1134. [DOI] [PMC free article] [PubMed] [Google Scholar]
- Wilusz JE, JnBaptiste CK, Lu LY, Kuhn CD, Joshua-Tor L, Sharp PA. A triple helix stabilizes the 3′ ends of long noncoding RNAs that lack poly(A) tails. Genes Dev. 2012;26:2392–2407. doi: 10.1101/gad.204438.112. [DOI] [PMC free article] [PubMed] [Google Scholar]
- Workman C, Krogh A. No evidence that mRNAs have lower folding free energies than random sequences with the same dinucleotide distribution. Nucleic Acids Res. 1999;27:4816–4822. doi: 10.1093/nar/27.24.4816. [DOI] [PMC free article] [PubMed] [Google Scholar]
- Wu X, Bartel DP. kpLogo: positional k-mer analysis reveals hidden specificity in biological sequences. Nucleic Acids Res. 2017 doi: 10.1093/nar/gkx323. in press. [DOI] [PMC free article] [PubMed] [Google Scholar]
- Zubradt M, Gupta P, Persad S, Lambowitz AM, Weissman JS, Rouskin S. DMS-MaPseq for genome-wide or targeted RNA structure probing in vivo. Nat Methods. 2017;14:75–82. doi: 10.1038/nmeth.4057. [DOI] [PMC free article] [PubMed] [Google Scholar]
Associated Data
This section collects any data citations, data availability statements, or supplementary materials included in this article.
Supplementary Materials
(A) Mutation frequencies observed during DIM-2P-seq. Plotted for each of the four nucleotides is the mutation frequency observed when performing the protocol without DMS treatment (ctrl), the mutation frequency observed when treating with DMS (dms), and the mutation frequency attributed to the DMS treatment (dms – ctrl).
(B) Substitutions that disrupt (red) and restore (green) the stem-loop structure predicted within the RPS5 3′-end region. Shown are the sequence, predicted structure (bracket notation), and predicted ΔG of the wild type region (wt) and each mutant region (m1, mutant with a single-base substitution that weakens the predicted structure; m1r: a compensatory mutant of m1 that restores predicted stability; m2, a mutant with two mutations that strongly disrupt the predicted structure; m2r, a compensatory mutant of m2 that restores the structure; del, a mutant lacking the distal portion of the predicted stem-loop). Mutants were tested in the context of a 580-bp fragment that included the last exon of RPS5 and some downstream sequence and was inserted between the GFP reading frame and a β-globin poly(A) site.
(C) Relative usage of the wild type and mutant versions the RPS5 3′-end region. Each construct in (B) was expressed in HEK293T cells and then relative usage (graph) was quantified by RT-PCR (gel). Relative usage was measured as the intensity of the band representing the RPS5 poly(A) site normalized to that of the β-globin poly(A) site, and then normalized to the wild type usage.
(A) Sequence, predicted ΔG, and gel-based relative usage measurements for 14 randomly picked clones. Differences from the wild type sequence are indicated (red). The wild type predicted secondary structure is shown at the bottom (bracket notation). Note that clones 2 and 9 were both wild type. Usage values are log2 fold changes relative to that of the wild type (average of clones 2 and 9). Clones 3, 6, and 8 (marked by asterisk) were not among the variants with sufficient β-globin reads for quantification in the sequencing-based assay.
(B) Gel used to measure the relative usage values reported in (A). RT-PCR products were resolved on a 2% agarose gel, and relative usage of the CENPB poly(A) site was quantified based on the ratios of band intensities for the mutant and wild type constructs.
(C) Relationship between the sequencing-based and gel-based measurements of relative usage for the 11 clones of (A) with sufficient β-globin reads for quantification in the sequencing-based assay.
(D) Relationship between usage measured in HeLa cells and usage measured in HEK293T cells, showing results for variants with ≥20 reads from the β-globin poly(A) site in each cell type.
Otherwise this figure is as in Figure S1B and C.
(A) Cenpb and Spef1 RNA expression before and after heat shock of mouse 3T3 cells (Shalgi et al., 2014). Shown are browser tracks with gene annotations and normalized RNA-seq read density from cells grow at 37°C (37C) or 42°C for 8 hours (42C8h). The bottom three tracks zoom-in on the shaded region of the top three tracks. Note that expression of Cdc25b, the gene upstream of Cenpb, showed minimal change.
(B) The knockdown efficiency of 10 CRISPRi guide RNAs for CENPB in human K562 cells expressing dCas9-KRAB fusion proteins. CENPB mRNA levels were determined using RT-qPCR, normalizing to results of ACTB and then to cells expressing no guide RNA. Error bars indicate standard deviation of three technical replicates.
(C) Effects of CENPB transcriptional inhibition on the expression of CENPB and SPEF1. Shown are the fold repression values determined using RT-qPCR, comparing RNA levels in K562 cells expressing the g6 guide RNA to those in cells expressing the g7 control guide RNA. Error bars indicate standard deviation of three technical replicates.
(A) Enrichment of shorter-lived mRNAs (GFP and MYC) in nascent RNA captured after 30 or 60 minutes of 4sU labeling. Shown are the ratios of RNA-seq reads observed between nascent RNA and total RNA for GAPDH, GFP, and MYC, further normalized to the ratio observed for GAPDH in a RT-qPCR assay.
(B) Analysis of Figure 6B but replacing steady-state usage with usage in nascent RNA captured after incubating with 4sU for 60 minutes. The differences in relative-usage values were detectable but not as great as those observed in Figure 6B, as expected if the decreased stability of mRNAs with lower usage values had smaller effects after only 60 minutes than at steady state.
(C) Analysis of Figure 6B but replacing usage in nascent RNA captured after incubating with 4sU for 30 minutes with usage in nascent RNA captured after incubating with 4sU for 60 minutes. The differences in relative-usage values were detectable but not as great as those observed in Figure 6B, as expected if the decreased stability of mRNAs with lower usage values had larger effects after 60 minutes than after only 30 minutes.
(D) Analysis of Figure 6C but plotting results for all variants with ≥20 β-globin reads. The reason for the drop in correlation compared to Figure 6C is analyzed in (E) and (F).
(E) Analysis of the drop in correlation observed in (D). Reads from the abundant variants that were analyzed in Figure 6C were subsampled from a binomial distribution with p = 20/1,000, and then the metabolic stability was re-calculated for those with ≥20 subsampled reads, and the relationship between the recalculated relative metabolic stability and predicted folding stability is plotted. The correlation coefficient (0.27) was comparable to that of the analysis of (D), indicating the decrease in correlation relative to that observed in Figure 6C was primarily due to noise in the metabolic stability measurements, as a result of low read counts.
(F) Repeat of the analysis of (E) but with a second sampling run.
(A) The relationship between site usage and folding significance (P value) for CENPB variants expressed from CAS-9–generated mutants. Otherwise, this panel is as in Figure 7A. Of these 568 CENPB mutants with PAS–poly(A) site distances >27 nt analyzed in Figure 5B, only 73 (12.9%) had predicted folding stabilities significantly greater than that of random sequences (i.e., P <0.05).
(B) Relationship between usage and predicted folding stability for the 220 variants of (A) with structures predicted to be less stable than those of most random sequences (P >0.5). Otherwise, this panel is as in Figure 7B.
Table S1. Oligonucleotides Used in This Study, Related to the STAR Methods.