

Abstract
A new method using matrix-assisted laser desorption/ionization (MALDI) mass spectrometry for the direct analysis of the mass-silent post-transcriptionally modified nucleoside pseudouridine in nucleic acids has been developed. This method utilizes 1-cyclohexyl-3-(2-morpholinoethyl)carbodiimide to derivatize pseudouridine residues. After chemical derivatization all pseudouridine residues will contain a 252 Da ‘mass tag’ that allows the presence of pseudouridine to be identified using mass spectrometry. Pseudouridine residues can be identified in intact nucleic acids by obtaining a mass spectrum of the nucleic acid before and after derivatization. The mass difference (in units of 252 Da) will denote the number of pseudouridine residues present. To determine the sequence location of pseudouridine, a combination of enzymatic hydrolysis and mass spectrometric steps are used. Here, MALDI analysis of RNase T1 digestion products before and after modification are used to narrow the sequence location of pseudouridine to specific T1 fragments in the gene sequence. Further mass spectrometric monitoring of exonuclease digestion products from isolated T1 fragments is then used for exact sequence placement. This approach to pseudouridine identification is demonstrated using Escherichia coli tRNAs. This new method allows for the direct determination of pseudouridine in nucleic acids, can be used to identify modified pseudouridine residues and can be used with general modification mapping approaches to completely characterize the post-transcriptional modifications present in RNAs.
INTRODUCTION
Post-transcriptional processing of RNA produces an exceptional number and structural diversity of modified nucleosides. Arguably one of the most intriguing modified nucleosides is pseudouridine (Ψ). Pseudouridine, an isomer of uridine, is the only mass-silent modification. While pseudouridine was the first modified nucleoside to be discovered and although it is the most abundant modification in RNA, a suitable methodology for its determination in RNA was not available until 1993. In that year Bakin and Ofengand presented a reverse transcriptase-based approach for its determination (1,2). This significant achievement has resulted in a renewed interest in understanding the biological significance of this modification. The distribution, abundance and importance of pseudouridine have been summarized in a number of recent reviews (3–5).
While the method of Bakin and Ofengand is extremely powerful, the underlying approach is based upon dideoxy chain termination sequencing using reverse transcriptase. Some of the potential difficulties associated with the Bakin and Ofengand approach can include: sequencing oligonucleotides that contain Ψ in a run of U residues (1); difficulties in interpreting data arising from weak, strong or stutter bands (6,7); and the inability to identify modified pseudouridine residues directly (2).
Recent developments in electrospray ionization mass spectrometry (ESI-MS) and matrix-assisted laser desorption/ionization mass spectrometry (MALDI-MS) now permit the analysis of oligonucleotides and intact nucleic acids (8,9). McCloskey has pioneered the use of mass spectrometry for the analysis of modified nucleosides from nucleic acids (10). McCloskey and co-workers developed a method for determining the sequence locations of modifications in RNA using mass spectrometry (11) and have applied this method to the analysis of a variety of RNAs (12–17).
The determination of pseudouridine using mass spectrometric methods is problematic in that this modification is the only known mass-silent modification. Here we report the development of a mass spectrometric approach for the direct determination of pseudouridine in RNA. Our approach utilizes the same chemical derivatization approach of Bakin and Ofengand (1) that converts the originally mass-silent modification to one which contains a unique mass tag that is easily identified by mass spectrometric analysis. As in their derivatization step, pseudouridine is chemically modified using 1-cyclohexyl-3-(2-morpholinoethyl)carbodiimide (CMC) metho-p-toluenesulfonate and alkaline buffer. Reaction with CMC modifies all G and U-like residues, but the CMC adduct is cleaved under alkaline conditions from all residues except at the N3 position of pseudouridine (18). All pseudouridine residues except for m1acp3Ψ will exhibit a mass shift of 252.21 u (due to the CMC adduct). A comparison of the masses of the unreacted and CMC-reacted oligonucleotides will determine the number of pseudouridine residues in the oligonucleotide. The sequence location of pseudouridine can be determined using MALDI-MS by mapping of nucleotide-specific RNase digestion products (19) or by the monitoring of exonuclease digestion products (20,21). We demonstrate this new approach to pseudouridine identification by analyzing two tRNAs from Escherichia coli.
MATERIALS AND METHODS
Materials
Escherichia coli tRNAVal1 (UAC) was obtained from Subriden RNA (Rolling Bay, WA) and used without further purification. Escherichia coli tRNAPhe was obtained from Sigma (St Louis, MO) and used without further purification. CMC metho-p-toluenesulfonate, Tris–HCl, urea, EDTA and ammonium bicarbonate were obtained from Sigma. RNase T1, snake venom phosphodiesterase (SVP) and alkaline phosphatase were obtained from Worthington Biochemical Corp. (Lakewood, NJ). Molecular weight centrifuge filters were obtained from Millipore Corp. (Bedford, MA). MALDI quality 2,4,6-trihydroxyacetophenone (THAP) and diammonium citrate (DAC) were obtained from Fluka (St Louis, MO).
Reaction of CMC with tRNA
Reaction mixtures consisting of 34 nmol (10 A260 units) tRNA, 1.2 mmol CMC in 3 ml of 50 mM Tris (pH 8.3), 4 mM EDTA and 7 M urea were incubated at 37°C for 20–30 min. The tRNA was then separated from the reaction mixture by use of centrifugation filters. The resulting tRNA solution was then mixed with 6 ml of a 50 mM ammonium acetate (pH 10.4) and 0.1 mM EDTA solution and allowed to react for 2–4 h at 37°C. As before, the tRNA was then separated from the reaction mixture by use of centrifugation filters and the final volume was adjusted to 10 µl using nanopure H2O. Control samples of tRNA were prepared following the same protocol described above except there was no addition of CMC to the initial reaction mixture. UV analysis (254 nm) of the control showed that the recovery of tRNA from the centrifugation filters was ∼70%.
RNase T1 digestion of derivatized and control tRNA
A 5 µl (∼12 nmol) aliquot of the tRNA obtained above was reacted in 50 µl of a 50 mM Tris–HCl, 1 mM EDTA solution containing 10 000 U RNase T1 at 37°C for 30 min. After digestion half of the reaction mixture was separated by reverse phase HPLC (described below) and each fraction was dried down and reconstituted in 10 µl of nanopure H2O. The other half of the reaction mixture was analyzed directly using MALDI-MS (described below).
Exonuclease digestion by SVP
A 3 µl (∼3.5 nmol) aliquot of the fractions shown by MALDI-MS to contain the CMC modification were incubated for 30 min at 37°C with 1 µl of a 0.5 U/µl solution of alkaline phosphatase. That solution was then reacted with 5 µl of a 0.05 U/µl solution of SVP, 5 µl of 100 mM ammonium acetate and 5 µl of nanopure H2O. The reaction was allowed to proceed at 37°C for 60 min with 3 µl aliquots removed every 15 min and placed upon ice. An aliquot of 1 µl of the reaction sample was mixed with 1 µl of matrix for immediate MALDI-MS analysis.
HPLC purification of RNase T1 digests
HPLC separations were performed on a Hitachi (San Jose, CA) Model 7400 instrument with the UV detector set to monitor at 254 nm. The column used was a reversed phase Supelco (Bellefonte, PA) Nucleosil C-18 column. Buffer A was composed of 25 mM triethylammonium bicarbonate, pH 6.5, and buffer B consisted of 40% aqueous acetonitrile. Gradient elution from 0 to 100% B at 2% B/min at a flow rate of 1 ml/min was used. The eluted fractions were dried down and reconstituted in 10 µl of nanopure H2O.
Mass spectrometry
All analyses, except of the intact tRNA, were performed using a Bruker (Billerica, MA) ProFlex III MALDI-TOF instrument equipped with a N2 laser operated in negative ion mode. Intact tRNAs were analyzed on a PerSeptive Biosystems (Framingham, MA) Voyager DE MALDI-TOF instrument equipped win a N2 laser operated in negative ion mode. For all experiments the accelerating voltage was held at 20 kV and the laser power was set to the minimum level necessary to generate a reasonable signal (threshold). A two point calibration using dT4 and dT10 was used for all analyses. The matrix solution used for all experiments, except where noted, consisted of 0.325 M THAP and 0.225 M DAC.
Analysis of intact tRNA by MALDI-MS
A 1 µl (∼2.5 nmol) aliquot of tRNA was mixed with 1 µl of matrix. A 0.5 µl aliquot of this mixture was spotted on the sample target and another 0.5 µl of matrix was spotted on top of the previously dried layer. MALDI measurements were obtained as described above with the instrument operating in linear mode.
Analysis of RNase T1 digest by MALDI-MS before HPLC
A 1 µl (∼1.2 nmol) aliquot of the RNase T1 digest was mixed with 1 µl of matrix. A 0.5 µl aliquot of this mixture was spotted on the sample target and MALDI measurements were obtained as described above with the instrument operating in reflectron mode.
MALDI-MS analysis of HPLC-separated fractions
A 1 µl (∼0.6 nmol) aliquot of the HPLC fraction was mixed with 1 µl of matrix. A 0.5 µl aliquot of this mixture was spotted on the sample target and MALDI measurements were obtained as described above with the instrument operating in reflectron mode.
MALDI-MS analysis of exonuclease reaction
Reaction aliquots (1 µl) were mixed with 1 µl of matrix. A 0.5 µl aliquot of this mixture was spotted on the sample target and MALDI measurements were obtained as described above with the instrument operating in reflectron mode.
RESULTS AND DISCUSSION
Derivatization and mass spectral analysis of intact tRNA
Derivatization of oligoribonucleotides or RNAs with CMC results in modification only of pseudouridine or modified pseudouridine residues (18). Thus, molecular weight measurements of the underivatized and derivatized sample will allow the direct determination of the number of pseudouridine residues present. To demonstrate that molecular weight measurements of nucleic acids containing pseudouridine with MALDI-MS permits determination of the number of pseudouridine residues present in the sample, E.coli tRNAVal1 was first analyzed. Escherichia coli tRNAVal1 contains a single pseudouridine residue which resides in the conserved TΨC stem–loop of the molecule. The molecular mass of underivatized tRNAVal1 is calculated to be 24 643 Da. Based upon the known chemistry of the CMC derivatization reaction, each pseudouridine residue should increase in mass by 252 Da. Thus, the overall molecular mass of tRNAVal1 after derivatization is predicted to be 24 895 Da.
Figure 1 shows representative mass spectra obtained on tRNAVal1 before derivatization (Fig. 1A) and after the CMC derivatization reaction (Fig. 1B). Suitable high quality MALDI mass spectra of underivatized tRNAVal1 are readily obtained with mass measurement errors of <0.5%, which is typical for the instrument used for these experiments. Furthermore, as determination of the number of pseudouridine residues present in the molecule is made by taking the difference in two mass values, the requirements for ultrahigh mass accuracy are reduced. As seen in Figure 1, the mass shift arising due to CMC derivatization is approximately that expected for addition of a single CMC group to the molecule. Replicate experiments found that the mass shift was 250 ± 6 u, which is within the experimental error for modification of a single pseudouridine residue. Thus, direct determination of the number of pseudouridine residues by mass measurement of underivatized and derivatized RNA samples is feasible using MALDI-MS.
Figure 1.
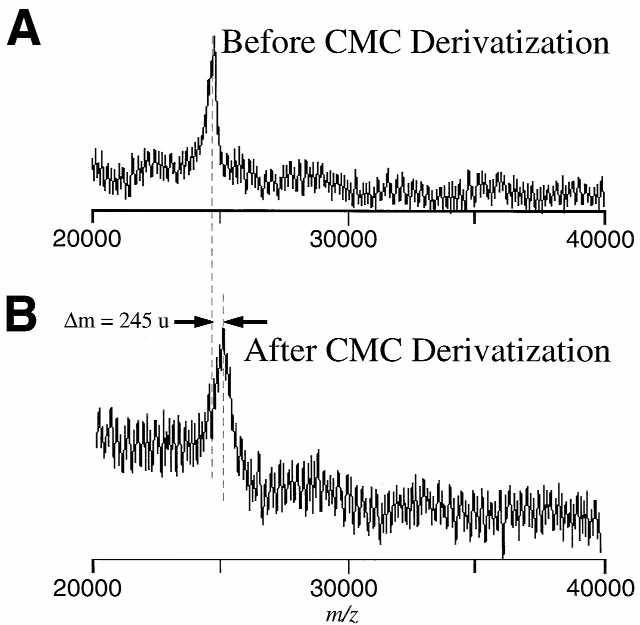
Representative negative ion MALDI mass spectra of (A) tRNAVal1 (theoretical Mr 24 643 Da, experimental Mr 24 705 Da) and (B) tRNAVal1 after CMC derivatization (theoretical Mr 24 895 Da, experimental Mr 24 950 Da). The tRNA samples were analyzed using 2:1 25 mg/ml (v:v) THAP:diammonium hydrogen citrate with 1 mM imidazole (22). The mass shift between the two analytes is 250 ± 6 u as determined from replicate measurements. The expected mass shift due to the presence of one CMC-derivatized pseudouridine residue is 252 u.
It should be noted that the representative data shown in Figure 1 were obtained after extensive sample purification and required salt-reducing co-matrices (22). High molecular weight oligonucleotides readily adduct metal ions present in the sample solutions, thereby reducing the sensitivity of the measurement (9,23). The underivatized tRNA was easier to analyze than the derivatized tRNA. The signal-to-noise ratio for the underivatized tRNA is approximately three times that of the derivatized sample. It was often noted that upon spotting the derivatized tRNA with the matrix on the MALDI sample plate co-crystallization of the sample and matrix did not occur. As the quality of MALDI mass spectral data depends upon co-crystallization of the analyte with the matrix (24) it is believed that the lack of co-crystallization is responsible for the poorer mass spectral data obtained for the CMC-derivatized tRNA.
RNase T1 mapping of tRNA
While mass spectrometric analysis of intact nucleic acids provides an indication of the number of pseudouridine residues present in the molecule, this approach is not suitable for identifying the sequence location of such modifications. The approach we have chosen to place pseudouridine residues at specific sequence locations is based on the mass spectral analysis of RNase T1 fragments. The use of the highly specific endonuclease RNase T1 simplifies analysis of the mass spectral data. The sequence of E.coli tRNAPhe [5′-pGCCCGGAs4UAGCUCAGUDGGDAGAGCAGGGGAΨUGAAms2i6AAΨCCCCGUm7G acp3UCCUUGGm5UΨCGAUUCCGAGUCCGGGCACCA(OH)-3′] was cleaved in silico to generate the predicted mass values reported in Table 1. Escherichia coli tRNAPhe contains three pseudouridine residues and only the three resulting RNase T1 fragments containing pseudouridine should increase in mass after derivatization with CMC.
Table 1. Expected product masses and experimentally measured masses for RNase T1 cleavage of E.coli tRNAPhe.
| RNase T1 fraction |
|
Predicted mass |
Experimental mass |
Error (%) |
| Gp | 362.05 | nd | ||
| pGp | 442.02 | nd | ||
| I | AG>p | 673.09 | nd | |
| II | UDG>p | 958.11 | 958.03 ± 2 | 0.01 |
| III | CAG>p | 978.13 | 979.99 ± 1 | 0.19 |
| IV | DAG>p | 981.13 | 982.37 ± 2 | 0.13 |
| V | CCCG>p | 1259.20 | 1260.4 ± 1 | 0.10 |
| VI | UCCG>p | 1260.20 | 1262.5 ± 1 | 0.19 |
| VII | m5UΨCG>p | 1275.20 | 1276.3 ± 1 | 0.09 |
| VIII | AΨUG>p | 1285.20 | 1285.4 ± 0 | 0.02 |
| IX | As4UAG>p | 1324.20 | 1325.6 ± 2 | 0.11 |
| X | CACCA(OH) | 1510.30 | nd | |
| VIIa | m5UΨCG>p + CMC | 1527.40 | 1527.1 ± 2 | 0.02 |
| VIIIa | AΨUG>p + CMC | 1537.40 | 1535.8 ± 2 | 0.10 |
| XI | CUCAG>p | 1589.20 | 1591.4 ± 1 | 0.14 |
| XII | AUUCCG>p | 1895.20 | 1896.1 ± 1 | 0.05 |
| XIII | Um7Gacp3UCCUUG>p | 2640.60 | 2641.1 ± 0 | 0.01 |
| XIV | AAms2i6AAΨCCCCG>p | 3303.10 | 3304.9 ± 1 | 0.05 |
| XIVa | AAms2i6AAΨCCCCG>p + CMC | 3555.10 | 3556.3 ± 1 | 0.05 |
Nucleotides less than∼525 u cannot be detected by MALDI mass spectrometry due to matrix interferences. nd, not detected.
Figure 2 shows representative mass spectral data obtained for a control (no CMC present during the derivatization reaction) (Fig. 2A) and a RNase T1 digest of CMC-reacted tRNAPhe (Fig. 2B). A comparison of the m/z values obtained in these two mass spectra finds the presence of several new peaks in the CMC-reacted data. Three of these peaks are detected at m/z 1524, 1536 and 3555. If one assumes that these three peaks contain CMC-modified nucleosides, their unmodified counterparts should be present in the control data at m/z 1277, 1287 and 3303, which is indeed the case. Based upon the known sequence of tRNAPhe and the predicted T1 digestion products, these three ions can be assigned to the following oligonucleotides (Table 1): m5UΨCG>p; AΨUG>p; AAms2i6AAΨCCCCG>p. As expected, from the known chemistry of the CMC-derivatization reaction (18), each T1 fraction containing a pseudouridine residue undergoes a 252 Da mass shift due to addition of the CMC group to the pseudouridine nucleoside.
Figure 2.
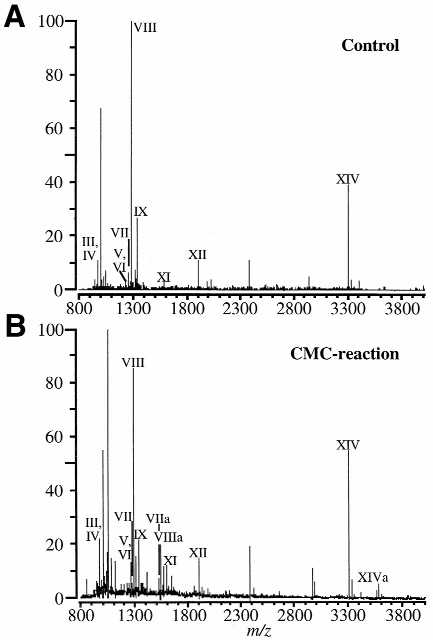
MALDI mass spectra of the RNase T1 digestion products of tRNAPhe. (A) Control sample. (B) CMC-reacted sample. Three new peaks appear in the CMC-reacted sample which correspond to the addition of a CMC group to a pseudouridine-containing oligonucleotide (see Table 1). Other peak assignments are listed in Table 1.
The complete RNase T1 map of tRNAPhe was obtained in both cases with the exception of oligonucleotide X, the 3′-terminus of the tRNA [5′-CACCA(OH)-3′]. It is not clear why this particular oligonucleotide was not detected at measurable abundances above the background. As seen in the mass spectra in Figure 2, several other ions are also present in the MALDI data. Many of these ions are sodium adducts of the RNase T1 digestion products. The CMC reaction spectrum contains more sodium adducts than does the control sample, although both samples underwent the same purification prior to analysis. More extensive sample clean-up should reduce these adducts (25). The data obtained here are of similar quality to those presented by Kirpekar et al. for MALDI RNase mapping of 5S rRNAs (19).
Exonuclease digestion of CMC-modified fractions by SVP
While the MALDI RNase T1 mapping data discussed above demonstrate that CMC derivatization can be used in combination with mass spectrometry to identify the sequence locations of pseudouridine residues in nucleic acids, the sequence assignments of the pseudouridine residues were only inferred based upon the known sequence of tRNAPhe and the predicted mass values of the RNase T1 fractions. Accurate assignment of pseudouridine requires that the appropriate T1 fractions be sequenced to confirm that the CMC mass tag resides on the pseudouridine residue. Further, application of this methodology to larger nucleic acids (e.g. rRNAs) or to nucleic acids whose post-transcriptional modifications are unknown requires that the sequence location of pseudouridine be identified within each modified RNase T1 fraction.
The approach we have chosen for sequence placement of pseudouridine residues includes reverse phase HPLC separation of the RNase T1 fractions followed by exonuclease digestion of the CMC-modified fractions. Representative HPLC chromatograms of a control (Fig. 3A) and CMC-derivatized T1 digest (Fig. 3B) are shown in Figure 3. A comparison between the control and CMC-derivatized chromatograms found that the absorbance of three peaks was from 4 to 10 times greater in the CMC-derivatized digest than in the control digest. Other UV studies of CMC-derivatized oligonucleotides (data not shown) have also demonstrated that the UV absorbance of CMC-derivatized oligonucleotides is much greater at 254 nm than those of underivatized oligonucleotides. Thus, the increase in UV absorbance allows one to determine which fractions contain CMC-derivatized oligonucleotides that should be further digested for sequence placement of the pseudouridine residues.
Figure 3.
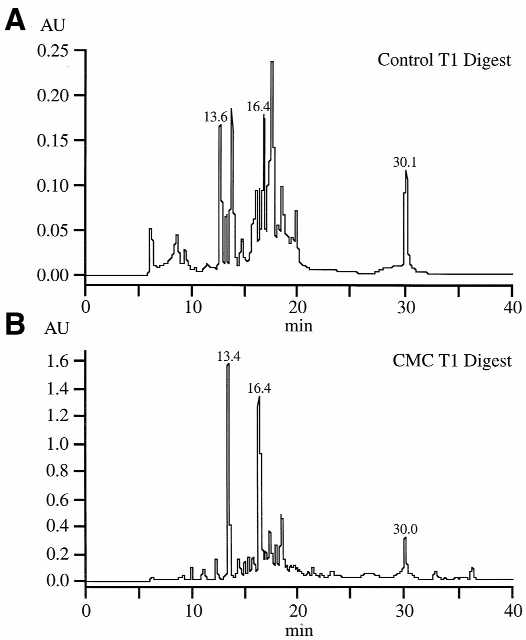
Reverse phase HPLC chromatograms of (A) control RNase T1 digest of tRNAPhe and (B) RNase T1 digest of CMC-reacted tRNAPhe. The three chromatographic peaks at 13.4, 16.4 and 30.0 min in the bottom chromatogram have absorbances that are 2–5 times greater than their counterparts in the control chromatogram.
MALDI-MS was first used to confirm that the three peaks selected from the chromatogram of the CMC-derivatized RNase T1 fractions actually contained the CMC-modified oligonucleotides (Fig. 4). Figure 4A is the MALDI mass spectrum of the peak eluting at 13.4 min in the chromatogram in Figure 3B. Four ions are detected which correspond to AΨUG>p, AΨUGp and their CMC-derivatized counterparts. The CMC-modified T1 products are detected nearly exclusively in this chromatographic fraction.
Figure 4.
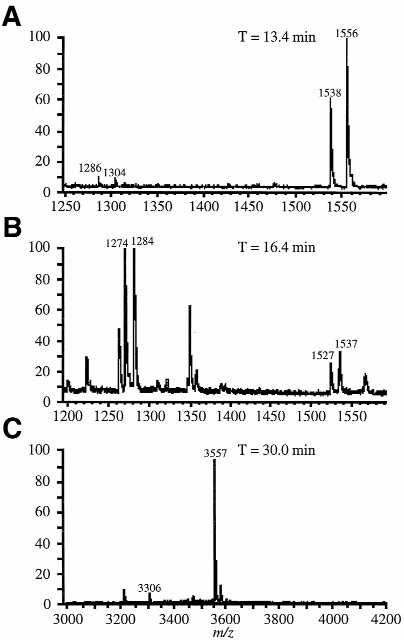
MALDI mass spectra of the RNase T1 digestion products of CMC-reacted tRNAPhe separated by reverse phase HPLC. (A) HPLC fraction eluting at 13.4 min. (B) HPLC fraction eluting at 16.4 min. (C) HPLC fraction eluting at 30.0 min. Each fraction contains at least one CMC-derivatized oligonucleotide. Sequence assignments are listed in Table 1.
Figure 4B is the MALDI mass spectrum of the peak eluting at 16.4 min in the chromatogram in Figure 3B. Here, unlike the case of Figure 4A and C, this chromatographic fraction contains a number of oligonucleotides. The two most abundant ions, at m/z 1274 and 1284, can be assigned to TΨCG>p and AΨUGp, respectively. Their CMC-derivatized counterparts are also found in this chromatographic fraction, at m/z 1527 and 1537. Figure 4C is the MALDI mass spectrum of the peak eluting at 30.0 min in the chromatogram in Figure 3B. The most abundant ion in this spectrum can be assigned to CMC-derivatized AAms2i6AAΨCCCCG>p. Its underivatized counterpart is also detected at m/z 3306. It is interesting to note that the abundance of the CMC-modified appear to increase relative to their unmodified counterparts after HPLC separation (e.g., Fig. 4A and C versus Fig. 2B). We are unsure whether this enhancement effect is a result of the chromotographic step or due to different derivatization yields. However, we have noted that HPLC purification prior to mass spectral analysis generally improves the identification of CMC-modified oligonucleotides and is recommended when analyzing unknown samples.
Once the presence of CMC-modified oligonucleotides was confirmed in the selected chromatographic fractions, exonuclease digestion was performed using SVP after removal of the 3′-phosphate group with alkaline phosphatase. SVP cleaves sequentially from the 3′-terminus of the oligonucleotide. MALDI-MS can be used to monitor the progress of this digestion process (20,21).
Analysis of the exonuclease digestion products of TΨCG and AΨUG is complicated because the 5′-terminal nucleosides (T and A, respectively) are not detected in negative ion mode MALDI-MS. Furthermore, matrix ion interferences below 500 u further complicate interpretation of the data. However, exonuclease digestion of these two RNase T1 fractions does demonstrate that the CMC modification must reside on either the T or Ψ residue for TΨCG and on either the A or Ψ residue for AΨUG (Table 2). Based on the known chemistry of the CMC derivatization reaction and based upon the results found for the larger pseudouridine-containing RNase T1 fraction (see below), it is most likely that the Ψ residues do contain the CMC modification. If rigorous confirmation of Ψ sequence placement were necessary, calf spleen exonuclease, a 5′→3′ exonuclease, could also be used.
Table 2. Sequences, calculated masses and experimentally measured masses of SVP digestion products for the three pseudouridine-containing fragments.
| RNase T1 fraction |
Predicted mass |
Experimental mass |
Error (%) |
| 16.4 min | |||
| m5UΨCG + CMC | 1465.40 | 1465.10 | 0.02 |
| m5UΨC + CMC | 1120.40 | 1124.60 | 0.37 |
| m5UΨ + CMC | 815.31 | 814.20 | 0.14 |
| m5U | 257.08 | nd | n/a |
| 13.4 min | |||
| AΨUG + CMC | 1475.40 | 1473.30 | 0.14 |
| AΨU + CMC | 1130.40 | 1135.70 | 0.47 |
| AΨ + CMC | 824.32 | 827.00 | 0.33 |
| A | 266.09 | nd | n/a |
| 30.0 min | |||
| AAms2i6AAΨC + CMC | 2230.60 | 2228.50 | 0.09 |
| AAms2i6AAΨ + CMC | 1925.50 | 1925.00 | 0.02 |
| AAms2i6AA | 1367.30 | 1369.90 | 0.19 |
| AAms2i6A | 1038.20 | 1041.70 | 0.34 |
| AA | 595.14 | 598.65 | 0.59 |
| AAms2i6AAΨC | 1978.40 | 1978.70 | 0.02 |
| AAms2i6AAΨ | 1673.30 | 1674.80 | 0.09 |
nd, not detected; n/a, not applicable.
Figure 5 is the MALDI mass spectrum of the 30.0 min chromatographic fraction in Figure 3B digested for 15 min with SVP. As discussed above, this fraction was found to contain the pseudouridine-containing 10mer oligonucleotide AAms2i6AAΨCCCCG>p with one CMC group. Assignment of the peaks in the mass spectrum conclusively shows that the CMC group resides on the Ψ residue (Table 2). In addition, two additional peaks are present in the mass spectrum that can be assigned to the 10mer without a CMC group. It is not clear whether the CMC group is lost during the exonuclease digestion reaction or whether these ions are due to the original underivatized 10mer present in the chromatographic fraction. In any event, the use of exonuclease digestion serves to confirm that the CMC mass tag resides on the pseudouridine residues in all three oligonucleotides and there is no evidence that CMC derivatized any other nucleoside except for pseudouridine.
Figure 5.
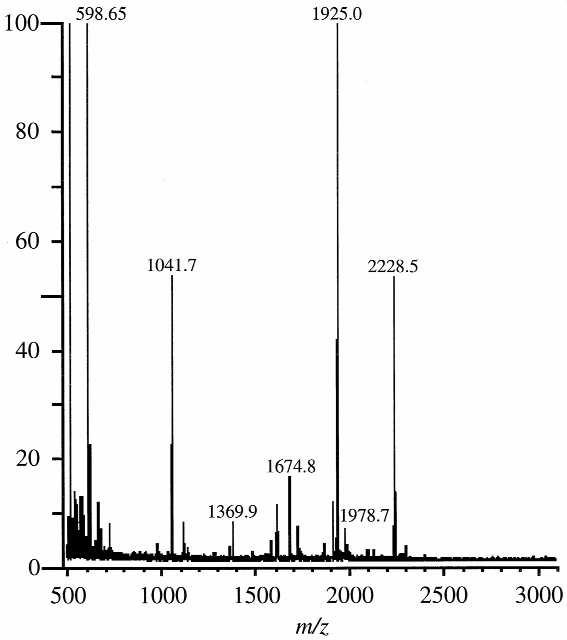
MALDI mass spectrum of the SVP digestion products of the CMC-modified 10mer oligonucleotide AAms2i6AAΨCCCCG identified in Figure 4C. After 15 minutes of digestion sufficient sequence information is present to confirm that the pseudouridine residue is modified by CMC. Sequence assignments are listed in Table 2.
The use of mass spectrometry for the analysis of CMC-derivatized samples allows the direct determination of pseudouridine in a single experiment. An additional advantage of this methodology is its ability to identify modified pseudouridine residues. Modified pseudouridine residues will exhibit an anomalous mass shift during exonuclease digestion that can be used to assign the modification (21,26). Further refinements to the derivatization reactions will be necessary to identify undermodified pseudouridine residues as the present reaction conditions do not result in a 100% conversion to CMC-derivatized pseudouridine residues. This protocol can also be utilized within a general MALDI RNase T1 mapping (19) or ESI-LC-MS approach (11) for post-transcriptional modification identification.
In summary, the method presented in this work allows the unambiguous determination of the number of pseudouridine residues, as well as their sequence location, in RNAs. The number of pseudouridine residues in an RNA can be determined simply from mass measurement of intact underivatized and derivatized samples. Mass spectrometric analysis of enzymatic digestion products can be used to identify the sequence location of pseudouridine. While the method presented here has been demonstrated using tRNAs, it should be generally applicable to any RNAs (e.g. snRNAs or rRNAs).
Acknowledgments
ACKNOWLEDGEMENTS
The authors thank Professors Kathleen Morden and William Daly (Louisiana State University) for helpful discussions and assistance. P.A.L. would like to acknowledge J.Kowalak for initial discussions regarding this work. Financial support of this work was provided by the National Institutes of Health (GM58843) and Louisiana State University.
References
- 1.Bakin A. and Ofengand,J. (1993) Four newly located pseudouridylate residues in Escherichia coli 23S ribosomal RNA are all at the peptidyltransferase center: analysis by the application of a new sequencing technique. Biochemistry, 32, 9754–9762. [DOI] [PubMed] [Google Scholar]
- 2.Ofengand J. and Bakin,A. (1997) Mapping to nucleotide resolution of pseudouridine residues in large subunit ribosomal RNAs from representative eukaryotes, prokaryotes, archaebacteria, mitochondria and chloroplasts. J. Mol. Biol., 266, 246–268. [DOI] [PubMed] [Google Scholar]
- 3.Ofengand J., Bakin,A., Wrzesinski,J., Nurse,K. and Lane,B.G. (1995) The pseudouridine residues of ribosomal RNA. Biochem. Cell Biol., 73, 915–924. [DOI] [PubMed] [Google Scholar]
- 4.Maden B.E.H. and Hughes,J.M.X. (1997) Eukaryatic ribosomal RNA: the recent excitement in the nucleotide modification problem. Chromosoma, 105, 391–400. [DOI] [PubMed] [Google Scholar]
- 5.Charette M. and Gray,M. (2000) Pseudouridine in RNA: what, where, how and why. Life, 49, 341–351. [DOI] [PubMed] [Google Scholar]
- 6.Hahn C.S., Strauss,E.G. and Strauss,J.H. (1989) Dideoxy sequencing of RNA using reverse transcriptase. Methods Enzymol., 180, 121–130. [DOI] [PubMed] [Google Scholar]
- 7.Bakin A., Lane,B.G. and Ofengand,J. (1994) Clustering of pseudouridine residues around the peptidyltransferase center of yeast cytoplasmic and mitochondrial ribosomes. Biochemistry, 33, 13475–13483. [DOI] [PubMed] [Google Scholar]
- 8.Polo L.M. and Limbach,P.A. (2000) Analysis of oligonucleotides by electrospray ionization mass spectrometry. In Beaucage,S., Bergstrom,D.E., Glick,G.D. and Jones,R.A. (eds), Current Protocols in Nucleic Acid Chemistry. John Wiley & Sons, New York, NY, pp. 10.12.11–10.12.20. [DOI] [PubMed]
- 9.Chou C.-W. and Limbach,P.A. (2000) Matrix-assisted laser desorption/ionization time-of-flight analysis of oligonucleotides. In Beaucage,S., Bergstrom,D.E., Glick,G.D. and Jones,R.A. (eds), Current Protocols in Nucleic Acid Chemistry. John Wiley & Sons, New York, NY, pp. 10.11.11–10.11.25.
- 10.McCloskey J.A. (1991) Structural characterization of natural nucleosides by mass spectrometry. Acc. Chem. Res., 24, 81–88. [Google Scholar]
- 11.Kowalak J.A., Pomerantz,S.C., Crain,P.F. and McCloskey,J.A. (1993) A novel method for the determination of posttranscriptional modification in RNA by mass spectrometry. Nucleic Acids Res., 21, 4577–4585. [DOI] [PMC free article] [PubMed] [Google Scholar]
- 12.Bruenger E., Kowalak,J.A., Kuchino,Y., McCloskey,J.A., Mizushima,H., Stetter,K.O. and Crain,P.F. (1993) 5S rRNA modification in the hyperthermophilic Archaea Sulfolobus solfataricus and Pyrodictium occultum. FASEB J., 7, 196–200. [DOI] [PubMed] [Google Scholar]
- 13.Bakin A., Kowalak,J.A., McCloskey,J.A. and Ofengand,J. (1994) The single pseudouridine residue in Escherichia coli 16S RNA is located at position 516. Nucleic Acids Res., 22, 3681–3684. [DOI] [PMC free article] [PubMed] [Google Scholar]
- 14.Kowalak J.A., Bruenger,E.B. and McCloskey,J.A. (1995) Posttranscriptional modification of the central loop of domain V in E. coli 23S ribosomal RNA. J. Biol. Chem., 270, 17758–17764. [DOI] [PubMed] [Google Scholar]
- 15.Sirum-Connolly K., Peltier,J.M., Crain,P.F., McCloskey,J.A. and Mason,T.L. (1995) Implications of a functional large ribosomal RNA with only three modified nucleotides. Biochimie, 77, 30–39. [DOI] [PubMed] [Google Scholar]
- 16.Kowalak J.A., Bruenger,E., Hashizume,T., Peltier,J.M., Ofengand,J. and McCloskey,J.A. (1996) Structural characterization of U*-1915 in domain IV from Escherichia coli 23S ribosomal RNA as 3-methylpseudouridine. Nucleic Acids Res., 24, 688–693. [DOI] [PMC free article] [PubMed] [Google Scholar]
- 17.Dalluge J.J., Hamamoto,T., Horikoshi,K., Morita,R.Y., Stetter,K.O. and McCloskey,J.A. (1997) Posttranscriptional modification of tRNA in psychrophilic bacteria. J. Bacteriol ., 179, 1918–1923. [DOI] [PMC free article] [PubMed] [Google Scholar]
- 18.Ho N.W.Y. and Gilham,P.T. (1971) Reaction of pseudouridine and inosine with N-cyclohexyl-N′-β-(4-methylmorpholinium) ethylcarbodiimide. Biochemistry, 10, 3651–3657. [PubMed] [Google Scholar]
- 19.Kirpekar F., Douthwaite,S. and Roepstorff,P. (2000) Mapping posttranscriptional modifications in 5S ribosomal RNA by MALDI mass spectrometry. RNA, 6, 296–306. [DOI] [PMC free article] [PubMed] [Google Scholar]
- 20.Pieles U., Zürcher,W., Schär,M. and Moser,H.E. (1993) Matrix-assisted laser desorption ionization time-of-flight mass spectrometry: a powerful tool for the mass and sequence analysis of natural and modified oligonucleotides. Nucleic Acids Res., 21, 3191–3196. [DOI] [PMC free article] [PubMed] [Google Scholar]
- 21.Limbach P.A. (1996) Indirect mass spectrometric methods for characterizing and sequencing oligonucleotides. Mass Spectrom. Rev., 15, 297–336. [DOI] [PubMed] [Google Scholar]
- 22.Simmons T.A. and Limbach,P.A. (1997) The use of a co-matrix for improved MALDI-TOFMS analysis of oligonucleotides. Rapid Commun. Mass Spectrom., 11, 567–572. [Google Scholar]
- 23.Limbach P.A., Crain,P.F. and McCloskey,J.A. (1995) Characterization of oligonucleotides and nucleic acids by mass spectrometry. Curr. Opin. Biotechnol., 6, 96–102. [DOI] [PubMed] [Google Scholar]
- 24.Strupat K., Kampmeier,J. and Horneffer,V. (1997) Investigations of 2,5-DHB and succinic acid as matrices for UV and IR MALDI. Part II: Crystallographic and mass spectrometric analysis. Int. J. Mass Spectrom. Ion Process., 169/170, 43–50. [Google Scholar]
- 25.Ragas J.A., Simmons,T.A. and Limbach,P.A. (2000) Comparative study of methods for optimal sample preparation of oligonucleotides for matrix-assisted laser desorption/ionization mass spectrometry. Analyst, 125, 575–581. [DOI] [PubMed] [Google Scholar]
- 26.Limbach P.A., Crain,P.F. and McCloskey,J.A. (1994) Summary: the modified nucleosides of RNA. Nucleic Acids Res., 22, 2183–2196. [DOI] [PMC free article] [PubMed] [Google Scholar]