

Abstract
Cervical dystonia (CD) is the most common type of focal dystonia, causing abnormal movements of the neck and head. In this study, we used noninvasive imaging to investigate the motor system of patients with CD and uncover the neural correlates of dystonic symptoms. Furthermore, we examined whether a commonly prescribed anticholinergic medication in CD has an effect on the dystonia‐related brain abnormalities. Participants included 16 patients with CD and 16 healthy age‐matched controls. We collected functional MRI scans during a force task previously shown to extensively engage the motor system, and diffusion and T1‐weighted MRI scans from which we calculated free‐water and brain tissue densities. The dystonia group was also scanned ca. 2 h after a 2‐mg dose of trihexyphenidyl. Severity of dystonia was assessed pre‐ and post‐drug using the Burke–Fahn–Marsden Dystonia Rating Scale. Motor‐related activity in CD was altered relative to controls in the primary somatosensory cortex, cerebellum, dorsal premotor and posterior parietal cortices, and occipital cortex. Most importantly, a regression model showed that increased severity of symptoms was associated with decreased functional activity of the somatosensory cortex and increased activity of the cerebellum. Structural imaging measures did not differ between CD and controls. The single dose of trihexyphenidyl altered the fMRI signal in the somatosensory cortex but not in the cerebellum. Symptom severity was not significantly reduced post‐treatment. Findings show widespread changes in functional brain activity in CD and most importantly that dystonic symptoms relate to disrupted activity in the somatosensory cortex and cerebellum. Hum Brain Mapp 38:4563–4573, 2017. © 2017 Wiley Periodicals, Inc.
Keywords: cervical dystonia, MRI, sensorimotor cortex, cerebellum, trihexyphenidyl
INTRODUCTION
Cervical dystonia (CD) is the most common form of focal dystonia with adult onset, in which involuntary co‐contractions of the neck muscles produce abnormal postures and movements of the head and neck [Jankovic et al., 1991]. While the exact pathophysiology underlying CD remains unclear, significant advances are being made in understanding the brain changes associated with dystonia using noninvasive imaging methods such as resting‐state and task‐based functional magnetic resonance imaging (fMRI) [Battistella et al., 2015; Delnooz et al., 2013; Opavský et al., 2011, 2012; de Vries et al., 2008]. For instance, an fMRI study of imagined and executed flexion/extension movements of the wrists showed several regions of reduced brain activity in CD compared to controls including the premotor and parietal cortices, insula, and putamen [de Vries et al., 2008]. More recently, resting‐state fMRI was used to show that both task‐specific dystonias (spasmodic dysphonia, writer's cramp) and nontask‐specific dystonias (CD, blepharospasm) exhibit significant connectivity changes compared to controls, and these included abnormal expansion or shrinkage of neural communities such as the basal ganglia and cerebellum, loss of a pivotal region of information transfer in the premotor cortex, and connectivity reduction within the sensorimotor and frontoparietal regions [Battistella et al., 2015]. The results of these studies point to altered functional activity across multiple cortical and subcortical brain regions in CD, supporting the hypothesis of dystonia being a circuit, large‐scale network disorder [Battistella et al., 2015; Blood, 2013; Prudente et al., 2014; Tang et al., 2007; Teo et al., 2009; Tinazzi et al., 2009]. While functional imaging studies have consistently shown changes in brain activity in CD, structural imaging data tend to provide somewhat inconsistent findings, with some studies reporting increases, decreases, or both in gray and white matter integrity [Ramdhani and Simonyan, 2013].
Currently, there is an increased need for studies that assess the functional and/or structural correlates of dystonic symptoms and whether any abnormalities can be corrected or improved by current treatment options. The treatment protocol for CD typically includes injecting botulinum toxin into the affected muscles and/or oral medication [Evidente and Pappert, 2014]. One fMRI study of electrical median nerve stimulation has shown that a single session of botulinum toxin affected the initially disrupted somatosensory cortex in patients with CD by increasing its activity [Opavský et al., 2012]. By using resting‐state fMRI, researchers have identified abnormal functional connectivity within multiple neural networks in CD and showed that some of these networks seem to be partially restored by administration of botulinum toxin [Delnooz et al., 2013]. Among oral treatment options, anticholinergics have been consistently shown to provide a symptomatic effect and are often trialed in clinical practice to treat focal dystonias such as CD, but also generalized dystonias [Balash and Giladi, 2004; Burke et al., 1986; Cloud and Jinnah, 2010; Comella and Thompson, 2006]. Trihexyphenidyl, a muscarinic acetylcholine receptor antagonist, is the most commonly used agent in this drug class and it has been shown to reduce symptoms in both adults and children with dystonia, and is often prescribed in CD [Burke et al., 1986; Fahn, 1983; Jabbari et al., 1989; Pidcock et al., 1999]. The effects on the brain of trihexiphenidyl, a first‐line agent for treating CD, are currently unknown. In rodent models of DYT1, an acute injection with trihexyphenidyl reversed motor deficits and restored corticostriatal long‐term depression [Dang et al., 2012]. Pinpointing which structures of the brain respond to the acute treatment with this anticholinergic drug would benefit the field by providing more information on the underlying pathophysiology of CD and perhaps new targets to evaluate in studies that aim to reduce dystonic symptoms.
To gain further insight into the functional and structural brain changes that accompany CD, we utilized a pharmacologic multimodal imaging approach. The goals of this study were: (1) to investigate whether dystonic symptoms are related to differences in functional brain activity and brain structure between people with and without CD and (2) to examine whether a single dose of trihexyphenidyl has an effect on the functional and/or structural brain changes in CD. For testing differences in functional brain activity between CD and a control group, we selected a force production task that involves sequences of contraction–relaxation of the hand muscles and would allow us to probe the integrity of the motor‐related brain circuit. This fMRI protocol has been consistently shown to extensively engage cortical and subcortical brain regions such as the basal ganglia and cerebellum, which are thought to be involved in dystonia [Burciu et al., 2016a; Neely et al., 2015; Spraker et al., 2010]. The selection of this paradigm was also motivated by the need for a task that would not elicit a behavioral difference between CD and healthy individuals, therefore allowing an objective comparison of brain activity between groups. Structural brain differences between CD and controls were examined using free‐water diffusion MRI [Pasternak et al., 2009], and analyses of brain tissue classes. The study tested the following hypotheses: (1) dystonic symptoms will relate to differences in functional activity between CD and controls; (2) one dose of trihexyphenidyl will alter part of the affected functional network; and (3) one dose of trihexyphenidyl will not affect structural integrity of the brain as assessed with diffusion and structural MRI.
MATERIALS AND METHODS
Participants
Sixteen patients with CD and an equal number of age‐matched neurologically healthy controls participated in the study (Table 1). Patients were referred from the University of Florida Center for Movement Disorders and Neurorestoration, where they were diagnosed by a movement disorder specialist. All CD patients were receiving botulinum toxin treatment as part of their medical care routine. Four patients were also treated for depression. Typically a peak effect of botulinum toxin treatment occurs within 2–4 weeks following the injection, and on average injections are given every 12–14 weeks [van den Dool et al., 2013]. Here, all tests were performed at the end of botulinum toxin treatment cycle, 3.0 ± 0.7 months postinjection, on the day prior to the new injection. This provided a wash‐out period that would minimize any carryover effects of the botox treatment. Control participants were recruited by advertisements from the local communities in North Central Florida. The study was approved by the Institutional Review Board at the University of Florida, and written informed consent to participate in the research study was obtained from all participants.
Table 1.
Demographic and clinical characteristics of study cohort
| Demographics | clinical data | CON | CD | P values (FDR) | |||
|---|---|---|---|---|---|---|
| OFF | ON | CON vs CD OFF | CON vs CD ON | CD OFF vs CD ON | ||
| Sample size | 16 | 16 | – | – | – | – |
| Age, years | 57.0 (9.0) | 57.6 (11.5) | – | 0.953 | – | – |
| Gender (M | F) | 5 | 11 | 5 | 11 | – | 1.000 | – | – |
| Handedness (L | R) | 2 | 14 | 1 | 15 | – | 0.748 | – | – |
| Hand tested (L | R) | 7 | 9 | 6 | 10 | – | 0.879 | – | – |
| Hand tested (Dom | Non‐Dom) | 7 | 9 | 9 | 7 | – | 0.748 | – | – |
| Disease duration, years | – | 5.8 (4.0) | – | – | – | – |
| BFMDRS | – | 6.0 (6.8) | 5.3 (5.9) | – | – | 0.392 |
| Purdue Pegboard Test, bimanual | 22.0 (3.9) | 20.5 (3.2) | – | 0.457 | – | – |
| MVC, N | 67.5 (23.9) | 58.2 (19.3) | – | 0.457 | – | – |
| MoCA | 28.0 (1.3) | 27.2 (2.0) | – | 0.457 | – | – |
| BDI | 3.3 (2.9) | 12.6 (10.0) | – | 0.006* | – | – |
Data represent mean (± SD) or count. Statistically significant group differences are marked with an asterisk.
Abbreviations: BDI = Beck Depression Inventory, BFMDRS = Burke‐Fahn‐Marsden Dystonia Rating Scale, CD = cervical dystonia, CON = controls, Dom = dominant, F = female, FDR = False Discovery Rate, L = left, M = male, MoCA = Montreal Cognitive Assessment, MVC = maximum voluntary contraction, N = newton, OFF = off medication, ON = on medication, R = right, yrs = years.
Experimental Design and Clinical Assessment
Both CD and controls underwent functional and structural MRI, and a series of clinical tests: bimanual coordination task using the Purdue Pegboard Test (PPB) [Desrosiers et al., 1995], the Montreal Cognitive Assessment (MoCA) [Nasreddine et al., 2005], and the Beck Depression Inventory (BDI) [Beck et al., 1961]. The CD group only was also administered the Burke–Fahn–Marsden Dystonia Rating Scale (BFMDRS) [Burke et al., 1985].
Of note, functional and structural MRI was repeated in the CD group, after the administration of a single 2‐mg dose of trihexyphenidyl. Given that trihexyphenidyl is known to reach peak plasma concentrations in 2–3 h after oral administration and has a duration of action of 1–12 h [Lang and Lees, 2002], the second MRI session was scheduled approximately 2 h postdrug intake. Upon completion of the MRI protocol (ca. 3 h postdrug intake), the severity of dystonia was assessed one more time in the on‐medication state using the BFMDRS. Patients reported no adverse effect to the 2 mg dose of trihexyphenidyl. The before‐ and after‐drug states are referred throughout the manuscript as CD OFF and CD ON.
Force Data Acquisition
A pinch force task was used to assess motor‐related brain activity in CD and controls. While in the MRI scanner, participants produced force against a custom‐designed MRI‐compatible fiber optic transducer with a resolution of 0.025 N (Neuroimaging Solutions, Gainesville, FL). Force data were sampled at 125 Hz by an SM 130 Fiber Optic Interrogator (Micron Optics, Atlanta, GA), and recorded by a program written in LabVIEW (National Instruments, Austin, TX).
Force Generation Task
Participants were trained on the task outside the MRI scanner to avoid learning effects. At the beginning of the training session, we measured the maximum voluntary contraction (MVC) of the hand that was going to be tested in the scanner using a Jamar hydraulic pinch gauge on three consecutive trials. An average MVC value was used to normalize force data across participants such that during the task, each participant would be required to produce a force level equal to 15% MVC. Hand use was balanced within groups to avoid a potential influence of hand response/dominance on the behavioral and imaging results (Table 1). The fMRI protocol consisted of a block design that alternated force and rest blocks as follows: 30 s rest, 30 s force with performance feedback, 12.5 s rest, and 30 s force without performance feedback [Burciu et al., 2016a; Neely et al., 2015; Spraker et al., 2010]. This sequence was repeated four times. The scan ended with an additional 30 s rest block placed after the last force block. The total duration of the scan was 7.3 min. During the scan, a target and a force bar were displayed on an LCD monitor. Participants were instructed to produce force when the force bar was green (2 s), and relax when the force bar was red (1 s). Each force block was 10 trials. There were two force conditions. In the feedback condition, the force bar moved in the vertical plane according to the force output while the target bar remained stationary. Importantly, the location of the target bar varied unpredictably from one trial to another, and target amplitudes were selected such that the average amplitude across trials was 15% MVC. In the no‐feedback condition, timing of the force contractions was controlled by the same green and red bars. Participants were instructed to vary the force amplitude level for each pulse and not fall into a specific pattern. Of note, no feedback of force output was provided, as the force bar remained stationary.
Force Data Analysis
Consistent with previous work [Burciu et al., 2016a; Spraker et al., 2010], we filtered force output using a 10th‐order Butterworth filter with a cutoff frequency of 15 Hz, and calculated the following force parameters: mean force, standard deviation of force, mean rate of change during the ramp up to the target (rate up), and mean rate of change during the decrease to baseline (rate down).
MRI Data Acquisition Protocol
MR images were collected using a 3 T scanner equipped with a 32‐channel SENSE head coil (Philips Achieva, Best, The Netherlands) and consisted of (a) a T2*‐weighted, single‐shot, echo‐planar pulse sequence (TR = 2500 ms, TE = 30 ms, flip angle = 80°, FOV = 240 mm2, voxel size = 3 mm isotropic); (b) a single‐shot spin echo EPI sequence (TR = 7,748 ms, TE = 86 ms, flip angle = 90°, FOV = 224 mm2, voxel size = 2 mm isotropic, diffusion gradient timing DELTA/delta = 42.4/10 ms, b values 0, 1,000/mm2, fat suppression using SPIR, in‐plane, SENSE factor = 2); and (c) an anatomical 3D T1‐weighted sequence (TR = 8.2 ms, TE = 3.7 ms, flip angle = 8°, FOV = 240 mm2, voxel size = 1 mm isotropic).
Functional MRI Data Analysis
Functional MRI data preprocessing and analysis were performed using Analysis of Functional Neuroimages (AFNI, http://afni.nimh.nih.gov/afni/) except for the normalization of the cerebellum, which was done using SUIT toolbox [Diedrichsen, 2006] (http://www.diedrichsenlab.org/imaging/suit) running in Statistical Parametric Mapping (SPM8, http://www.fil.ion.ucl.ac.uk/spm/). Consistent with previous research [Burciu et al., 2016b; Neely et al., 2015; Spraker et al., 2010], the fMRI and T1‐weighted scans of participants who performed the task with the left hand were flipped along the midline. Next, the following preprocessing steps were applied: slice timing and head motion correction, normalization of the signal in each voxel at each time point by the mean of its time series, registration of each volume of the functional data to its first volume, co‐registration of the functional scan with the structural scan, spatial normalization of the structural scan to the MNI152 template for the analysis of the cortex and SUIT template for the analysis of the cerebellum, reslicing of the functional scan in MNI space using the normalization parameters from the previous step, smoothing of the functional scan with a Gaussian kernel of 4 mm full‐width at half‐maximum, and regression of the data to a simulated hemodynamic response function for the task sequence using the 3dDeconvolve function in AFNI. On both the normalized cortex and cerebellum, we performed ANOVAs to compare motor‐related brain activity between controls and CD OFF. Prior to contrasting functional brain activity between the two groups, we tested for the presence/absence of a group by force condition interaction. If no group by force condition interaction was found, the functional activity was averaged across the two conditions, increasing statistical power. Results were corrected for Type I error using a Monte‐Carlo simulation, and considered significant if they met a threshold of P < 0.001 with a minimum cluster size of 189 mm3 (P < 0.05, corrected using the new ACF approach incorporated in the 3dClustSim function in AFNI). For the regions where brain activity differed significantly between CD OFF and controls, we calculated percent signal change at each TR. Consistent with previous work using the fMRI force production protocol [Burciu et al., 2016a], we averaged percent signal change across 6TRs toward the end of each block, and across force blocks. This value was used to relate functional brain activity with the severity of dystonic symptoms, and evaluate any effect of anticholinergic medication on the functional activity of the regions related to dystonia.
Diffusion MRI Data Analysis
FMRIB Software Library (FSL, http://www.fmrib.ox.ac.uk/fsl/) and custom UNIX shell scripts were used to preprocess the diffusion MRI data, and a custom code written in MATLAB R2013a (The Mathworks, Natick, MA) was used to further calculate free‐water (FW) and free‐water corrected FA (FAt) maps [Ofori et al., 2015; Pasternak et al., 2009; Planetta et al., 2015]. Regions of interest (ROIs) were hand‐drawn on the b‐zero image of each subject in MNI space, and then used to extract values from the normalized FW and FAt maps. Bilateral ROIs were drawn in the following areas (no. of voxels per hemisphere): caudate (n = 30), putamen (n = 45), globus pallidus (n = 42), subthalamic nucleus (n = 8), anterior substantia nigra (n = 8), posterior substantia nigra (n = 8), pedunculopontine nucleus (n = 8), red nucleus (n = 8), superior cerebellar peduncle (n = 8), middle cerebellar peduncle (n = 18), inferior cerebellar peduncle (n = 10), cerebellum lobule V (n = 45), cerebellum lobule VI (n = 66), cerebellum Crus I (n = 50), superior cerebellar vermis (n = 18), inferior cerebellar vermis (n = 18), dentate nucleus (n = 20), thalamus (n = 27), genu of the corpus callosum (n = 41), and splenium of the corpus callosum (n = 41) (Fig. 1). Consistent with previous methodology [Ofori et al., 2015; Planetta et al., 2015], FW and FAt values were averaged across hemispheres.
Figure 1.
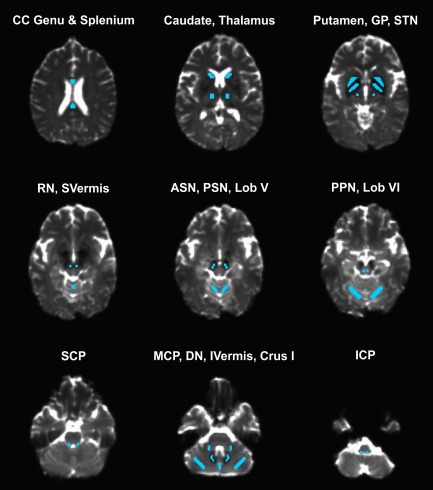
Regions of interest (ROIs) for the diffusion MRI analysis. Abbreviations: ASN = anterior substantia nigra; CC = corpus callosum; DN = dentate nucleus; GP = globus pallidus; ICP = inferior cerebellar peduncle; IVermis = inferior portion of the cerebellar vermis; MCP; middle cerebellar peduncle; Lob V = lobule V of the cerebellum; Lob VI = lobule VI of the cerebellum; PSN = posterior substantia nigra; RN = red nucleus; SCP = superior cerebellar peduncle; STN = subthalamic nucleus; SVermis = superior portion of the cerebellar vermis. [Color figure can be viewed at http://wileyonlinelibrary.com]
Voxel‐Based Morphometry Analysis
Data processing was performed using VBM8 toolbox (http://www.neuro.uni-jena.de/vbm/) in SPM8. Briefly, T1‐weighted images were bias corrected, tissue classified into gray matter (GM) and white matter (WM) that were normalized to a standard template using DARTEL (MNI for the cerebrum, SUIT for the cerebellum), modulated nonlinearly, smoothed with a Gaussian kernel (8 mm for the cerebrum and 4 mm for the cerebellum), and input in a statistical model that evaluated differences in GM and WM density between controls and CD patients at P < 0.05 (FWE corrected).
Statistical Analysis
Statistical analyses were performed with IBM SPSS Statistics 24 (SPSS Inc., Chicago, Illinois), and the results were corrected for multiple comparisons using the Benjamini–Hochberg false discovery rate (FDR) method at P FDR < 0.05 [Benjamini and Hochberg, 1995]. Between‐group differences in gender distribution, handedness, and hand tested (L/R, dominant/nondominant) were examined using Pearson's Chi‐square. A MANOVA was used to assess differences between CD patients and healthy controls in age, MVC, MoCA, BDI, and bimanual coordination based on PPB. MANOVAs were also used to evaluate group differences in force parameters, and diffusion outcome measures. To explore the relation between the severity of dystonic symptoms and functional brain activity, we performed a multiple regression analysis using the backward elimination method. The predictors were the percent signal change values corresponding to the brain regions, where functional activity differed between CD OFF and controls, while the dependent variable was the BFMDRS OFF. We also tested whether functional activity in these regions was influenced in any way by nonmotor functions such as cognitive status and depression score. For this, we ran additional multiple regression analyses, using the MoCA/BDI scores. Finally, for the brain regions that were significantly related to dystonic symptoms, we also calculated percent signal change in the ON medication condition, and used a paired‐samples t test to examine drug‐related differences, by comparing CD OFF and CD ON. Specifically, the paired‐samples t test was performed on the 6 TRs toward the end of the force block, after the ramping up and before the ramping down of the BOLD signal, consistent with previous work using a force production fMRI protocol [Burciu et al., 2016a; Spraker et al., 2010].
RESULTS
Clinical and Force Data
Table 1 summarizes the clinical and demographic characteristics of the study cohorts, and between‐group statistics. There were no significant differences between CD and controls in age, MVC, MoCA, and PPB bimanual coordination score (P FDR > 0.05). Also, the distribution of males/females, and whether the hand tested was the left/right or dominant/nondominant hand did not differ between the two groups (P FDR > 0.05). CD and controls did however differ on BDI (P = 0.006) with patients having a higher score on the depression scale than controls. Importantly, because no group by force interaction was found in the fMRI results, force task performance was collapsed across the two feedback conditions. Force parameters (i.e., mean force, SD of force, rate up, and rate down) did not differ between CD and controls and did not change with the administration of trihexyphenidyl to patients (P FDR > 0.05). There was no statistically significant change in the BFMDRS score postdrug compared to before drug (P FDR > 0.05, Table 1).
Functional MRI
Consistent with previous studies [Burciu et al., 2016a; Spraker et al., 2010], we found no group by performance feedback interaction. Therefore, prior to assessing group differences in motor‐related activity we collapsed across the two force conditions. When compared to controls, CD OFF presented a pattern of activation that included reduced functional activity in primary somatosensory cortex (S1) bilaterally, right supramarginal gyrus, and increased functional activity in right dorsal premotor cortex, right lobule VI of the cerebellum, left inferior temporal gyrus, and left middle occipital gyrus (Table 2 and Fig. 2A). Functional activity in the following sensorimotor regions predicted symptom severity as assessed by BFMDRS (F = 13.80, P = 0.001, R 2 = 0.680) (Fig. 2B): right S1 (std. beta = −0.694, t = −4.318, P FDR = 0.002), and right lobule VI of the cerebellum (std. beta = 0.619, t = 3.853, P FDR = 0.002). That is, increased symptom severity was related to reduced functional activity in S1 and increased functional activity in lobule VI of the cerebellum. Functional activity in the regions where group differences were found did not relate to MoCA or BDI scores (P FDR > 0.05).
Table 2.
Task‐based fMRI results
| CON vs CD OFF | Brain regions | Side | Cluster size, mm3 | Peak MNI coord. | F value | ||
|---|---|---|---|---|---|---|---|
| X | Y | Z | |||||
| CON > CD OFF | S1 | R | 459 | 57 | −24 | 39 | 25.67 |
| CON > CD OFF | S1 | L | 297 | −60 | −22 | 44 | 14.57 |
| CON > CD OFF | Supramarginal gyrus | R | 189 | 63 | −33 | 42 | 17.59 |
| CD OFF > CON | Cerebellum, lobule VI | R | 352 | 28 | −52 | −21 | 14.79 |
| CD OFF > CON | PMd | R | 270 | 39 | 3 | 57 | 30.25 |
| CD OFF > CON | Inferior temporal gyrus | L | 216 | −48 | −51 | −12 | 12.01 |
| CD OFF > CON | Middle temporal gyrus | L | 216 | −27 | −87 | 18 | 15.69 |
Abbreviations: CD = cervical dystonia, CON = controls, L = left, MNI Coord = coordinates in MNI space, OFF = off medication, PMd = dorsal premotor cortex, R = right, S1 = primary somatosensory cortex.
Figure 2.
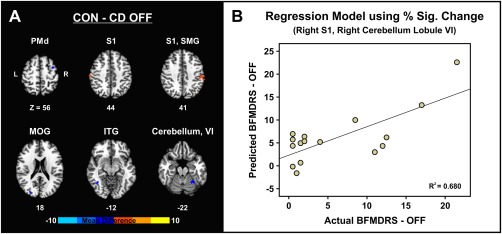
Differences in task‐related fMRI activity between controls and CD patients tested off medication (A). Regression model illustrating the relation between dystonic symptoms off medication as assessed by BFMDRS and the predicted values for BFMDRS off medication based on the percent signal change in the right primary somatosensory cortex, and right lobule VI of the cerebellum (B). Abbreviations: CD OFF = cervical dystonia off medication; CON = controls; ITG = inferior temporal gyrus; L = left; MOG = middle occipital gyrus; PMd = dorsal premotor cortex; R = right; S1 = primary somatosensory cortex; SMG = supramarginal gyrus. [Color figure can be viewed at http://wileyonlinelibrary.com]
The analysis comparing percent signal change in the two regions related to dystonic symptoms before and after the administration of trihexyphenidyl revealed a significant increase in signal ON medication compared to OFF condition in the right S1 (P FDR = 0.024), but not in the right lobule VI of the cerebellum (P FDR = 0.909) (Fig. 3).
Figure 3.
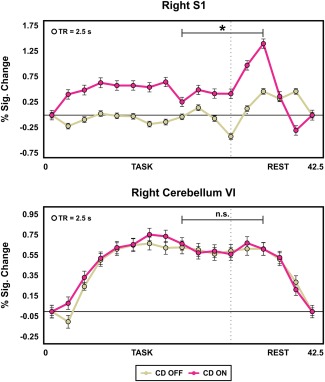
The two plots show the percent signal change at each TR (averaged across task/rest blocks) in the regions that differed between CD OFF and controls in the voxel‐wise analysis, and where functional brain activity related to dystonic symptoms (i.e., right S1 and right lobule VI of the cerebellum) plotted for CD OFF and ON medication. The bracket indicates the time window (6 TRs) used to evaluate the effect of 2 mg of trihexyphenidyl on the functional activity in the dystonia‐related brain regions. This interval toward the end of the task was chosen based on previous work using a force production fMRI protocol [Burciu et al., 2016a]. The asterisk indicates a significant drug effect on the functional activity of S1 during the a priori selected 6‐TR time window. Abbreviations: CD OFF = cervical dystonia off medication; CD ON = cervical dystonia on medication; n.s. = nonsignificant; s = seconds; S1 = primary somatosensory cortex. [Color figure can be viewed at http://wileyonlinelibrary.com]
Structural MRI
Table 3 lists the FW and FAt values for each ROI and group. The statistical analysis of the diffusion data did not reveal a significant difference in mean FW or mean FAt between CD and controls in any of the ROIs. Moreover, mean FW and mean FAt values in the prespecified ROIs did not change significantly with the administration of trihexyphenidyl. VBM analysis revealed no abnormality in cerebral or cerebellar GM/WM density in CD relative to controls, or drug changes in these measures.
Table 3.
Diffusion MRI data
| Variables | CON | CD | P values (FDR) | |||
|---|---|---|---|---|---|---|
| OFF | ON | CON vs CD OFF | CON vs CD ON | CD OFF vs CD ON | ||
| Free water | ||||||
| Caudate | 0.20 (0.04) | 0.19 (0.03) | 0.21 (0.05) | 0.729 | 0.789 | 0.586 |
| Putamen | 0.13 (0.02) | 0.13 (0.01) | 0.14 (0.03) | 0.899 | 0.789 | 0.993 |
| GP | 0.13 (0.04) | 0.13 (0.03) | 0.15 (0.04) | 0.825 | 0.620 | 0.586 |
| STN | 0.10 (0.02) | 0.11 (0.02) | 0.11 (0.01) | 0.729 | 0.789 | 0.993 |
| Substantia nigra, anterior | 0.18 (0.04) | 0.19 (0.04) | 0.19 (0.03) | 0.729 | 0.789 | 0.993 |
| Substantia nigra, posterior | 0.18 (0.02) | 0.19 (0.04) | 0.19 (0.04) | 0.729 | 0.789 | 0.993 |
| PPN | 0.10 (0.03) | 0.12 (0.02) | 0.12 (0.02) | 0.250 | 0.534 | 0.586 |
| Red nucleus | 0.09 (0.01) | 0.09 (0.01) | 0.09 (0.01) | 0.890 | 0.789 | 0.848 |
| Superior cerebellar peduncle | 0.23 (0.05) | 0.27 (0.06) | 0.27 (0.07) | 0.250 | 0.428 | 0.993 |
| Middle cerebellar peduncle | 0.07 (0.01) | 0.07 (0.01) | 0.07 (0.01) | 0.729 | 0.972 | 0.710 |
| Inferior cerebellar peduncle | 0.19 (0.06) | 0.20 (0.05) | 0.22 (0.06) | 0.890 | 0.620 | 0.586 |
| Cerebellum, Lob. V | 0.14 (0.03) | 0.17 (0.04) | 0.16 (0.04) | 0.284 | 0.620 | 0.586 |
| Cerebellum, Lob. VI | 0.15 (0.02) | 0.18 (0.05) | 0.18 (0.04) | 0.250 | 0.340 | 0.993 |
| Cerebellum, Lob. Crus I | 0.17 (0.05) | 0.18 (0.04) | 0.17 (0.03) | 0.729 | 0.972 | 0.710 |
| Cerebellum, superior vermis | 0.19 (0.05) | 0.21 (0.05) | 0.21 (0.07) | 0.729 | 0.904 | 0.710 |
| Cerebellum, inferior vermis | 0.16 (0.02) | 0.18 (0.07) | 0.18 (0.05) | 0.729 | 0.487 | 0.586 |
| Dentate nucleus | 0.12 (0.01) | 0.13 (0.01) | 0.13 (0.02) | 0.729 | 0.340 | 0.586 |
| Thalamus | 0.13 (0.01) | 0.13 (0.02) | 0.14 (0.01) | 0.729 | 0.340 | 0.848 |
| Corpus callosum, genu | 0.15 (0.02) | 0.17 (0.03) | 0.17 (0.02) | 0.250 | 0.340 | 0.993 |
| Corpus callosum, splenium | 0.15 (0.03) | 0.16 (0.02) | 0.16 (0.03) | 0.891 | 0.972 | 0.993 |
| Fat | ||||||
| Caudate | 0.19 (0.01) | 0.19 (0.02) | 0.19 (0.02) | 0.838 | 0.558 | 0.710 |
| Putamen | 0.18 (0.04) | 0.20 (0.03) | 0.20 (0.03) | 0.611 | 0.497 | 0.966 |
| GP | 0.39 (0.05) | 0.40 (0.06) | 0.40 (0.06) | 0.695 | 0.778 | 0.967 |
| STN | 0.50 (0.03) | 0.51 (0.03) | 0.51 (0.02) | 0.695 | 0.497 | 0.966 |
| Substantia nigra, anterior | 0.62 (0.07) | 0.63 (0.06) | 0.64 (0.06) | 0.695 | 0.497 | 0.710 |
| Substantia Nigra, Posterior | 0.60 (0.06) | 0.62 (0.04) | 0.62 (0.05) | 0.671 | 0.514 | 0.710 |
| PPN | 0.66 (0.05) | 0.69 (0.05) | 0.70 (0.06) | 0.471 | 0.472 | 0.883 |
| Red Nucleus | 0.52 (0.04) | 0.55 (0.04) | 0.56 (0.05) | 0.471 | 0.472 | 0.710 |
| Superior cerebellar peduncle | 0.80 (0.05) | 0.81 (0.03) | 0.81 (0.04) | 0.695 | 0.796 | 0.820 |
| Middle cerebellar peduncle | 0.71 (0.05) | 0.71 (0.05) | 0.72 (0.06) | 0.695 | 0.675 | 0.820 |
| Inferior cerebellar peduncle | 0.46 (0.06) | 0.49 (0.04) | 0.50 (0.04) | 0.471 | 0.472 | 0.967 |
| Cerebellum, Lob. V | 0.25 (0.02) | 0.25 (0.02) | 0.25 (0.02) | 0.611 | 0.558 | 0.967 |
| Cerebellum, Lob. VI | 0.24 (0.02) | 0.24 (0.01) | 0.24 (0.01) | 0.611 | 0.497 | 0.883 |
| Cerebellum, Lob. Crus I | 0.26 (0.02) | 0.25 (0.03) | 0.25 (0.02) | 0.611 | 0.497 | 0.820 |
| Cerebellum, superior vermis | 0.22 (0.03) | 0.20 (0.02) | 0.20 (0.01) | 0.180 | 0.290 | 0.710 |
| Cerebellum, inferior vermis | 0.25 (0.03) | 0.24 (0.03) | 0.27 (0.11) | 0.611 | 0.558 | 0.820 |
| Dentate nucleus | 0.38 (0.05) | 0.36 (0.04) | 0.37 (0.03) | 0.611 | 0.698 | 0.820 |
| Thalamus | 0.32 (0.02) | 0.34 (0.01) | 0.34 (0.02) | 0.360 | 0.290 | 0.820 |
| Corpus callosum, genu | 0.87 (0.03) | 0.86 (0.03) | 0.86 (0.03) | 0.471 | 0.497 | 0.967 |
| Corpus callosum, splenium | 0.88 (0.03) | 0.90 (0.02) | 0.89 (0.02) | 0.471 | 0.497 | 0.710 |
Data represent mean (± SD).
Abbreviations: CD = cervical dystonia, CON = controls, FAt, = fractional anisotropy corrected for free‐water, FDR = False Discovery Rate, GP = globus pallidus, Lob = lobule, PPN = pedunculopontine nucleus, STN = subthalamic nucleus.
DISCUSSION
In this study, a pharmacologic multimodal imaging approach was used to examine motor‐related brain activity and brain structure in patients with CD compared to controls, and whether group differences in imaging outcomes relate to dystonic symptoms and respond to acute treatment with a first‐line anticholinergic agent. The results show widespread cortical and subcortical alterations in brain activity in CD. A key finding was that the level of functional activity in S1 and cerebellum was related to the severity of dystonic symptoms. Furthermore, we showed that the administration of one dose of trihexyphenidyl was associated with changes in the functional activity of S1 but not cerebellum. Finally, we found no structural brain differences between CD and controls, and no effect of acute anticholinergic therapy on these measures.
First, the results of this study show that the execution of a manual force control task was not affected in CD compared to controls. The lack of group differences in behavior is desirable in fMRI studies of force production, as it has been shown that the degree of muscle activation (force and EMG) influences the fMRI signal in several cortical motor regions [Dai et al., 2001]. Here, we provided an objective way of evaluating brain activity in CD relative to controls without the confound of differences in movement execution, and showed significant abnormalities in the functional activity of S1, anterior cerebellum, dorsal premotor and posterior parietal cortices, and occipital cortex. These results suggest changes across a large network not limited to the somatotopic representation of the affected body part (i.e., neck). Although the direction of functional changes described in the literature (increased vs decreased activity) may be task‐/modality‐dependent, the findings here support the concept that CD is a disorder affecting large‐scale functional brain networks [Battistella et al., 2015; Delnooz et al., 2013; Opavský et al., 2011].
Importantly, we showed that the fMRI activity in two brain regions where group differences were found was related to the severity of dystonia as assessed by BFMDRS. Specifically, the increased severity of dystonic symptoms was associated with reduced functional activity in S1 and increased functional activity in the anterior portion of the cerebellum. A recent fMRI study in CD revealed that head rotation in the direction of dystonic head rotation is related to hyperactivity in the anterior cerebellum and that head rotation in the opposite direction is associated with increased activity in the sensorimotor cortex [Prudente et al., 2016]. Together, these findings reinforce the view that both cortical and subcortical sensorimotor abnormalities are likely to contribute to dystonic symptoms in this patient population [Løkkegaard et al., 2016; Prudente et al., 2014], and both S1 and cerebellum could be targets for intervention in studies looking for ways to reduce symptoms in CD.
Of interest, the BFMDRS score did not significantly change following treatment with trihexyphnidyl. While statistically significant peak effects/clinical benefit was not achieved with the acute administration of trihexyphenidyl, the 2 mg dose appears to have partially modulated the signal in a region of the brain where motor‐related fMRI activity differed between CD and controls and was related to symptoms in CD. Statistical tests performed on the percent signal change in S1 and cerebellum indicated an increase in the initially reduced functional activity in S1 following the administration of trihexyphenidyl. There was no change postdrug in the anterior cerebellum, which remained hyperactive. These results complement the existing literature showing that similar to the botulinum toxin treatment [Opavský et al., 2012] anticholinergic oral medication may modulate impaired somatosensory activation in CD. The current data suggest that acute anticholinergic treatment in CD acted upon one region within the affected network and raise the provocative question as to whether multiple regions or alternatively the cerebellum must be targeted in order to significantly reduce clinical symptoms in these patients. The lack of a drug effect on the cerebellum and the mild improvement of symptoms suggest that adjustments in the titration and chronic treatment may be required to reach a significant benefit. Peak effect of some medications such as trihexyphenidyl may not be evident until the dose is held constant for 2–4 weeks [Termsarasab et al., 2016].
Of note, we found no significant differences in structural MRI measures between CD and controls in free‐water and free‐water corrected FA measures across multiple cortical and subcortical brain regions, or in GM and WM density. These results are not entirely surprising given that structural studies in CD have yielded variable results. Some results show no differences in mean fractional anisotropy or mean diffusivity between craniocervical dystonia and controls [Pinheiro et al., 2015], or show FA differences between CD and controls in the corpus callosum and putamen [Fabbrini et al., 2008; Ramdhani et al., 2014]. As for structural differences in CD, studies have shown either increased GM density in the globus pallidus, cerebellum, and motor cortex [Draganski et al., 2003], or decreased GM density in the putamen, middle frontal gyrus, and visual cortex [Obermann et al., 2007; Ramdhani et al., 2014]. The inconsistency of results in structural imaging studies may be related to differences in cohort characteristics (e.g., age, disease duration, severity of symptoms, lumping together various forms of craniocervical dystonias), differences in data analysis methodology (e.g., whole‐brain, small volume correction analyses), and statistical cutoff points used to reject a null hypothesis. Here, the lack of significant diffusion differences using a region of interest approach and macrostructural differences in tissue density using VBM is insufficient to exclude subtle structural changes in this disease. Results draw attention to the growing need for longitudinal assessments and studies in larger groups of patients, which have the potential to answer the question whether CD is a functional circuit disorder with no primary or at least no early major involvement of structural changes. Also, there is an increased need for studies that examine CD patients who have not been treated with botulinum toxin injections. Of note, although CD patients participating in this study were tested ca. 3 months after their last botulinum toxin injection, the potential interference of botox effects on the results cannot be ruled out. The involvement of other brain regions in CD may have been masked by the chronic administration of botox.
In summary, the results of this study demonstrate widespread abnormalities in functional brain activity in CD, and an association between increased severity of dystonic symptoms and reduced functional activity in S1 and increased functional activity in the cerebellum. Along with the results pertaining to the effect of an acute dose of anticholinergic medication on cortical sensorimotor activity but not cerebellar activity, these findings provide new insights into pathophysiology of the disease and may spur the development of new treatment actions in CD by providing targets (e.g., S1 and/or cerebellum) for clinical or drug interventions.
FINANCIAL DISCLOSURES
Dr Roxana G. Burciu reports no disclosures.
Dr Christopher W. Hess (Dr Hess) has received personal compensation as a research committee member for the Michael J. Fox Foundation and has served as a speaker for the Davis Phinney Foundation the National Parkinson Foundation. He has received grant support from the University of Florida and has participated in CME and educational activities on movement disorders sponsored by Allergan, Ipsen, Mertz Pharma, PeerView Press, and QuantiaMD.
Dr Stephen A. Coombes (Dr Coombes) has received grant support from NIH, American Heart Association, and the James and Esther King Biomedical Research Program. He is the co‐founder and manager of Neuroimaging Solutions, LLC.
Dr Edward Ofori reports no disclosures.
Dr Priyank Shukla reports no disclosures.
Mr Jae‐Woo Chung reports no disclosures.
Dr Nikolaus R. McFarland reports grants from the NIH and the Michael J. Fox Foundation. He has received personal honoraria from the NIH and the American Academy of Neurology.
Dr Aparna Wagle Shukla reports grants from the NIH and has received grant support from Benign Essential Blepharospasm Research Foundation, Dystonia Coalition, Dystonia Medical Research Foundation.
Dr Okun serves as a consultant for the National Parkinson Foundation, and has received research grants from NIH, NPF, the Michael J. Fox Foundation, the Parkinson Alliance, Smallwood Foundation, the Bachmann‐Strauss Foundation, the Tourette Syndrome Association, and the UF Foundation. Dr Okun's DBS research is supported by R01NR014852 and R01NS096008. Dr Okun has previously received honoraria, but in the past >60 months has received no support from industry. Dr Okun has received royalties for publications with Demos, Manson, Amazon, Smashwords, Books4Patients, and Cambridge (movement disorders books). Dr Okun is an associate editor for New England Journal of Medicine Journal Watch Neurology. Dr Okun has participated in CME and educational activities on movement disorders (in the last 36) months sponsored by PeerView, Prime, QuantiaMD, WebMD, Medicus, MedNet, Henry Stewart, and by Vanderbilt University. The institution and not Dr Okun receives grants from Medtronic, Abbvie, Allergan, and ANS/St. Jude, and the PI has no financial interest in these grants. Dr Okun has participated as a site PI and/or co‐I for several NIH, foundation, and industry sponsored trials over the years but has not received honoraria.
Dr David E. Vaillancourt (Dr Vaillancourt) has received grant support from NIH, Bachmann‐Strauss Foundation, and Tyler's Hope Foundation. He is the co‐founder and manager of Neuroimaging Solutions, LLC.
ACKNOWLEDGMENT
The authors would like to thank all participants for their time and commitment to this research.
REFERENCES
- Balash Y, Giladi N (2004): Efficacy of pharmacological treatment of dystonia: Evidence‐based review including meta‐analysis of the effect of botulinum toxin and other cure options. Eur J Neurol 11:361–370. [DOI] [PubMed] [Google Scholar]
- Battistella G, Termsarasab P, Ramdhani RA, Fuertinger S, Simonyan K (2015): Isolated focal dystonia as a disorder of large‐scale functional networks. Cereb Cortex pii:bhv313. [DOI] [PMC free article] [PubMed] [Google Scholar]
- Beck AT, Ward CH, Mendelson M, Mock J, Erbaugh J (1961): An inventory for measuring depression. Arch Gen Psychiatry 4:561–571. [DOI] [PubMed] [Google Scholar]
- Benjamini Y, Hochberg Y (1995): Controlling the false discovery rate: A practical and powerful approach to multiple testing. J R Stat Soc Ser B Methodol 57:289–300. [Google Scholar]
- Blood AJ (2013): Imaging Studies in Focal Dystonias: A systems level approach to studying a systems level disorder. Curr Neuropharmacol 11:3–15. [DOI] [PMC free article] [PubMed] [Google Scholar]
- Burciu RG, Chung JW, Shukla P, Ofori E, Li H, McFarland NR, Okun MS, Vaillancourt DE (2016a): Functional MRI of disease progression in Parkinson disease and atypical parkinsonian syndromes. Neurology 87:709–717. [DOI] [PMC free article] [PubMed] [Google Scholar]
- Burciu RG, Ofori E, Shukla P, Pasternak O, Chung JW, McFarland NR, Okun MS, Vaillancourt DE (2016b): Free‐water and BOLD imaging changes in Parkinson's disease patients chronically treated with a MAO‐B inhibitor. Hum Brain Mapp 37:2894–2903. [DOI] [PMC free article] [PubMed] [Google Scholar]
- Burke RE, Fahn S, Marsden CD (1986): Torsion dystonia: A double‐blind, prospective trial of high‐dosage trihexyphenidyl. Neurology 36:160–164. [DOI] [PubMed] [Google Scholar]
- Burke RE, Fahn S, Marsden CD, Bressman SB, Moskowitz C, Friedman J (1985): Validity and reliability of a rating scale for the primary torsion dystonias. Neurology 35:73–77. [DOI] [PubMed] [Google Scholar]
- Cloud LJ, Jinnah HA (2010): Treatment strategies for dystonia. Expert Opin Pharmacother 11:5–15. [DOI] [PMC free article] [PubMed] [Google Scholar]
- Comella CL, Thompson PD (2006): Treatment of cervical dystonia with botulinum toxins. Eur J Neurol 13: 16–20. [DOI] [PubMed] [Google Scholar]
- Dai TH, Liu JZ, Sahgal V, Brown RW, Yue GH (2001): Relationship between muscle output and functional MRI‐measured brain activation. Exp Brain Res 140:290–300. [DOI] [PubMed] [Google Scholar]
- Dang MT, Yokoi F, Cheetham CC, Lu J, Vo V, Lovinger DM, Li Y (2012): An anticholinergic reverses motor control and corticostriatal LTD deficits in Dyt1 ΔGAG knock‐in mice. Behav Brain Res 226:465–472. [DOI] [PMC free article] [PubMed] [Google Scholar]
- Delnooz CCS, Pasman JW, Beckmann CF, van de Warrenburg BPC (2013): Task‐free functional MRI in cervical dystonia reveals multi‐network changes that partially normalize with botulinum toxin. PLoS ONE 8:e62877. [DOI] [PMC free article] [PubMed] [Google Scholar]
- Desrosiers J, Hébert R, Bravo G, Dutil E (1995): The Purdue Pegboard Test: Normative data for people aged 60 and over. Disabil Rehabil 17:217–224. [DOI] [PubMed] [Google Scholar]
- Diedrichsen J (2006): A spatially unbiased atlas template of the human cerebellum. NeuroImage 33:127–138. [DOI] [PubMed] [Google Scholar]
- van den Dool J, Visser B, Koelman JHT, Engelbert RH, Tijssen MA (2013): Cervical dystonia: Effectiveness of a standardized physical therapy program; study design and protocol of a single blind randomized controlled trial. BMC Neurol 13:85. [DOI] [PMC free article] [PubMed] [Google Scholar]
- Draganski B, Thun‐Hohenstein C, Bogdahn U, Winkler J, May A (2003): “Motor circuit” gray matter changes in idiopathic cervical dystonia. Neurology 61:1228–1231. [DOI] [PubMed] [Google Scholar]
- Evidente VGH, Pappert EJ (2014): Botulinum toxin therapy for cervical dystonia: The science of dosing. Tremor Hyperkinetic Mov 4:273. [DOI] [PMC free article] [PubMed] [Google Scholar]
- Fabbrini G, Pantano P, Totaro P, Calistri V, Colosimo C, Carmellini M, Defazio G, Berardelli A (2008): Diffusion tensor imaging in patients with primary cervical dystonia and in patients with blepharospasm. Eur J Neurol 15:185–189. [DOI] [PubMed] [Google Scholar]
- Fahn S (1983): High dosage anticholinergic therapy in dystonia. Neurology 33:1255–1261. [DOI] [PubMed] [Google Scholar]
- Jabbari B, Scherokman B, Gunderson CH, Rosenberg ML, Miller J (1989): Treatment of movement disorders with trihexyphenidyl. Mov Disord 4:202–212. [DOI] [PubMed] [Google Scholar]
- Jankovic J, Leder S, Warner D, Schwartz K (1991): Cervical dystonia: Clinical findings and associated movement disorders. Neurology 41:1088–1091. [DOI] [PubMed] [Google Scholar]
- Lang AE, Lees A (2002): Management of Parkinson's disease: An evidence‐based review. Mov Disord 17:S1–166. [DOI] [PubMed] [Google Scholar]
- Løkkegaard A, Herz DM, Haagensen BN, Lorentzen AK, Eickhoff SB, Siebner HR (2016): Altered sensorimotor activation patterns in idiopathic dystonia‐an activation likelihood estimation meta‐analysis of functional brain imaging studies. Hum Brain Mapp 37:547–557. [DOI] [PMC free article] [PubMed] [Google Scholar]
- Nasreddine ZS, Phillips NA, Bédirian V, Charbonneau S, Whitehead V, Collin I, Cummings JL, Chertkow H (2005): The Montreal Cognitive Assessment, MoCA: A brief screening tool for mild cognitive impairment. J Am Geriatr Soc 53:695–699. [DOI] [PubMed] [Google Scholar]
- Neely KA, Kurani AS, Shukla P, Planetta PJ, Wagle Shukla A, Goldman JG, Corcos DM, Okun MS, Vaillancourt DE (2015): Functional brain activity relates to 0–3 and 3–8 Hz force oscillations in essential tremor. Cereb Cortex 25:4191–4202. [DOI] [PMC free article] [PubMed] [Google Scholar]
- Obermann M, Yaldizli O, De Greiff A, Lachenmayer ML, Buhl AR, Tumczak F, Gizewski ER, Diener H‐C, Maschke M (2007): Morphometric changes of sensorimotor structures in focal dystonia. Mov Disord 22:1117–1123. [DOI] [PubMed] [Google Scholar]
- Ofori E, Pasternak O, Planetta PJ, Li H, Burciu RG, Snyder AF, Lai S, Okun MS, Vaillancourt DE (2015): Longitudinal changes in free‐water within the substantia nigra of Parkinson's disease. Brain 138:2322–2331. [DOI] [PMC free article] [PubMed] [Google Scholar]
- Opavský R, Hluštík P, Otruba P, Kaňovský P (2011): Sensorimotor network in cervical dystonia and the effect of botulinum toxin treatment: A functional MRI study. J Neurol Sci 306:71–75. [DOI] [PubMed] [Google Scholar]
- Opavský R, Hluštík P, Otruba P, Kaňovský P (2012): Somatosensory cortical activation in cervical dystonia and its modulation with botulinum toxin: An fMRI study. Int J Neurosci 122:45–52. [DOI] [PubMed] [Google Scholar]
- Pasternak O, Sochen N, Gur Y, Intrator N, Assaf Y (2009): Free water elimination and mapping from diffusion MRI. Magn Reson Med 62:717–730. [DOI] [PubMed] [Google Scholar]
- Pidcock FS, Hoon AH, Jr , Johnston MV (1999): Trihexyphenidyl in posthemorrhagic dystonia: Motor and language effects. Pediatr Neurol 20:219–222. [DOI] [PubMed] [Google Scholar]
- Pinheiro GLS, Guimarães RP, Piovesana LG, Campos BM, Campos LS, Azevedo PC, Torres FR, Amato‐Filho AC, França MC, Lopes‐Cendes I, Cendes F, D'Abreu A (2015): White matter microstructure in idiopathic craniocervical dystonia. Tremor Hyperkinetic Mov doi: 10.7916/D86972H6. [DOI] [PMC free article] [PubMed] [Google Scholar]
- Planetta PJ, Ofori E, Pasternak O, Burciu RG, Shukla P, DeSimone JC, Okun MS, McFarland NR, Vaillancourt DE (2015): Free‐water imaging in Parkinson's disease and atypical parkinsonism. Brain 139:495–508. [DOI] [PMC free article] [PubMed] [Google Scholar]
- Prudente CN, Hess EJ, Jinnah HA (2014): Dystonia as a network disorder: What is the role of the cerebellum?. Neuroscience 260:23–35. [DOI] [PMC free article] [PubMed] [Google Scholar]
- Prudente CN, Stilla R, Singh S, Buetefisch C, Evatt M, Factor SA, Freeman A, Hu XP, Hess EJ, Sathian K, Jinnah HA (2016): A functional magnetic resonance imaging study of head movements in cervical dystonia. Front Neurol 7:201. eCollection 2016. [DOI] [PMC free article] [PubMed] [Google Scholar]
- Ramdhani RA, Kumar V, Velickovic M, Frucht SJ, Tagliati M, Simonyan K (2014): What's special about task in dystonia? A voxel‐based morphometry and diffusion weighted imaging study. Mov Disord 29:1141–1150. [DOI] [PMC free article] [PubMed] [Google Scholar]
- Ramdhani RA, Simonyan K (2013): Primary dystonia: Conceptualizing the disorder through a structural brain imaging lens. Tremor Other Hyperkinet Mov (NY) 3:tre‐03‐152‐3638‐4. [DOI] [PMC free article] [PubMed] [Google Scholar]
- Spraker MB, Prodoehl J, Corcos DM, Comella CL, Vaillancourt DE (2010): Basal ganglia hypoactivity during grip force in drug naïve Parkinson's disease. Hum Brain Mapp 31:1928–1941. [DOI] [PMC free article] [PubMed] [Google Scholar]
- Tang JKH, Mahant N, Cunic D, Chen R, Moro E, Lang AE, Lozano AM, Hutchison WD, Dostrovsky JO (2007): Changes in cortical and pallidal oscillatory activity during the execution of a sensory trick in patients with cervical dystonia. Exp Neurol 204:845–848. [DOI] [PubMed] [Google Scholar]
- Teo JTH, van de Warrenburg BPC, Schneider SA, Rothwell JC, Bhatia KP (2009): Neurophysiological evidence for cerebellar dysfunction in primary focal dystonia. J Neurol Neurosurg Psychiatry 80:80–83. [DOI] [PubMed] [Google Scholar]
- Termsarasab P, Thammongkolchai T, Frucht SJ (2016): Medical treatment of dystonia. J Clin Mov Disord 3:19. [DOI] [PMC free article] [PubMed] [Google Scholar]
- Tinazzi M, Fiorio M, Fiaschi A, Rothwell JC, Bhatia KP (2009): Sensory functions in dystonia: Insights from behavioral studies. Mov Disord 24:1427–1436. [DOI] [PubMed] [Google Scholar]
- de Vries PM, Johnson KA, de Jong BM, Gieteling EW, Bohning DE, George MS, Leenders KL (2008): Changed patterns of cerebral activation related to clinically normal hand movement in cervical dystonia. Clin Neurol Neurosurg 110:120–128. [DOI] [PubMed] [Google Scholar]