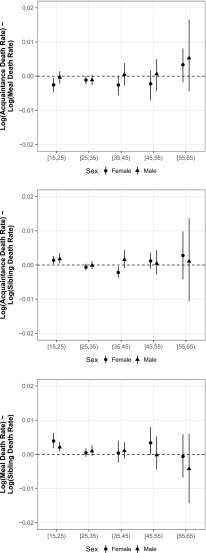
Fig. 5.
Age-specific differences between the estimated log death rate using (1) the acquaintance network and the meal network (top panel); (2) the acquaintance network and the sibling histories (middle panel); and (3) the meal network and the sibling histories (bottom panel). Above the dotted line, estimated death rates from the meal or acquaintance network are higher. These estimates are presented in tabular form in Online Resource 1 (section D)

