

Abstract
Dietary supplements have exhibited myriads of positive health effects on human health conditions and with the advent of new technological advances, including in the fields of proteomics, genomics, and metabolomics, biological and pharmacological activities of dietary supplements are being evaluated for their ameliorative effects in human ailments. Recent interests in understanding and discovering the molecular targets of phytochemical-gene-protein-metabolite dynamics resulted in discovery of a few protein signature candidates that could potentially be used to assess the effects of dietary supplements on human health. Persimmon (Diospyros kaki) is a folk medicine, commonly used as dietary supplement in China, Japan, and South Korea, owing to its different beneficial health effects including anti-diabetic implications. However, neither mechanism of action nor molecular biomarkers have been discovered that could either validate or be used to evaluate effects of persimmon on human health. In present study, Mass Spectrometry (MS)-based proteomic studies were accomplished to discover proteomic molecular signatures that could be used to understand therapeutic potentials of persimmon leaf extract (PLE) in diabetes amelioration. Saliva, serum, and urine samples were analyzed and we propose that salivary proteins can be used for evaluating treatment effectiveness and in improving patient compliance. The present discovery proteomics study demonstrates that salivary proteomic profile changes were found as a result of PLE treatment in prediabetic subjects that could specifically be used as potential protein signature candidates.
Keywords: biomarker candidates, diabetes, mass spectrometry, persimmon leaf extract, proteomics, saliva, serum, urine
INTRODUCTION
Diabetes mellitus, the most prevalent form of diabetes, is a metabolic disease due to impaired insulin secretion and/or action (Das and Elbein, 2006), which causes hyperglycemia (Gerich, 1998). In 2010, an estimated 285 million people worldwide were affected by diabetes, and this figure is predicted to reach 439 million by 2030 (Shaw et al., 2010). Over the next decade, the diabetes related long-term complications, morbidity, and mortality are expected to be more prevalent due to increasing rates of childhood and adulthood obesity (CDC, Atlanta, USA). Therefore, not only effective approaches to control blood glucose levels are required but also the novel, multi-directional approaches that help in monitoring the metabolic and proteomic changes associated with the diabetes are needed. Although, along with the pharmacotherapy, life style interventions including diet and exercise can help patients with diabetic complications (Yamagishi and Imaizumi, 2005), novel protein biomarkers that can be used in assessing proteome changes, as a function of anti-diabetic therapeutics treatment will be very useful in evaluating the treatment success as well as patient compliance. The most common oral medicines to control sugar levels in diabetic patients, Thiazolidinediones and Metformin® , often causes either weight gain and/or organ toxicity (Derosa and Maffioli, 2011; Mitri and Hamdy, 2009). Hence alternative strategies to manage glucose levels in diabetics are required, including development and evaluation of traditional/folk medicines, food supplements, along with the standard drug-therapy.
Persimmon (Diospyros kaki) is a traditional medicinal plant, widely cultivated in China, Japan, and South Korea and has been commonly used in folk medicine in East Asia (Han et al., 2002) owing to its different pharmacological activities; including anti-allergic (Kotani et al., 2000), antihypertensive (Kawakami et al., 2011), antioxidant (Sun et al., 2011), hypotensive (Kameda et al., 1987), and vasorelxant effects (Kawakami et al., 2011). Persimmon fruits possess high levels of dietary fiber, vitamin C, catechin and gallocatechin whereas persimmon leaf extract (PLE) mainly consists of caffeine, chlorophyll, flavonoids (including therapeutic constituents, astragalin, hyperin, isoquercitrin, kaempferol, quercetin), organic acids, phenolic compounds, tannins, and vitamins (Lee et al., 2006). As a folk medicine, PLE and whole persimmon leaf have widely used to treat hypertensive disease and apoplexy syndrome in China and Japan (Bei et al., 2004; Funayama and Hikino, 1979) and in clinical studies of PLE, flavonoids constituents exhibited therapeutic potential against atopic dermatitis (Matsumoto et al., 2002), medulloblastoma (Labbe et al., 2009), as well as airway inflammation (Kwon et al., 2009). Overall, PLE constituents have shown a wide variety of biological and pharmacological potentials, including beneficial health effects in treating allergies, constipation, dermatitis, diuresis, and inflammation: (i) anti-oxidant, anti-inflammatory, anti-cancer, and anti-allergic properties of quercetin (Gao et al., 2009; Rogerio et al., 2010) (ii) anti-oxidative properties of kaempferol (Barve et al., 2009; Kim et al., 2010); and (iii) various therapeutic activities of triterpenoids (Chen et al., 2002; Thoung et al., 2008), polyphenol (An et al., 2005), betulinic acid 3-caffeate (Ma et al., 2008). Interestingly, persimmon seed extract has also shown radical scavenging activities in both, in vitro and in vivo systems (Ahn et al., 2002). Also, a wide variety of natural products extracted from persimmon include steroids, terpenoids, polyphenols, and naphthoquinones (Mallavadhani et al., 1998); out of which, triterpenoids inhibited protein tyrosine phosphatase 1B (Thoung et al., 2008), polyphenols and proanthocyanidins exhibited α-amylase inhibitory potential (Kawakami et al., 2010), and Vomifoliol 9-O-α-arabinofuranosyl (1→6)-β-D-glucopyranoside stimulated glucose uptake in HepG2 and 3T3-L1 cells (Wang et al., 2011). Other in vivo studies reported the components from persimmon leaf ameliorate diabetic conditions; including dyslipidemia, hyperglycemia, and hepatic fat accumulation in type 2 diabetic mice model (Bae et al., 2015; Jung et al., 2012; Lee et al., 2006). Despite the reported beneficial health effects of PLE on different health conditions, little is known about its pharmacological effects on disease amelioration in diabetic patients.
Dietary supplements have exhibited myriads of positive health effects in different human ailments and over time, new technological advances, including in the fields of proteomics, genomics, and metabolomics, contributed immensely in understanding biological and pharmacological activities of dietary supplements (Astle et al., 2007), with particular emphasis on discovering molecular targets of phytochemicalgene-protein-metabolite dynamics (Milner, 2002). It is reported that the individual responses to dietary supplements are variable/pleiotropic and the food supplements may influence multiple biological pathways (Astle et al., 2007). The proteome, unlikely to relatively static genome, changes dynamically in response to thousands of inter-, intra- and extracellular signals and modulations, thereby reflects the health and/or pathogenesis conditions more accurately. For the last two decades, mass spectrometry (MS) based proteomics, particularly quantitative proteomics, has contributed significantly to the discovery of several biomarkers associated with different human pathophysiology; including irritable bowel syndrome, inflammation, renal failure, interstitial cystitis, Parkinson disease, cancer, diabetes etc (Acosta-Martin et al., 2011; Goo and Goodlett, 2010; Goo et al., 2010; 2012; Herrero et al., 2012; Kim et al., 2010; Lin et al., 2012; Matheson et al., 2010; Pan et al., 2012; Sanna et al., 2015; Zhang et al., 2005). Interestingly, quantitative proteomics based biomarker discovery has been successfully accomplished in all kinds of biological samples; including serum, saliva, urine, and tissues (Goo and Goodlett, 2010). Several biomarkers discovered using proteomics have been graduated into validated assays and are being applied routinely within the clinic, thereby leaving enormous impact on public health. Potentially, discovery of biomarker candidate(s) that could reliably reflect the recent and/or habitual consumption of dietary supplements would greatly help in assessing therapeutic and prophylactic effects of food supplements on human health conditions. In the present MS based proteomics study, we aim to find molecular markers that can be used to evaluate efficacy of PLE dietary supplements on diabetes amelioration, based upon the proteomic profile changes in saliva, serum, and urine samples obtained from the prediabetic patients under PLE treatment.
MATERIAL AND METHODS
Preparation of persimmon leaf extract
PLE was obtained from Wanju (Korea) by Dongsangmyeon Saramdeul Inc., as described previously (Bae et al., 2015). PLE was standardized to contain 7.5 mg total Quercetin 3-O-2″galloylglucoside (C24H24O19) and Kaempferol 3-O-2″galloylglucoside (C24H24O18) per 1 g of extract. It was administered as a tablet (500 mg/tab and 2 g/day) composed of 62.6% PLE and 37.4% diluting agent. The placebo tablets were matched with regard to flavor, appearance, and dosage. All subjects were instructed to take 4 tab/day (2 tablets each after breakfast and dinner). PLE and placebo tablets were packaged indistinguishably and labeled with the subject’s number.
Subject recruitment, experiment design, and sample collection
The study subjects were recruited from the Clinical Trial Center for Functional Foods at Chonbuk National University Hospital, Jeonju, Republic of Korea during 2014. Subjects of both sexes 20–75 years of age with prediabetes [fasting plasma glucose (FPG) 100–140 mg/dl or impaired glucose tolerance (IGT) 140–250 mg/dl] who had not been diagnosed with any disease and met the inclusion criteria were recruited for this study (Table 1 and 2). All participants gave written informed consent prior to beginning the study. The protocol was approved by the Functional Foods Institutional Review Board (FFIRB) of Chonbuk National University Hospital (FFIRB number: 2013-02-016).
Table 1.
Postprandial glucose obtained prior to and after treatment with PLE or placebo
| PLE group (n = 34) | Placebo group (n = 34) | ||||||
|---|---|---|---|---|---|---|---|
|
|
|
||||||
| 0 w | 8 w | p-value1) | 0 w | 8 w | p-value1) | p-value2) | |
|
|
|
||||||
| PPG120 min (mg/dl) | 171.36 ± 38.38 | 160.91 ± 35.62 | 0.133 | 164.73 ± 32.95 | 172.03 ± 33.61 | 0.126 | 0.029* |
Values are presented as mean ± S.D.
Paired t-test,
Linear mixed model,
p < 0.05
Table 2.
Demographic characteristics of the study participants
| Subjects (n = 5) | |
|---|---|
| Age (year) | 58.00 ± 8.43 |
| Sex (M/F) | 2/3 |
| Height (cm) | 158.60 ± 6.02 |
| Weight (kg) | 62.80 ± 7.12 |
| BMI (kg/m2) | 24.90 ± 1.17 |
| FPG (mg/dl) | 103.80 ± 12.17 |
| 2 h-PPG (mg/dl) | 158.60 ± 14.22 |
Participants with prediabetic condition were subjected to a randomized crossover study where they were treated with persimmon leaf extract (PLE, n = 5) or placebo (n = 5) twice a day for eight weeks, followed by a four-week wash out period before inverting the treatment regimen (Fig. 1). Saliva, serum, and urine samples from the study subjects were collected for proteomic analyses.
Fig. 1. Experimental design for a randomized crossover study.

Five subjects with mild diabetic condition were enrolled for the study and were given PLE or placebo for 8 weeks followed by 4 weeks washout period. The same patients were then subjected for reversible treatments for another 8 weeks from week 12 to 20. The body fluids, saliva, urine, and serum were collected in week 0, 8, 12, and 20.
Sample preparation for mass spectrometry (MS) analysis
Saliva
Saliva samples were prepared by using a modified method from Vitorino et al. (Vitorino et al., 2012), termed as bicarbonate/acetonitrile extraction method. Briefly, 2 ml of saliva sample was diluted to a final concentration of 50 mM ammonium bicarbonate (pH 8.3) and 20% (v/v) acetonitrile and half of the anti-protease tablet (Roche, EDTA free, Roche Diagnostics GmbH, Germany) was added. The solution was incubated for 5 min at room temperature (RT), prior to centrifugation at 1,400 rpm for 10 min at RT. Supernatant was collected in a new eppendorf tube, BCA assay (Thermo Fisher Scientific Inc., USA) for protein concentration measurement as well as gel analyses for protein integrity check was done on supernatant before sample preparation for LC-MS/MS.
Urine
Urine samples were processed following the method outlined in a previous study (Goo et al., 2012). Briefly, ~10 ml of urine samples per subject were thawed at RT and then half of the anti-protease tablet (Roche) was added to avoid protein degradation. Samples were centrifuged at 2000 rpm for 10 min at 4°C and supernatant was collected. Using a Amicon Ultra-15 Centrifugal MWCO 3 kDa filter (EMD Millipore, USA), sample supernatant volume was reduced to ~0.5 – 1 ml. To accomplish TCA precipitation for protein purification from concentrated urine samples, samples and TCA were mixed at 1: 1 ratio using 20% TCA (ice-cold, made fresh) followed by vortex for 15 s. Sample was left on ice for additional 30 min, followed by centrifugation at 14,000 rpm for 15 min at 4°C. Supernatant was discarded and the pellet was washed twice with 100 μl of cold acetone, centrifuged, and the pellet was air-dried for few seconds, prior to re-suspending in 1 ml of 0.5 × PBS. BCA assay and gel analyses were done on processed urine samples, before exposing them to trypsin digestion and LC-MSMS analyses.
Serum
Undepleted serum samples (300 μg, ~3 μl) were used for the study without further sample treatment.
Following the BCA analysis of the samples 100 μg of protein per sample (300 μg for undepleted serum) was used for trypsin digestion.
Protein digestion, alkylation, and desalting
Filter-aided sample preparation (FASP) method for protein digestion, alkylation, and desalting was adapted from Wiśniewski et al. (2009). Briefly, 100 μg of protein sample (300 μg for undepleted serum) was mixed with 250 μl of 7.5 mM Tris-(2-carboxyethyl)-phosphine hydrochloride (TECP), 8M Urea, and 100mM Ammonium bicarbonate pH 8.0 (Ambic) and loaded into a 3K MWCO filter, followed by incubation in a dry-bath at 37°C for 1 h. Post-reduction, sample was centrifuged at 14,000 rpm for 15 min and after adding 250 μl of 8M Urea, 100 mM Ambic, and 50 mM Iodoacetamide (IAM), the reaction was left for alkylation in dark for 1 h at room temperature. Post-alkylation, sample was centrifuged at 14,000 rpm for 15 min and 25 μl of 500 mM DL-Dithiothreitol (DTT) was added by pipetting to deactivate residual IAM and sample was centrifuged again. Processed sample was further washed four-times with 300 μl of 50 mM Ambic, each time discarding the filtrate, before collecting the clean sample for trypsinization. Trypsin (Promega, Mass spectrometry grade, USA) was added to the sample in 50 protein: 1 trypsin weight ratio and incubated for overnight at 37°C. Digested samples were diluted to a final concentration of 95% water: 5% acetonitrile: 0.1% trifluoroacetic acid and speedvac to dryness. Dried peptides were resuspended in 95% water: 5.0% acetonitrile: 0.1% formic acid to a concentration of 0.5 μg/μl protein. Samples were stored at -80°C till LC-MS/MS analyses.
LC-ESI-MS/MS analyses, data acquisition and data processing
Trypsin-digested samples were analyzed using MS/MS data-dependent acquisition by electrospray ionization in the positive ion mode on a tribrid quadrupole-orbitrap-ion trap mass spectrometer (Orbitrap Fusion™; Thermo Fisher, USA). The Fusion was coupled with a nanoflow LC system (NanoAcquity ™, Waters Corporation, USA) equipped with online helium-degasser. Prior to peptide separation on a homemade 75 μm i.d. ×180 mm long analytical column pulled using a Sutter Instruments P-2000 CO2 laser puller (Sutter Instrument Company, USA) and packed with 5 μm (100 Å pore, C18AQ: Michrom BioResources Inc., USA) particle, peptides were trapped on an in-house packed 100 μm i.d. ×20 mm long pre-column (5 μm, 200 Å pore, C18AQ; Michrom Bio-Resources). An estimated 1 μg of peptide mixture was injected per-LC-MS/MS run onto a pre-column at 4 μl/min flow rate using mobile phase-A (water, 0.1% formic acid) and mobile phase-B (acetonitrile, 0.1% formic acid) in a A:B ratio 95/5. Peptides were separated and eluted using an acetonitrile gradient of 5–35% (mobile phase-B) over 30 min for a total of 95 min duration. Data-dependent MS acquisition was accomplished using Xcalibur v3.0 (Thermo Fisher), followed by tandem mass spectrometry (MS/MS) data acquisition for the 20 most abundant precursor ions, excluding singly charged ions. To avoid/minimize any data redundancy, dynamic range was set for 60 s. All samples were run in triplicate and ion source conditions were optimized using the vendor-recommended tuning and calibration solutions, prior to any acquisition. Tandem MS data were queried for protein identification against the UniprotKB H. sapiens database using MaxQuant v1.5 using the following search parameters: peptide mass tolerance set at 4.5 ppm; a maximum of 2 missed cleavage site allowed; variable modification/differential search option set for oxidized methionine and protein N-term acetylation, fixed modification of carbamidomethyl on cysteine, and trypsin cleavage site after arginine or lysine (except when followed by proline). Label-free quantification, spectral-count, was also carried out by MaxQuant v1.5 (Cox and Mann, 2008; Cox et al., 2014). Briefly, MS data were analyzed by MaxQuant equipped with an Andromeda search engine (Cox et al., 2011) employing an UniprotKB Homo sapiens database by considering peptide precursor and fragment ions mass tolerance of 20 ppm. In addition, 1) variable modification/differential search option was set for oxidized methionine and protein N-terminal acetylation, 2) fixed modification for carbamidomethyl on cysteine, 3) a maximum of 2 missed cleavage sites were allowed, 4) under the same mass tolerance, “Second peptides” option was enabled, 5) Peptide-spectrum matches (PSM) and protein identifications were filtered at a false discovery rate (FDR) of 0.01; and 6). LFQ minimum ratio count of 2 was considered for further analysis.
Statistical analysis
Proteins that were identified with ≥ 2 peptides were subjected to a label-free quantitation in order to compare relative expression in control and PLE-treated samples. MaxQuant LFQ intensities were converted to Log2 values using Perseus software (version 1.5.0.9) and differences in relative expression of proteins [(Log2 (postPLE/prePLE) and Log2 (postPlacebo/prePlacebo) of ≥ +1 or ≤ -1 (± 2-folds)], principle component analyses, and cluster analyses were achieved in Perseus. The t-test was used to test statistical significance with differences considered as statistically significant for p-values < 0.05 between two treatment groups. The data filtering was accomplished using R v3.2.2 statistics software tool. Volcano plots for t-test significance were obtained by plotting the negative log10 p-value on the y-axis (significance) and the log2 of protein expression fold changes between the two conditions on x-axis. The values toward the top of the plot (horizontal line: p-value = 0.05) represent high statistical significance.
Western blot analysis
Western blotting was used to validate the observed potential biomarker candidate(s) levels in pre-PLE and post-PLE treatment patient groups. 10 μg of protein extract was electrophoresed on 4–15% gradient gels (Mini-PROTEAN TGX™, BioRad, USA) and transferred to polyvinylidene fluoride (PVDF) membrane using the wet transfer method at 350 mA, for 1 h over ice. Membrane was washed in tris buffered saline w/0.1% tween 20 (TBST), blocked with 5% bovine serum albumin (BSA) in TBST for an hour and probed overnight at 4°C with primary antibodies for, mouse monoclonal Ezrin (Abcam, USA) or polyclonal Sheep human Uromodulin antibody (R&D Systems, USA), rabbit monoclonal GAPDH (Cell Signaling Technology-CST, USA). Membrane was washed in TBST and probed with secondary antibodies, anti-Mousehorse radish peroxidase (HRP) (1:5000, Cell Signaling Technology-CST) or anti-Rabbit-HRP (1:5000, BioLegend, USA) or anti-sheep-HRP (1:5000, Abcam). Membrane was developed by enhanced chemiluminescence (Amersham ECL® Select, GE Healthcare, USA).
RESULTS AND DISCUSSION
Effect of PLE treatment in protein expression
The goal of this study was to find protein marker(s) that can be used to evaluate efficacy of PLE dietary supplements on diabetes amelioration, based upon the proteomic profile changes in different body fluids obtained from the prediabetic patients following controlled PLE intake. PLE-treatment showed an improvement in the blood glucose level of enrolled participants as determined by the PPG levels, in comparison to placebo treated group (Table 1). Five subjects with prediabetic condition (Table 2) were participated in 20 week long study where the different body fluid samples, saliva, urine, and serum, were collected in four time points at week 0, 8, 12, and 20 as described in the Fig. 1 for proteomics study. Data obtained from the different time points were subjected for various statistical analyses. Initial t-test showed no significant difference in protein expression levels post PLE treatment. Principal component analysis (PCA) revealed that better correlation within individual subject, but not by the PLE treatment, suggesting the ameliorative effects caused by the PLE might be too minimal to overcome individual’s genetic barrier. The same observation was made from all different sample types including saliva, serum, and urine (Fig. 2).
Fig. 2. Principle component analyses (PCA) for five study subjects (P1–P5) and their four visits (V1–V4) for different body fluid samples, (A) saliva, (B) serum, and (C) urine samples.

This initial observation prompted an alternative analytical approach to look for changes induced by the PLE treatment as shown in Fig. 3. First, protein lists for proteomic changes between two major groups; PLE treatment (PostPLE) versus Pre PLE treatment (PrePLE) and PostPlacebo versus PrePlacebo were populated based on the criteria that any protein that show Log2-fold change of ≥ +1 or ≤ −1 (2-fold up and down regulation, respectively) should be listed. Second, common proteins present in the placebo group (PostPlacebo versus PrePlacebo) were removed from the treatment group (PostPLE versus PrePLE), in order to get unique proteins list potentially due to PLE treatment but not due to genetic or environmental effects. Finally, the proteins that showed consistent up/down-regulation in at least three out of five patients group were analyzed for their relevance to diabetes and termed as potential protein marker(s) of PLE treatment. The candidate protein list, that met above described criteria, and their expression level are shown in Table 3 and Fig. 4.
Fig. 3. Flow diagram for data processing.
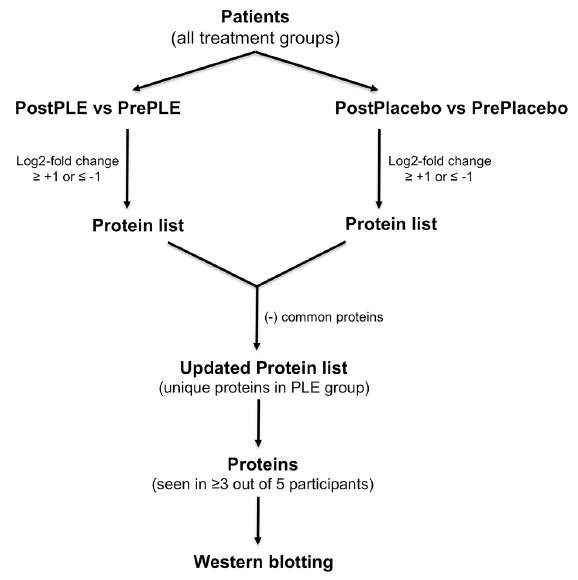
Proteins that are differentially expressed due to the PLE treatment were identified and followed by the Western blot validation when a protein was observed in at least 3 out of 5 study subjects.
Table 3.
Proteins showed at least 2-fold changes among study subjects by the PLE treatment.
| Protein Name | Patient#1 | Patient#2 | Patient#3 | Patient#4 | Patient#5 |
|---|---|---|---|---|---|
| Saliva proteomics analyses | |||||
| SPARC-like protein 1 | −1.24 | ND | ND | −1.66 | −1.13 |
| Ezrin | 1.35 | 1.10 | 1.13 | ND | ND |
| Urine proteomics analyses | |||||
| LAIR-1 | −2.22 | ND | ND | −1.23 | −2.08 |
| IGKV4 | −3.19 | ND | −2.20 | −1.11 | ND |
| IGKV4-1 | 1.29 | ND | 1.30 | ND | 3.97 |
| Complement C7 | −1.43 | ND | −1.45 | ND | −3.81 |
| Uromodulin | ND | ND | −1.14 | −1.08 | −1.27 |
The value represents log2-fold changes (ND = not detected)
Fig. 4. Proteins with expression level changes after the PLE intake in five study subjects (P1–P5).

Proteins that were observed in at least 3 out of 5 study subjects are shown.
While we were able to detect proteins that undergo changes by the PLE treatment in saliva and urine samples, we could not find proteins that showed statistically significant differences in expression from serum samples except for only small fold changes (data not shown). Perhaps the subtle proteomic changes in low-abundance proteins were not detected by mass spectrometry, due to presence of high-abundance proteins (Merrell et al., 2004).
Protein marker(s) of interests
Proteomics results identified salivary and urinary proteins through comparative proteomics analysis between pre and post PLE treatments. Literature search showed no previous implications of SPARC-like protein 1 (SPARC-L 1), leukocyte-associated immunoglobulin-like receptor-1 (LAIR-1), immunoglobulin kappa variable 4 (IGKV4; V4-1), and complement C7 with diabetes (Table 3). Of these, a renal glycoprotein uromdulin, also known as Tamm-Horsfall protein (Lo et al., 2014), showed down-regulation in prediabetic subjects after the PLE treatment whereas, Ezrin (Wasik et al., 2014), which is involved in diabetes and obesity, was found to be upregulated due to PLE-treatment, suggesting ameliorative effects of PLE. Physiological functions of uromodulin are still elusive, despite the fact that it is involved in the pathophysiology of various diseases including diabetes, renal inflammation, acute and chronic kidney diseases. Conventionally, uromodulin was regarded as an instigator in kidney injury; however recent studies suggested it has a protective role in acute kidney inflammation (El-Achkar and Wu, 2012). Furthermore, in chronic kidney disease, uromodulin excretion is increased and has been proposed that uromodulin exacerbates kidney injury. Previously, decreased levels of uromodulin have been correlated with severity of chronic kidney diseases, diabetes, and diabetes-associated albuminuria (Chakraborty et al., 2004; Lapolla et al., 2009; Lo et al., 2014; Lynn and Marshall, 1984; Roscioni et al., 2013). Though, diabetic patients and patients with early kidney disease have shown increased uromodulin secretion, correlating with the fact that diabetic renal systems might exhibit hyper-filtration (Torffvit and Agardh, 1994). However, microalbuminuria often does not correlate well with uromodulin excretion (Pfleiderer et al., 1993). While baseline uromodulin measurements potentially are useful in predicting disease progression, longitudinal measurement will provide more accurate picture (El-Achkar and Wu, 2012). Urinary proteomics has shown that with down-regulation of uromodulin, albuminuria increases which suggests progressive dysfunction of urinary system, particularly nephrons (Roscioni et al., 2013). Interestingly, Elevated urinary uromodulin levels preceded the development of chronic kidney disease (CKD) and showed association with a common polymer phism in uromodulin gene (Köttgen et al., 2010). In present study, uromodulin expression was found to be down regulated in one patient, while the other two patients showed very subtle changes as found by the Western blot (WB) validation (Fig. 6). Unfortunately we were unable to see strong quantitative correlation for uromodulin in urine samples; in addition GAPDH was used as a loading control for saliva but not detected in urine WB assay. In future studies, we will use transferrin or beta tubulin as a loading control for urine samples, which are better control for urine samples (Beretov et al., 2015). Nonetheless, we were able to detect Uromodulin protein in urine samples by WB assay.
Fig. 6. Western blot validation for prePLE versus postPLE treatments for five study subjects (P1–P5).

Ezrin from saliva samples and Uromodulin from urine samples were validated. GAPDH control for Ezrin is also shown. However uromodulin western blot validation was not very conclusive.
Ezrin is down regulated in glomeruli from slightly diabetic and insulin-resistant obese Zucker rats or in podocytes of type 2 diabetes patients, suggesting ezrin down-regulation may add to the diabetes-mediated kidney diseases (Wasik et al., 2014). Earlier reports suggest that ezrin-podocalyxin-NHERF2 interaction may modulate podocyte functions (Takeda et al, 2001) and a decrease of podocytes causes diabetes related nephropathy in patients (Huang, 2011). WB validation (Fig. 6) confirmed that the PLE treatment resulted in increased expression of ezrin protein levels from the two of three subjects tested. MS efficiently detected Ezrin (P15311; Mol. weight [kDa] 69.4) across the samples with sequence coverage of 39.4%, detecting 23 total peptides with 13 being unique peptides, covering sequence length of 586, intensity 2.9E9, and total MS/MS counts of 339. All in all, we were able to specifically detect and quantify Ezrin levels in salivary samples (Fig. 5); a representative MS/MS spectrum for a unique peptide “SQEQLAAELAEYTAK” (MH+ 1651.8174; m/z 551.2773 for 3+) for Ezrin protein (comet search accuracy = 0.999) is shown in Fig. 7.
Fig. 5. Representative volcano plots obtained for salivary proteome of postPLE vs prePLE and postPlacebo vs prePlacebo groups.

negative log10 p-value on the y-axis (significance) and the log2 of the fold change between the two conditions on x-axis were plotted.
Fig. 7. Representative MS/MS spectrum for Ezrin protein (comet search score = 0.999).

Due to limited number of subjects available, statistically, the study has some limitations, however, this is the first proteomics study that explores the effects of PLE dietary supplement on prediabetic patients from the three different body fluids. Given we don’t have access to the PK/PD data, it is hard to understand the PLE bioavailability. Infact, Naoxinqing, a commercially available PLE tablet showed poor dissolution in water, and Li et al. (2011) showed that the self-nanoemulsifying drug delivery system for PLE improved its bioavailability. Future studies using nanoemulsifying drug delivery systems might help with increased bioavailability, thereby further assisting in PLE-mediated disease amelioration. Nonetheless, a recent discovery based proteomics study reported that SPARC-like protein 1 precursor (SPARCL1) levels were elevated in non-proliferative diabetic retinopathy subjects (Chee et al. 2016). In our study, the PLE-treated patients showed down-regulation of SPARCL1 (Table 3). Interestingly, Gao et al. (2008) characterized the vitreous proteome of nondiabetic individuals (NDM), diabetic with proliferative retinopathy (PDR) or without retinopathy (noDR) and reported elevated levels of the proteins involved in complement system; in comparison to NDM, noDR as well as PDR showed elevated levels of Complement proteins including C 7. Interaction between the coagulation and complement system is well known as they are critically involved in the inflammatory response and can undergo massive activation after injury causing vascular lesions (Amara et al., 2008). In present study, we have found that PLE-treatment group showed down-regulation of Complement C7 (Table 3), suggesting dietary food supplement PLE exhibited ameliorative effects on prediabetic conditions. Further targeted proteomic studies are warranted to comprehensively elucidate the correlation of salivary proteome to the disease progression and/or amelioration, when treated with food supplements or small-molecule drugs.
Diabetes requires non-invasive, easy methodology for life-long glucose monitoring as well as for assessing treatment efficacy associated with the pharmacotherapy. Salivary proteins can be used for evaluating treatment effectiveness as well as improving patient compliance. MS-based proteomic studies were accomplished in order to discover proteomics molecular signatures to understand therapeutic potentials of PLE in diabetes amelioration. Subtle protein changes were observed after PLE treatment from all three-sample types including saliva, urine and serum and a stronger clustering was observed by individuals but not by treatment type. This indicates genetic integrity exceeded the changes may have induced by PLE treatment. In our study design, the intake of PLE was for twice a day for eight weeks. Unlike a drug treatment, food supplements might take longer period to show significant proteomic changes across patient groups. Saliva sample collection is simple, noninvasive, and allows multiple time-points collection of sample with comparative ease thereby aiding in diagnosis, understanding and monitoring disease progression, or treatment responses. Recently, saliva has emerged as an alternative body fluid for clinical diagnostics (Hu et al., 2007), other than urine, which, however, requires comparatively time-consuming sample preparation steps and usually has sample degradation issues. Salivary protein markers, ezrin or SPARCL1 responded well to the PLE-treatment as determined by proteomic analyses; downstream validation for Ezrin by WB validation and previous research supports (Amara et al., 2008; Gao et al., 2008) that PLE treatment implicates possible restoring of the protein function and/or expression for diabetes amelioration. Potentially an antibody-based method can be developed to monitor proteomic changes in salivary proteins using potential biomarker candidate ezrin or SPARCL1. However, a longitudinal study with a bigger patient cohort and longer duration of PLE intake would be needed to follow-up study to assess the specificity and sensitivity of salivary markers. Nonetheless, protein candidate signature(s) from the present study could serve as a starting point for the future quantitative mass spectrometry-based peptidomic analyses, such as multiple- or parallel- reaction monitoring (MRM or PRM) (Shi et al., 2016), in order to accomplish longitudinal data for PLE-treated subjects.
ACKNOWLEDGMENTS
This research was financially supported by the Biomedical Research Institute, Chonbuk National University Hospital. We would like to acknowledge Clinical Trial Center for Functional Foods (CTCF2), Chonbuk National University Hospital, Jeonju, Republic of Korea for contract funding and University of Maryland, Baltimore, School of Pharmacy Mass Spectrometry Center (SOP1841-IQB2014).
REFERENCES
- Acosta-Martin A.E., Panchaud A., Chwastyniak M., Dupont A., Juthier F., Gautier C., Jude B., Amouyel P., Goodlett D.R., Pinet F. Quantitative mass spectrometry analysis using PAcIFIC for the identification of plasma diagnostic biomarkers for abdominal aortic aneurysm. PLoS One. 2011;6:e28698. doi: 10.1371/journal.pone.0028698. [DOI] [PMC free article] [PubMed] [Google Scholar]
- Ahn H.S., Jeon T.I., Lee J.Y., Hwang S.G., Lim Y., Park D.K. Antioxidative activity of persimmon and grape seed extract: in vitro and in vivo. Nutr Res. 2002;22:1265–1273. [Google Scholar]
- Amara U., Rittirsch D., Flierl M., Bruckner U., Klos A., Gebhard F., Lambris J.D., Huber-Lang M. Interaction between the coagulation and complement system. Adv Exp Med Biol. 2008;632:71–79. doi: 10.1007/978-0-387-78952-1_6. [DOI] [PMC free article] [PubMed] [Google Scholar]
- An B.-J., Kwak J.-H., Park J.-M., Lee J.-Y., Park T.-S., Lee J.-T., Son J.-H., Jo C., Byun M.-W. Inhibition of enzyme activities and the antiwrinkle effect of polyphenol isolated from the Persimmon Leaf (Diospyros kaki folium) on human skin. Dermatol Surg. 2006;31:848–855. doi: 10.1111/j.1524-4725.2005.31730. [DOI] [PubMed] [Google Scholar]
- Astle J., Ferguson J.T., German J.B., Harrigan G.G., Kelleher N.L., Kodadek T., Parks B.A., Roth M.J., Singletary K.W., Wenger C.D., et al. Characterization of proteomic and metabolomic responses to dietary factors and supplements. J Nutr. 2007;137:2787–2793. doi: 10.1093/jn/137.12.2787. [DOI] [PubMed] [Google Scholar]
- Bae U.J., Park S.H., Jung S.Y., Park B.H., Chae S.W. Hypoglycemic effects of aqueous persimmon leaf extract in a murine model of diabetes. Mol Med Rep. 2015;12:2547–2554. doi: 10.3892/mmr.2015.3766. [DOI] [PMC free article] [PubMed] [Google Scholar]
- Barve A., Chen C., Hebbar V., Desiderio J., Saw C.L.L., Kong A.N. Metabolism, oral bioavailability and pharmacokinetics of chemopreventive kaempferol in rats. Biopharm Drug Dispos. 2009;30:356–365. doi: 10.1002/bdd.677. [DOI] [PMC free article] [PubMed] [Google Scholar]
- Bei W., Peng W., Ma Y., Xu A. NaoXinQing, an anti-stroke herbal medicine, reduces hydrogen peroxide-induced injury in NG108–15 cells. Neurosci Lett. 2004;363:262–265. doi: 10.1016/j.neulet.2004.04.031. [DOI] [PubMed] [Google Scholar]
- Beretov J., Wasinger V.C., Millar E.K.A., Schwartz P., Graham P.H., Li Y. Proteomic Analysis of Urine to Identify Breast Cancer Biomarker Candidates Using a Label-Free LC-MS/MS Approach. PLoS One. 2015;10:e0141876. doi: 10.1371/journal.pone.0141876. [DOI] [PMC free article] [PubMed] [Google Scholar]
- Centers for Disease Control and Prevention. National diabetes fact sheet: national estimates and general information on diabetes and prediabetes in the United States, 2011. Atlanta, GA: U.S. Department of Health and Human Services, Centers for Disease Control and Prevention; 2011. [Google Scholar]
- Chakraborty J., Below A.A., Solaiman D. Tamm-Horsfall protein in patients with kidney damage and diabetes. Urol Res. 2004;32:79–83. doi: 10.1007/s00240-003-0374-6. [DOI] [PubMed] [Google Scholar]
- Chee C.S., Chang K.M., Loke M.F., Angela Loo V.P., Subrayan V. Association of potential salivary biomarkers with diabetic retinopathy and its severity in type-2 diabetes mellitus: a proteomic analysis by mass spectrometry. PeerJ. 2016;4:e2022. doi: 10.7717/peerj.2022. [DOI] [PMC free article] [PubMed] [Google Scholar]
- Chen G., Lu H., Wang C., Yamashita K., Manabe M., Xu S., Kodama H. Effect of five triterpenoid compounds isolated from leaves of Diospyros kaki on stimulus-induced superoxide generation and tyrosyl phosphorylation in human polymorphonuclear leukocytes. Clinica Chimica Acta. 2002;320:11–16. doi: 10.1016/s0009-8981(02)00021-9. [DOI] [PubMed] [Google Scholar]
- Cox J., Mann M. MaxQuant enables high peptide identification rates, individualized p.p.b.-range mass accuracies and proteome-wide protein quantification. Nat Biotechnol. 2008;26:1367–1372. doi: 10.1038/nbt.1511. [DOI] [PubMed] [Google Scholar]
- Cox J., Neuhauser N., Michalski A., Scheltema R.A., Olsen J.V., Mann M. Andromeda: a peptide search engine integrated into the MaxQuant environment. J Proteome Res. 2011;10:1794–1805. doi: 10.1021/pr101065j. [DOI] [PubMed] [Google Scholar]
- Cox J., Hein M.Y., Luber C.A., Paron I., Nagaraj N., Mann M. Accurate proteome-wide label-free quantification by delayed normalization and maximal peptide ratio extraction, termed MaxLFQ. Mol Cell Proteom. 2014;13:2513–2526. doi: 10.1074/mcp.M113.031591. [DOI] [PMC free article] [PubMed] [Google Scholar]
- Das S.K., Elbein S.C. The genetic basis of type 2 diabetes. Cell Sci. 2006;2:100–131. doi: 10.1901/jaba.2006.2-100. [DOI] [PMC free article] [PubMed] [Google Scholar]
- Derosa G., Maffioli P. Thiazolidinediones plus metformin association on body weight in patients with type 2 diabetes. Diabetes Res Clin Pract. 2011;91:265–270. doi: 10.1016/j.diabres.2010.08.001. [DOI] [PubMed] [Google Scholar]
- El-Achkar T.M., Wu X.-R. Uromodulin in kidney injury: an instigator, bystander, or protector? Am. J Kidney Dis. 2012;59:452–461. doi: 10.1053/j.ajkd.2011.10.054. [DOI] [PMC free article] [PubMed] [Google Scholar]
- Funayama S., Hikino H. Hypotensive principles of Diospyros kaki leaves. Chem Pharm Bull. 1979;27:2865–2868. doi: 10.1248/cpb.27.2865. [DOI] [PubMed] [Google Scholar]
- Gao B.B., Chen X., Timothy N., Aiello L.P., Feener E.P. Characterization of the vitreous proteome in diabetes without diabetic retinopathy and diabetes with proliferative diabetic retinopathy. J Proteome Res. 2008;7:2516–2255. doi: 10.1021/pr800112g. [DOI] [PubMed] [Google Scholar]
- Gao Y., Wang Y., Ma Y., Yu A., Cai F., Shao W., Zhai G. Formulation optimization and in situ absorption in rat intestinal tract of quercetin-loaded microemulsion. Colloids Surf B. 2009;71:306–314. doi: 10.1016/j.colsurfb.2009.03.005. [DOI] [PubMed] [Google Scholar]
- Gerich J.E. The Genetic Basis of Type 2 Diabetes Mellitus: Impaired Insulin Secretion versus Impaired Insulin Sensitivity. Endocr Rev. 1998;19:491–503. doi: 10.1210/edrv.19.4.0338. [DOI] [PubMed] [Google Scholar]
- Goo Y.A., Goodlett D.R. Advances in proteomic prostate cancer biomarker discovery. J Proteomics. 2010;73:1839–1850. doi: 10.1016/j.jprot.2010.04.002. [DOI] [PubMed] [Google Scholar]
- Goo Y.A., Tsai Y.S., Liu A.Y., Goodlett D.R., Yang C.C. Urinary proteomics evaluation in interstitial cystitis/painful bladder syndrome: a pilot study. Int Braz J Urol. 2010;36:464–479. doi: 10.1590/s1677-55382010000400010. [DOI] [PubMed] [Google Scholar]
- Goo Y.A., Cain K., Jarrett M., Smith L., Voss J., Tolentino E., Tsuji J., Tsai Y.S., Panchaud A., Goodlett D.R., et al. Urinary proteome analysis of irritable bowel syndrome (IBS) symptom subgroups. J Proteome Res. 2012:5650–5662. doi: 10.1021/pr3004437. [DOI] [PMC free article] [PubMed] [Google Scholar]
- Han J., Kang S., Choue R., Kim H., Leem K., Chung S., Kim C., Chung J. Free radical scavenging effect of Diospyros kaki, Laminaria japonica and Undaria pinnatifida. Fitoterapia. 2002;73:710–712. doi: 10.1016/s0367-326x(02)00236-8. [DOI] [PubMed] [Google Scholar]
- Herrero M., Simó C., García-Cañas V., Ibáñez E., Cifuentes A. Foodomics: MS-based strategies in modern food science and nutrition. Mass Spectrom Rev. 2012;31:49–69. doi: 10.1002/mas.20335. [DOI] [PubMed] [Google Scholar]
- Hu S., Loo J.A., Wong D.T. Human saliva proteome analysis and disease biomarker discovery. Exp Rev Proteom. 2007;4:531–538. doi: 10.1586/14789450.4.4.531. [DOI] [PubMed] [Google Scholar]
- Huang Q. Ezrin/Radixin/Moesin proteins in the development of diabetes and its cardiovascular complications. J Diabetes Metab Disord. 2011;1 S4:005. [Google Scholar]
- Jung U.J., Park Y.B., Kim S.R., Choi M.S. Supplementation of Persimmon leaf ameliorates hyperglycemia, dyslipidemia and hepatic fat accumulation in type 2 diabetic mice. PLoS One. 2012;7:e49030. doi: 10.1371/journal.pone.0049030. [DOI] [PMC free article] [PubMed] [Google Scholar]
- Merrell K., Southwick K., Graves S.W., Esplin M.S., Lewis N.E., Thulin C.D. Analysis of low-abundance, low-molecularweight serum proteins using mass spectrometry. J Biomol Tech. 2004;15:238–248. [PMC free article] [PubMed] [Google Scholar]
- Kameda K., Takaku T., Okuda H., Kimura Y., Okuda T., Hatano T., Agata I., Arichi S. Inhibitory effects of various flavonoids isolated from leaves of persimmon on angiotensin-converting enzyme activity. J Nat Prod. 1987;50:680–683. doi: 10.1021/np50052a017. [DOI] [PubMed] [Google Scholar]
- Kawakami K., Aketa S., Nakanami M., Iizuka S., Hirayama M. Major water-soluble polyphenols, proanthocyanidins, in leaves of persimmon (Diospyros kaki ) and their α-amylase inhibitory activity. Biosci Biotech Bioch. 2010;74:1380–1385. doi: 10.1271/bbb.100056. [DOI] [PubMed] [Google Scholar]
- Kawakami K., Aketa S., Sakai H., Watanabe Y., Nishida H., Hirayama M. Antihypertensive and vasorelaxant effects of water-soluble Proanthocyanidins from persimmon leaf tea in spontaneously hypertensive rats. Biosci Biotech Bioch. 2011;75:1435–1439. doi: 10.1271/bbb.100926. [DOI] [PubMed] [Google Scholar]
- Kim J.H., Stevens R.C., MacCoss M.J., Goodlett D.R., Scherl A., Richter R.J., Suzuki S.M., Furlong C.E. Identification and characterization of biomarkers of organophosphorus exposures in humans. Adv Exp Med Biol. 2010;660:61–71. doi: 10.1007/978-1-60761-350-3_7. [DOI] [PMC free article] [PubMed] [Google Scholar]
- Kim J.K., Choi S.J., Cho H.Y., Hwang H.J., Kim Y.J., Lim S.T., Kim C.-J., Kim H.K., Peterson S., Shin D.-H. Protective effects of kaempferol (3,4′,5,7-tetrahydroxyflavone) against amyloid beta peptide (Aβ)-induced neurotoxicity in ICR Mice. Biosci Biotech Bioch. 2010;74:397–401. doi: 10.1271/bbb.90585. [DOI] [PubMed] [Google Scholar]
- Kotani M., Matsumoto M., Fujita A., Higa S., Wang W., Suemura M., Kishimoto T., Tanaka T. Persimmon leaf extract and astragalin inhibit development of dermatitis and IgE elevation in NC/Nga mice. J Allergy Clin Immunol. 2000;106:159–166. doi: 10.1067/mai.2000.107194. [DOI] [PubMed] [Google Scholar]
- Köttgen A., Hwang S.J., Larson M.G., Van Eyk J.E., Fu Q., Benjamin E.J., Dehghan A., Glazer N.L., Kao W.H.L., Harris T.B., et al. Uromodulin Levels Associate with a Common UMOD Variant and Risk for Incident CKD. J Am Soc Nephrol. 2010;21:337–344. doi: 10.1681/ASN.2009070725. [DOI] [PMC free article] [PubMed] [Google Scholar]
- Kwon S.H., Nam J.I., Kim S.H., Kim J.H., Yoon J.-H., Kim K.-S. Kaempferol and quercetin, essential ingredients in Ginkgo biloba extract, inhibit interleukin-1β-induced MUC5AC gene expression in human airway epithelial cells. Phytother Res. 2009;23:1708–1712. doi: 10.1002/ptr.2817. [DOI] [PubMed] [Google Scholar]
- Labbe D., Provencal M., Lamy S., Boivin D., Gingras D., Beliveau R. The flavonols quercetin, kaempferol, and myricetin inhibit hepatocyte growth factor-induced medulloblastoma cell migration. J Nutrition. 2009;139:646–652. doi: 10.3945/jn.108.102616. [DOI] [PubMed] [Google Scholar]
- Lapolla A., Seraglia R., Molin L., Williams K., Cosma C., Reitano R., Sechi A., Ragazzi E., Traldi P. Low molecular weight proteins in urines from healthy subjects as well as diabetic, nephropathic and diabetic-nephropathic patients: a MALDI study. J Mass Spectr. 2009;44:419–425. doi: 10.1002/jms.1520. [DOI] [PubMed] [Google Scholar]
- Lee J.S., Lee M.K., Ha T.Y., Bok S.H., Park H.M., Jeong K.S., Woo M.N., Do G.M., Yeo J.Y., Choi M.S. Supplementation of whole persimmon leaf improves lipid profiles and suppresses body weight gain in rats fed high-fat diet. Food Chem Toxicol. 2006;44:1875–1883. doi: 10.1016/j.fct.2006.06.014. [DOI] [PubMed] [Google Scholar]
- Li W., Yi S., Wang Z., Chen S., Xin S., Xie J., Zhao C. Self-nanoemulsifying drug delivery system of persimmon leaf extract: Optimization and bioavailability studies. Int J Pharm. 2011;420:161–171. doi: 10.1016/j.ijpharm.2011.08.024. [DOI] [PubMed] [Google Scholar]
- Lin X., Cook T.J., Zabetian C.P., Leverenz J.B., Peskind E.R., Hu S.-C., Cain K.C., Pan C., Edgar J.S., Goodlett D.R., et al. DJ-1 isoforms in whole blood as potential biomarkers of Parkinson disease. Sci Rep. 2012;2:954, 1–10. doi: 10.1038/srep00954. [DOI] [PMC free article] [PubMed] [Google Scholar]
- Lo D.J., Kaplan B., Kirk A.D. Biomarkers for kidney transplant rejection. Nat Rev Nephrol. 2014;10:215–225. doi: 10.1038/nrneph.2013.281. [DOI] [PubMed] [Google Scholar]
- Lynn K.L., Marshall R. Excretion of Tamm-Horsfall glycoprotein in renal disease. Clin Nephrol. 1984;22:253–257. [PubMed] [Google Scholar]
- Ma C.-Y., Musoke S.F., Tan G.T., Sydara K., Bouamanivong S., Southavong B., Soejarto D.D., Fong H.H.S., Zhang H.-J. Study of antimalarial activity of chemical constituents from diospyros quaesita. Chem Biodivers. 2008;5:2442–2448. doi: 10.1002/cbdv.200890209. [DOI] [PubMed] [Google Scholar]
- Mallavadhani U.V., Panda A.K., Rao Y.R. Review article number 134 pharmacology and chemotaxonomy of diospyros. Phytochemistry. 1998;49:901–951. doi: 10.1016/s0031-9422(97)01020-0. [DOI] [PubMed] [Google Scholar]
- Matheson A., Willcox M.D.P., Flanagan J., Walsh B.J. Urinary biomarkers involved in type 2 diabetes: a review. Diabetes Metab Res Rev. 2010;26:150–171. doi: 10.1002/dmrr.1068. [DOI] [PubMed] [Google Scholar]
- Matsumoto M., Kotani M., Fujita A., Higa S., Kishimoto T., Suemura M., Milner J.A. Functional foods and health: a US perspective. Br J Nutr. 2002;88:S152. doi: 10.1079/BJN2002680. [DOI] [PubMed] [Google Scholar]
- Mitri J., Hamdy O. Diabetes medications and body weight. Exp Opin Drug Saf. 2009;8:573–584. doi: 10.1517/14740330903081725. [DOI] [PubMed] [Google Scholar]
- Pan S., Chen R., Brand R.E., Hawley S., Tamura Y., Gafken P.R., Milless B.P., Goodlett D.R., Rush J., Brentnall T.A. Multiplex targeted proteomic assay for biomarker detection in plasma: a pancreatic cancer biomarker case study. J Proteome Res. 2012;11:1937–1948. doi: 10.1021/pr201117w. [DOI] [PMC free article] [PubMed] [Google Scholar]
- Pfleiderer S., Zimmerhackl L.B., Kinne R., Manz F., Schuler G., Brandis M. Renal proximal and distal tubular function is attenuated in diabetes mellitus type 1 as determined by the renal excretion of ?1-microglobulin and Tamm-Horsfall protein. Clin Invest. 1993;71:972–977. doi: 10.1007/BF00180026. [DOI] [PubMed] [Google Scholar]
- Rogerio A.P., Dora C.L., Andrade E.L., Chaves J.S., Silva L.F.C., Lemos-Senna E., Calixto J.B. Anti-inflammatory effect of quercetin-loaded microemulsion in the airways allergic inflammatory model in mice. Pharmacol Res. 2010;61:288–297. doi: 10.1016/j.phrs.2009.10.005. [DOI] [PubMed] [Google Scholar]
- Roscioni S.S., de Zeeuw D., Hellemons M.E., Mischak H., Zürbig P., Bakker S.J.L., Gansevoort R.T., Reinhard H., Persson F., Lajer M., et al. A urinary peptide biomarker set predicts worsening of albuminuria in type 2 diabetes mellitus. Diabetologia. 2013;56:259–267. doi: 10.1007/s00125-012-2755-2. [DOI] [PubMed] [Google Scholar]
- Sanna M., Firinu D., Manconi P.E., Pisanu M., Murgia G., Piras V., Castagnola M., Messana I., del Giacco S.R., Cabras T. The salivary proteome profile in patients affected by SAPHO syndrome characterized by a top-down RP-HPLC-ESI-MS platform. Mol BioSyst. 2015;11:1552–1562. doi: 10.1039/c4mb00719k. [DOI] [PubMed] [Google Scholar]
- Shaw J.E., Sicree R.A., Zimmet P.Z. Global estimates of the prevalence of diabetes for 2010 and 2030. Diabetes Res Clin Pract. 2010;87:4–14. doi: 10.1016/j.diabres.2009.10.007. [DOI] [PubMed] [Google Scholar]
- Shi T., Song E., Nie S., Rodland K.D., Liu T., Qian W.J., Smith R.D. Advances in targeted proteomics and applications to biomedical research. Proteomics. 2016;16:2160–2182. doi: 10.1002/pmic.201500449. [DOI] [PMC free article] [PubMed] [Google Scholar]
- Sun L., Zhang J., Lu X., Zhang L., Zhang Y. Evaluation to the antioxidant activity of total flavonoids extract from persimmon (Diospyros kaki L.) leaves. Food Chem Toxicol. 2011;49:2689–2696. doi: 10.1016/j.fct.2011.07.042. [DOI] [PubMed] [Google Scholar]
- Takeda T., McQuistan T., Orlando R.A., Farquhar M.G. Loss of glomerular foot processes is associated with uncoupling of podocalyxin from the actin cytoskeleton. J Clin Invest. 2001;108:289–301. doi: 10.1172/JCI12539. [DOI] [PMC free article] [PubMed] [Google Scholar]
- Tanaka T. Oral administration of persimmon leaf extract ameliorates skin symptoms and transepidermal water loss in atopic dermatitis model mice, NC/Nga. Br J Dermatol. 2002;146:221–227. doi: 10.1046/j.1365-2133.2002.04557.x. [DOI] [PubMed] [Google Scholar]
- Thuong P.T., Lee C.H., Dao T.T., Nguyen P.H., Kim W.G., Lee S.J., Oh W.K. Triterpenoids from the Leaves of Diospyros kaki (Persimmon) and Their Inhibitory Effects on Protein Tyrosine Phosphatase 1B. J Nat Prod. 2008;71:1775–1778. doi: 10.1021/np800298w. [DOI] [PubMed] [Google Scholar]
- Torffvit O., Agardh C.-D. Urinary excretion rate of NC1 and Tamm-Horsfall protein in the microalbuminuric type I diabetic patient. J Diabetes Complications. 1994;8:77–83. doi: 10.1016/1056-8727(94)90055-8. [DOI] [PubMed] [Google Scholar]
- Tyanova S., Temu T., Sinitcyn P., Carlson A., Hein M.Y., Geiger T., Mann M., Cox J. The Perseus computational platform for comprehensive analysis of (prote)omics data. Nat Methods. 2016;13:731–740. doi: 10.1038/nmeth.3901. [DOI] [PubMed] [Google Scholar]
- Vitorino R., Barros A.S., Caseiro A., Ferreira R., Amado F. Evaluation of different extraction procedures for salivary peptide analysis. Talanta. 2012;94:209–215. doi: 10.1016/j.talanta.2012.03.023. [DOI] [PubMed] [Google Scholar]
- Wang L., Xu M.L., Rasmussen S.K., Wang M.-H. Vomifoliol 9-O-α-arabinofuranosyl (1→6)-β-d-glucopyranoside from the leaves of Diospyros Kaki stimulates the glucose uptake in HepG2 and 3T3-L1 cells. Carbohydr Res. 2011;346:1212–1216. doi: 10.1016/j.carres.2011.04.021. [DOI] [PubMed] [Google Scholar]
- Wasik A.A., Koskelainen S., Hyvönen M.E., Musante L., Lehtonen E., Koskenniemi K., Tienari J., Vaheri A., Kerjaschki D., Szalay C., et al. Ezrin is down-regulated in diabetic kidney glomeruli and regulates actin reorganization and glucose uptake via GLUT1 in cultured podocytes. Am J Pathol. 2014;184:1727–1739. doi: 10.1016/j.ajpath.2014.03.002. [DOI] [PubMed] [Google Scholar]
- Wiśniewski J.R., Zougman A., Nagaraj N., Mann M. Universal sample preparation method for proteome analysis. Nat Methods. 2009;6:359–362. doi: 10.1038/nmeth.1322. [DOI] [PubMed] [Google Scholar]
- Yamagishi S.I., Imaizumi T. Diabetic vascular complications: pathophysiology, biochemical basis and potential therapeutic strategy. Curr Pharm Des. 2005;11:2279–2299. doi: 10.2174/1381612054367300. [DOI] [PubMed] [Google Scholar]
- Zhang J., Goodlett D.R., Peskind E.R., Quinn J.F., Zhou Y., Wang Q., Pan C., Yi E., Eng J., Aebersold R.H., et al. Quantitative proteomic analysis of age-related changes in human cerebrospinal fluid. Neurobiol Aging. 2005;26:207–227. doi: 10.1016/j.neurobiolaging.2004.03.012. [DOI] [PubMed] [Google Scholar]